


Aggregated results of the 2026 SREP
1 Introduction
The Supervisory Review and Evaluation Process (SREP) shows that the euro area banking sector has continued to be resilient in the face of the heightened uncertainty clouding the current economic and geopolitical environment.
The evolving macro-financial risks continued to shape the macroeconomic environment in which euro area banks operate. The conflict in the Middle East led to a renewed increase in geopolitical risk across the globe, as well as heightened economic policy uncertainty across Europe, exacerbating the ongoing trade tensions and risks relating to Russia’s war against Ukraine. These developments contributed to increased volatility both on energy markets and in financial asset prices. Current vulnerabilities are still driven by stretched asset valuations by historical standards, concentrated exposures and the potential for further market corrections in an uncertain geopolitical environment.
Despite these headwinds, the euro area economy’s resilience proved greater than expected. Following an initial downward revision after the outbreak of the conflict in the Middle East, the short-term growth outlook improved somewhat, supported by resilient private consumption and robust public spending. Strong household and corporate balance sheets, together with continued fiscal support in some regions, has helped absorb the impact of higher energy prices and tighter financing conditions.
Looking ahead, a stronger and more persistent energy price shock could weaken economic growth prospects and further increase inflationary pressures. At the same time, rising government bond yields and concerns over sovereign debt sustainability in some euro area countries could increase market volatility and borrowing costs. In this environment, the banking sector remains vulnerable to risks stemming from a potential weakening of borrowers’ repayment capacity, higher funding costs and renewed market volatility.
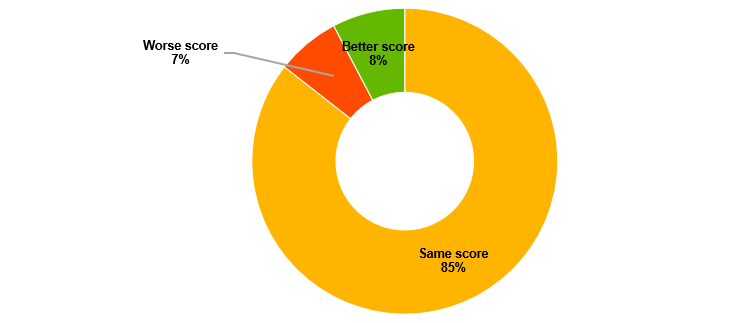
Nonetheless, the euro area banking sector remained resilient, exhibiting strong capital and liquidity positions. The average overall SREP score in 2026 remained stable at 2.5, with 86% of significant institutions being given the same overall score as in 2025. Despite this, there were differences both at the institutional level and across individual risk element scores, with overall scores improving for 8% of the institutions and deteriorating for 7%. Chapter 2 explains how the SREP scores are assigned to banks’ overall risk profiles and the key elements of these scores. Overall, as compared to last year, stronger scores were mainly supported by more solid business model and internal governance assessments, whereas weaker scores largely reflected weaknesses in non-financial risk areas, particularly governance and risk management, operational risk and information and communication technology (ICT) risk.
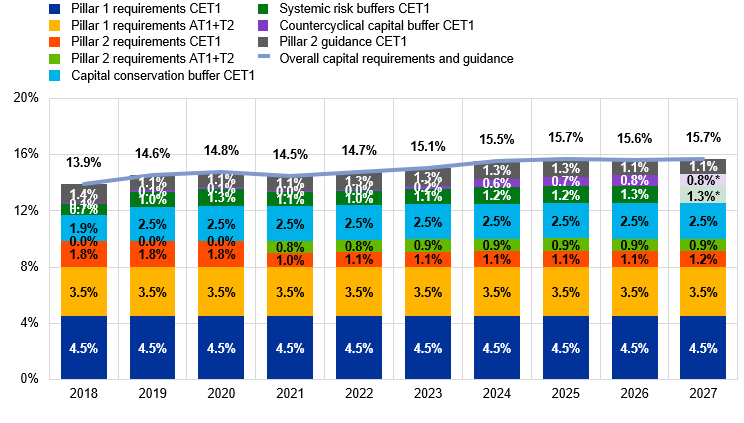
The SREP assessment concluded by setting the capital requirements and issuing the qualitative measures. The overall capital requirements and guidance applicable in 2027 will be 15.7% of risk-weighted assets (RWA). The Pillar 2 requirement (P2R) in total capital continues to be stable at around 2%. Chapter 3 sets out how the P2Rs are set. 2026 is the first year in which a newly revised P2R methodology was applied (see Box 1).
Qualitative measures issued during the 2026 SREP cycle were primarily to address deficiencies in the areas of credit risk, internal governance and operational risk, covering aspects such as credit risk management, non-performing exposures (NPE), the composition of governance bodies, risk data aggregation and risk reporting, or shortcomings linked to ICT governance, operations and security. Legally binding measures were also used to tackle severe weaknesses identified during on-site inspections and horizontal analyses. In addition, ECB Banking Supervision imposed enforcement measures where long-standing deficiencies were not adequately remedied. This is in line with the escalation framework encompassing the range of supervisory powers and legal instruments to be used by supervisors to remediate findings in a timely manner. Chapter 4 elaborates further on the qualitative measures.
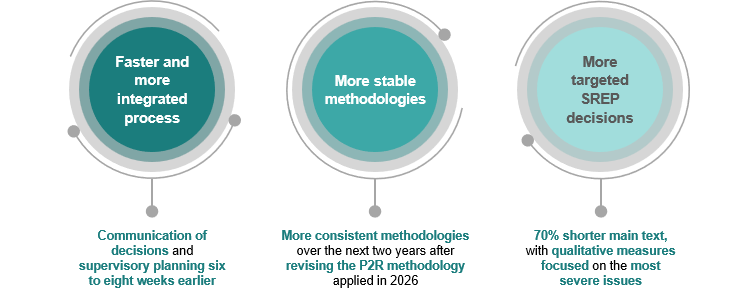
As part of its effort to streamline its supervisory processes, the ECB reformed the SREP, which was completed in 2026. The key outcomes of the SREP reform are shown in Figure 1 below.
Looking ahead, and in line with the 2027-29 supervisory priorities, supervisors will focus on institutions’ financial resilience to geopolitical risks and macro-financial shocks. This will include assessing credit underwriting standards, capitalisation levels and the implementation of the new Capital Requirements Regulation (CRR III) provisions. Particular attention will be given to specific activities and exposures that, while concentrated in a subset of institutions, may have wider prudential implications. These include higher-risk exposures to non-bank financial institutions and significant risk transfer securitisations. Climate and nature-related (C&N) risks will continue to be closely monitored.
Operational resilience will remain another focus area given rapid technological progress and the increasing cyber threats. Attention will be given to banks’ ICT security and third-party risk management frameworks, to the remediation of existing material ICT risk findings, and to addressing the challenges of new technologies.
Supervisors will also engage with banks with regard to their artificial intelligence (AI) and digital strategies, governance and risk controls. Banks will also be asked to strengthen their remediation efforts in terms of risk data aggregation and risk reporting.
Overall, by focusing on the most relevant risks in a proportionate manner, the 2027-29 supervisory priorities will support both the SREP reform agenda and the streamlining of European banking supervision.
2 Developments in scores
The SREP assessment is summarised in an overall SREP score, ranging between 1 (low risk) and 4 (high risk), including the use of qualifiers for scores 2 and 3 (i.e. 2+, 2, 2- and 3+, 3, 3-). In line with the European Banking Authority (EBA) Guidelines on the SREP, this score reflects the overall supervisory assessment of the institution’s viability and sustainability. Higher scores reflect greater supervisory concerns regarding the institution’s viability and sustainability, stemming from one or more features of its risk profile.
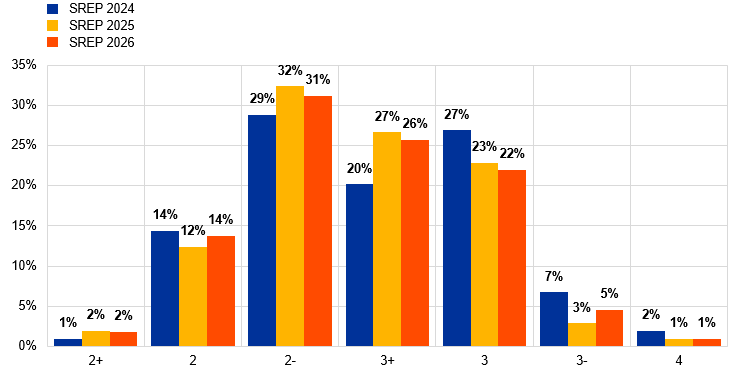
The average overall SREP score remained broadly stable in 2026 compared with that of the 2025 SREP. The distribution of SREP scores changed only marginally (Chart 1), whereas the average overall SREP score remained unchanged at 2.5.
Of the institutions assessed in both the 2025 and 2026 SREPs, 86% of them were given the same overall SREP score, while 7% saw their score worsen and 8% saw it improve (Chart 2). Overall, improvements in SREP scores were largely attributable to upgrades to business model risk and governance risk assessments, rather than to financial risk assessments. Similarly, downgrades were largely driven by non-financial risks, including internal governance and risk management, business model risk, operational risk and ICT risk. Changes in overall SREP scores were mainly triggered by score changes across multiple SREP elements.
Chart 1
(percentages)
Source: ECB SREP database.
Notes: 2024 SREP values based on assessments of 103 banks; 2025 SREP values based on assessments of 105 banks; 2026 SREP values based on assessments of 108 banks. There were no banks with an overall SREP score of 1 in either 2024, 2025 or 2026. Rounding differences may apply to data throughout this document. All data shown throughout this document relate to institutions directly supervised by the ECB.
Chart 2
Changes to banks’ overall SREP scores in 2026 compared with 2025
(percentages)
Source: ECB SREP database.
Note: This chart is based on a sub-sample of banks that were assessed in both the 2025 and 2026 SREP cycles, meaning that the coverage differs slightly from that of the data in Chart 1.
Table 1 illustrates the changes in banks’ overall SREP scores compared with the previous year. While the majority of these scores remained unchanged, the distribution of scores shifted, reflecting changes in the scoring of the underlying risk-specific SREP elements. Similar to the trend in recent years, most adjustments were limited with movements only one notch up or down. The average automated overall SREP score has continued to stand at 2- since 2023, whereas the final overall SREP score has remained at 3+ since 2023 owing to supervisory expert judgement. This expert judgement takes into account factors that are not always fully captured by the indicators underlying the automated scores, ultimately exercising greater caution in the light of the current economic and geopolitical environment.
While annual changes point to a largely stable picture, a five-year comparison shows score changes for over 50% of the institutions assessed, with material changes across these scores.
Table 1
Changes to banks’ overall SREP scores in 2026 compared with 2025
(percentages)
2026 | ||||||||
|---|---|---|---|---|---|---|---|---|
2+ | 2 | 2- | 3+ | 3 | 3- | 4 | ||
2025 | 2+ | 100.0% | 0.0% | 0.0% | 0.0% | 0.0% | 0.0% | 0.0% |
2 | 0.0% | 84.6% | 15.4% | 0.0% | 0.0% | 0.0% | 0.0% | |
2- | 0.0% | 11.8% | 85.3% | 2.9% | 0.0% | 0.0% | 0.0% | |
3+ | 0.0% | 0.0% | 7.4% | 85.2% | 7.4% | 0.0% | 0.0% | |
3 | 0.0% | 0.0% | 0.0% | 4.2% | 87.5% | 8.3% | 0.0% | |
3- | 0.0% | 0.0% | 0.0% | 0.0% | 33.3% | 66.7% | 0.0% | |
4 | 0.0% | 0.0% | 0.0% | 0.0% | 0.0% | 0.0% | 100.0% | |
Source: ECB SREP database.
Note: This table is based on a sub-sample of banks that were assessed in both the 2025 and 2026 SREP cycles, meaning that the coverage differs slightly from that of the data in Chart 1.
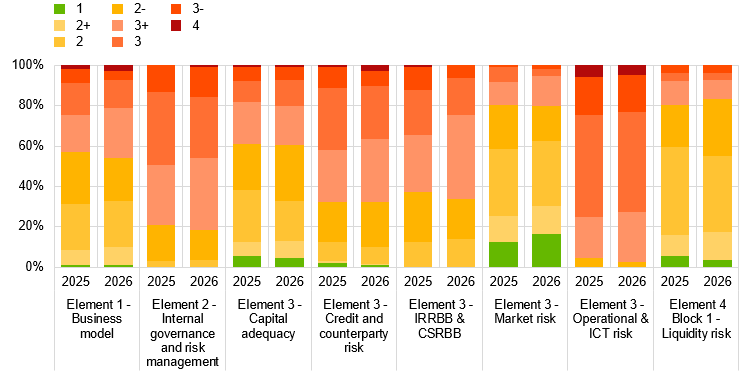
Chart 3 gives the overview of SREP element scores for the entire sample of banks.
Chart 3
Distribution of SREP scores by risk category
Source: ECB SREP database
Notes: 2025 SREP values based on assessments of 105 banks; 2026 SREP values based on assessments of 108 banks.
The average business model score remained almost unchanged compared with 2025. Score upgrades were supported by successfully implemented strategic initiatives, including delivery on financial targets and improved profitability. These were counteracted by score downgrades due to the declining sustainability of net interest income (NII), cost inefficiencies and competition pressures.
Small improvements were observed in internal governance and risk management, with more upgrades than downgrades. Progress was primarily driven by improvements in risk management, compliance, and internal audit functions. However, most banks continue to be assessed as weak (score 3).
With regard to capital adequacy, scores remained broadly stable, albeit with several changes in the score distribution compared with 2025. In some cases, supervisors made institution-specific comments regarding dividend policies, stress testing, and the internal capital adequacy assessment process (ICAAP).
Credit risk scores remained stable, with score upgrades and downgrades evenly distributed and the non-performing loan (NPL) ratio standing at historical lows. There were some improvements in key risk indicators and loan origination and monitoring practices, but deficiencies persisted in risk control frameworks.
Following a three-year deterioration, the scores for the combined interest rate risk in the banking book (IRRBB) and credit spread risk in the banking book (CSRBB) improved in the 2026 SREP. Contributing factors included the remediation of past on-site findings and a more stable monetary policy environment, which reduced the uncertainty surrounding the interest rate risk while supporting NII.
The average combined score for market risk was also better, continuing the positive trend since 2024. Improvements were driven by reduced trading book and market risk exposures, effective de-risking strategies and enhancements to risk control frameworks, together with stable market conditions in the second half of 2025.
Operational risk and ICT risk scores remained largely stable, with most institutions being assessed as medium-high risk. This risk level was triggered by rising operational losses, cyberattacks and third-party risks. Risk controls improved, albeit deficiencies and ICT vulnerabilities persisted, particularly in relation to the implementation of the Digital Operational Resilience Act (DORA).
Lastly, liquidity scores saw minimal changes, reflecting broadly stable liquidity/funding positions, and only a small number of banks had worse scores than in 2025.
2.1 Breakdown by business model
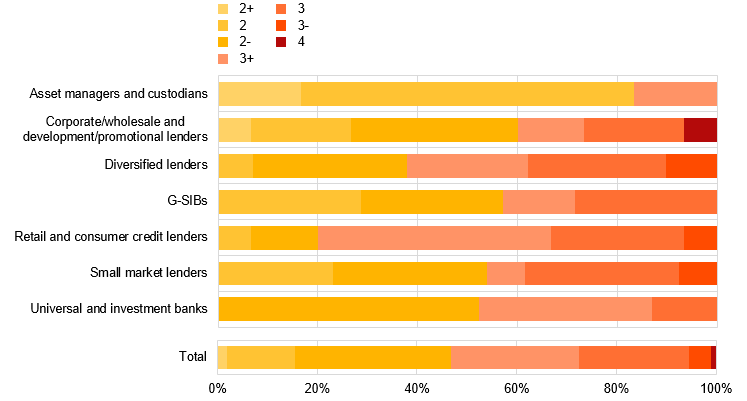
Chart 4 shows the distribution of overall SREP scores across various business models.
Chart 4
Breakdown of overall SREP scores by business model
(percentages)
Source: ECB SREP database.
Notes: 2026 SREP values based on assessments of 108 banks. Corporate/wholesale lenders and development/promotional lenders have been grouped together in this chart to preserve statistical confidentiality.
Asset managers and custodians showed improvements, keeping their average risk level at medium-low (score 2). The scores for diversified lenders were also more positive, although most still fall in the medium to medium-high range (scores between 3+ and 3-). These developments were driven by strong capital and liquidity profiles, alongside robust profitability.
Corporate/wholesale lenders and development/promotional lenders continued to fall into the medium-low average risk level category, with most scores ranging between a 2+ to a 2-. A few banks had weaker scores of 3- and 4, mainly due to vulnerabilities in the areas of governance, business model and credit risk.
By contrast, global systemically important banks (G-SIBs) and retail consumer credit lenders were downgraded compared with the previous year. G-SIBs continued to have low-medium scores overall. Retail consumer credit lenders remained at medium-high risk owing to weaknesses in governance effectiveness, risk data aggregation, and ICT and operational resilience.
3 Capital requirements and guidance
Based on the outcome of the 2026 SREP, the overall capital requirements and guidance applicable for 2027 remained almost the same as last year, with 15.7% of RWA being applicable instead of 15.6% in 2026 (Chart 5). The weighted average total capital Pillar 2 requirement (P2R) remained broadly stable. The total capital ratio[1] stood at a weighted average of 20.1% as at the second quarter of 2026. The P2R captures bank-specific risks,[2] whereas macroprudential buffers[3] address systemic risks by being built up in good times and used in bad times.
Chart 5
Developments in overall weighted capital requirements and Pillar 2 guidance – the total capital stack
(percentages of RWA)
Sources: ECB supervisory banking statistics and ECB SREP database.
Notes: The sample selection follows the approach of the methodological note for the supervisory banking statistics. For 2018, the first quarter sample is based on 109 entities; for 2019, 114 entities; for 2020, 112 entities; for 2021, 114 entities; for 2022, 112 entities; for 2023, 111 entities; for 2024, 110 entities; for 2025, 113 entities; for 2026, 109 entities. For 2027, the first quarter sample is based on 109 entities, with the P2R being applicable from January 2027. Entities that are to become significant institutions in the first quarter of 2027 are not included in this sample, as the decision on their level of significance is pending. The chart shows RWA-weighted data. “Overall capital requirements”: Pillar 1 minimum requirement + Pillar 2 requirement + combined buffer requirements (i.e. the capital conservation buffer + systemic buffers (G-SII, O-SII, SRB) + CCyB). Rounding differences may apply. The reference period for the combined buffer requirement is the first quarter of each year. For the first quarter of 2027, buffers are estimated based on announced rates applicable at this date. Estimated values are shown in a fainter purple or green colour and are marked with an asterisk. The P2G is added on top of the overall capital requirements. Under CRD V, which came into effect on 1 January 2021, the P2R capital should have the same composition as Pillar 1 – i.e. at least 56.25% should fall under CET1 capital and at least 75% should fall under Tier 1 capital, in line with the minimum requirements. By way of derogation from the first sub-paragraph of Paragraph 4, Article 104a of CRD V, the competent authority may require the institution to meet its additional own funds requirements with a higher portion of Tier 1 capital or CET1 capital, where necessary, and having regard to the specific circumstances of the institution.
Chart 6
(percentages, annual average)
Source: ECB supervisory banking statistics.
Notes: The sample selection follows the approach of the methodological note for the supervisory banking statistics. Weighted averages are shown.
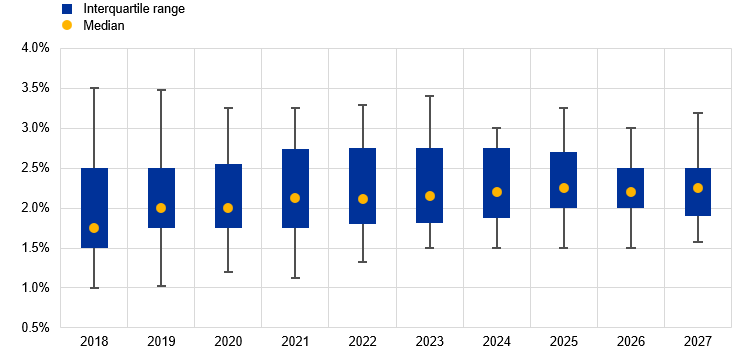
In terms of the P2R distribution, the median total capital P2R remained largely stable at around 2.2%, whereas the interquartile range expanded slightly by comparison with the previous year. The P2R distribution became less concentrated around the median, as a result of the application of the new P2R methodology introduced in the 2026 SREP (Chart 7).
Chart 7
Distribution of total capital Pillar 2 requirements
(percentages of RWA)
Sources: ECB supervisory banking statistics and ECB SREP database.
Notes: The sample selection follows the approach of the methodological note for the supervisory banking statistics. For 2018, the first quarter sample is based on 109 entities; for 2019, 114 entities; for 2020, 112 entities; for 2021, 114 entities; for 2022, 112 entities; for 2023, 111 entities; for 2024, 110 entities; for 2025, 113 entities; for 2026, 109 entities. For 2027, the first quarter sample is based on 109 entities, with the P2R being applicable from January 2027. Entities that are to become significant institutions in the first quarter of 2027 are not included in this sample, as the decision on their level of significance is pending. The chart shows the P2R according to the year of applicability (i.e. 2027 data include the P2R agreed upon in the 2026 SREP cycle and applicable in 2027). The whiskers display the 5th and 95th percentiles and the median is displayed as a mark in the box. The box indicates the interquartile range and ranges from the first to the third quartile of the distribution.
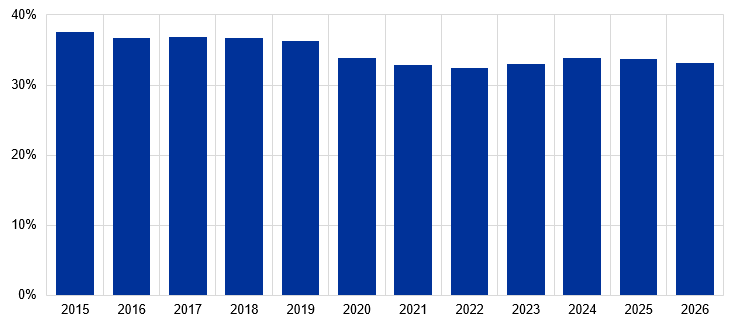
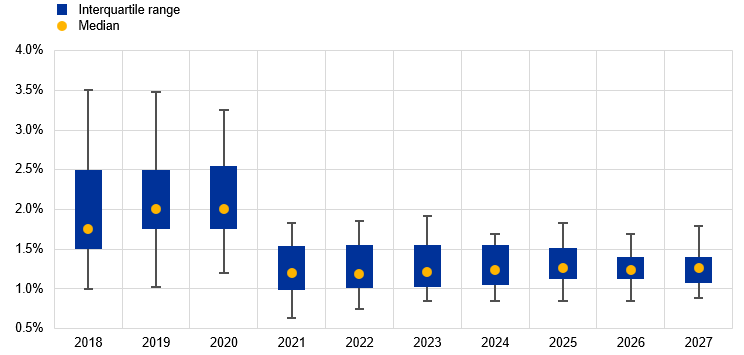
The P2R, in terms of Common Equity Tier 1 (CET1) and total capital, remained broadly stable as compared with 2026 (Chart 9). The related interquartile range for 2027 increased slightly compared with recent years, ranging between 1.1% and 1.4% for the CET1 P2R (Chart 8), in line with developments in the interquartile range for the total capital P2R. The weighted average RWA density as at the second quarter of 2026 stood at 33.1%, slightly lower than at the start of European banking supervision (Chart 6).
Chart 8
Distribution of CET1 Pillar 2 requirements
(percentages of RWA)
Sources: ECB supervisory banking statistics and ECB SREP database.
Notes: The sample selection follows the approach of the methodological note for the supervisory banking statistics. For 2018, the first quarter sample is based on 109 entities; for 2019, 114 entities; for 2020, 112 entities; for 2021, 114 entities; for 2022, 112 entities; for 2023, 111 entities; for 2024, 110 entities; for 2025, 113 entities and for 2026, 109 entities. For 2027, the first quarter sample is based on 109 entities, with the P2R being applicable from January 2027. Entities that are to become significant institutions in the first quarter of 2027 are not included in this sample, as the decision on their level of significance is pending. The chart shows the P2R requirements to be met in terms of CET1 capital according to the year of applicability (i.e. 2027 data include the P2R agreed upon in the 2026 SREP cycle and applicable in 2027). The whiskers display the 5th and 95th percentiles and the median is displayed as a mark in the box. The box indicates the interquartile range and ranges from the first to the third quartile of the distribution. The composition of Pillar 2 requirements was amended by Directive (EU) 2019/878 (Capital Requirements Directive V (CRD V), which came into effect on 1 January 2021. Under CRD V, the Pillar 2 capital requirement should have the same composition as the Pillar 1 capital requirement, i.e. at least 56.25% of CET1 and at least 75% of Tier 1 capital as a minimum requirement, leading to the aggregate reduction in CET1 capital from 1.8% to 1.0%. By way of derogation from the first sub-paragraph of the CRD V, the competent authority may require the institution to meet its additional own funds requirement with a higher portion of Tier 1 capital, or Common Equity Tier 1 capital, where necessary, taking into account the specific circumstances of the institution.
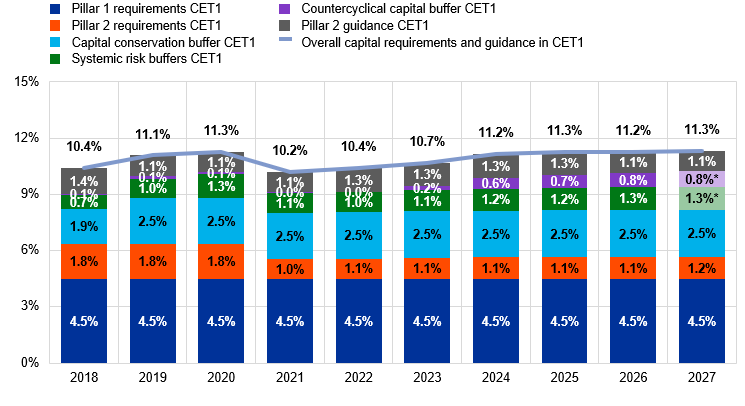
Chart 9 shows the overall capital requirements and guidance to be met using CET1 capital. The overall level of CET1 capital requirements of 11.3% applicable for 2027 remained broadly stable. Capital requirements and Pillar 2 guidance (P2G) are therefore almost back in line with pre-pandemic levels. During the pandemic, primarily in 2021 and 2022, micro- and macroprudential requirements (i.e. structural and cyclical buffers) were lowered or suspended as part of the temporary capital and operational relief package established in response to the spread of COVID-19 and to help euro area banks support the economy during this period. Subsequently, the national competent authorities gradually reintroduced or increased structural and cyclical buffer requirements again.
Chart 9
Developments in overall capital requirements and Pillar 2 guidance in CET1
(percentages of RWA)
Sources: ECB supervisory banking statistics and ECB SREP database.
Notes: The sample selection follows the approach of the methodological note for the supervisory banking statistics. For 2018, the first quarter sample is based on 109 entities; for 2019, 114 entities; for 2020, 112 entities; for 2021, 114 entities; for 2022, 112 entities; for 2023, 111 entities; for 2024, 110 entities; for 2025, 113 entities, and for 2026, 109 entities. For 2027, the sample is based on 109 entities, with the P2R being applicable from January 2027. Entities that are to become significant institutions in the first quarter of 2027 are not included in this sample, as the decision on their level of significance is pending. The chart shows RWA-weighted data. “Overall capital requirements”: Pillar 1 minimum requirement + Pillar 2 requirement + combined buffer requirements (i.e. the capital conservation buffer + systemic buffers (G-SII, O-SII, SRB) + CCyB). Rounding differences may apply. The reference period for the combined buffer requirement is the first quarter of each year. For the first quarter of 2027, buffers are estimated based on announced rates applicable at this date. Estimated values are shown in a fainter green or purple colour and are marked with an asterisk. The P2G is added on top of the overall capital requirements. Under CRD V, which came into effect on 1 January 2021, the P2R capital should have the same composition as under Pillar 1 – i.e. at least 56.25% should fall under CET1 capital and at least 75% should fall under Tier 1 capital, in line with the minimum requirements. By way of derogation from the first sub-paragraph of Paragraph 4, Article 104a of CRD V, the competent authority may require the institution to meet its additional own funds requirements with a higher portion of Tier 1 capital or CET1 capital, where necessary, and having regard to the specific circumstances of the institution.
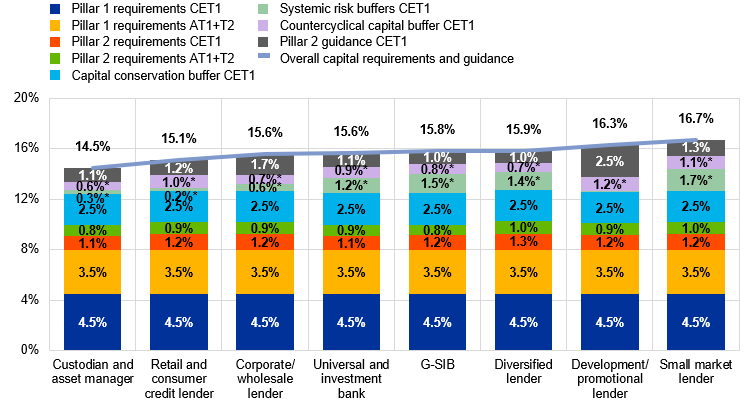
Chart 10 shows the breakdown of overall capital requirements and guidance for each business model, as applicable in 2027. Overall capital requirements and guidance are highest for small market lenders and development/promotional lenders. In terms of the P2R, requirements are set at a comparatively higher level for diversified lenders.
Chart 10
Overall capital requirements and guidance by business model
(percentages of RWA)
Sources: ECB supervisory banking statistics and ECB SREP database.
Notes: The sample is based on 109 entities, with the P2R being applicable in January 2027. Entities that are to become significant institutions in the first quarter of 2027 are not included in this sample, as the decision on their level of significance is pending. The chart shows RWA-weighted data from the first quarter of 2026. “Overall capital requirements”: Pillar 1 minimum requirement + Pillar 2 requirement + combined buffer requirements (i.e. the capital conservation buffer + systemic buffers (G-SII, O-SII, SRB) + CCyB). Rounding differences may apply. Buffers are estimated based on announced rates applicable at this date. Estimated values are shown in a fainter green or purple colour and are marked with an asterisk. The P2G is added on top of the overall capital requirements. Under CRD V, which came into effect on 1 January 2021, P2R capital should have the same composition as under Pillar 1 – i.e. at least 56.25% should fall under CET1 capital and at least 75% should fall under Tier 1 capital, in line with the minimum requirements. By way of derogation from the first sub-paragraph of Paragraph 4, Article 104a of CRD V, the competent authority may require the institution to meet its additional own funds requirements with a higher portion of Tier 1 capital or CET1 capital, where necessary, and having regard to the specific circumstances of the institution.
3.1 Pillar 2 methodology
The ECB has recently revised its Pillar 2 methodology as part of its SREP reform. It has now used this methodology to determine the new Pillar 2 requirements that will come into effect on 1 January 2027. This revised P2R methodology has been simplified and makes a more direct link between the Pillar 2 requirements and the individual Pillar 2 risk drivers, taking into account the recommendations given in 2023 by an independent expert group.
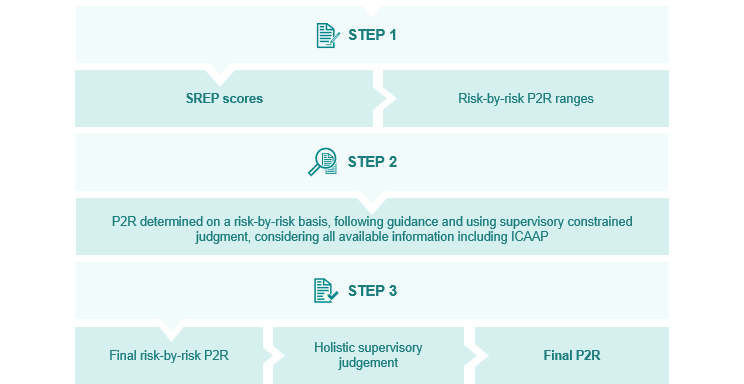
Since the revised Pillar 2 methodology is closely linked to the SREP assessments, which constitute the ECB’s supervisory view of each bank’s risk profile, it has not resulted in changes to the overall capital requirements at the system level. That said, in line with its more individual risk-based approach, there have been some changes to individual P2Rs which led to a minor increase in the distribution of the P2R (Chart 7). The P2R has therefore changed for 61% of the supervised entities. For more than half of those banks, the P2R has decreased, on average, by around 20 basis points, whereas for the rest of these banks, the P2R has increased by almost 20 basis points, on average. These changes are either attributable to developments in individual bank risk profiles and/or to the revised assessment of risk drivers under the new Pillar 2 methodology.
While comprehensive risk coverage is a key aspect of the new P2R methodology, it is also important to avoid the double counting of risks. In that respect, the revised P2R methodology equips supervisors with an enhanced toolkit for identifying potential overlaps between the Pillar 1 minimum requirements and the Pillar 2 requirements so that no risks are double counted when they set the individual P2Rs.
In this SREP cycle, it was very important to address any potential overlaps of risks and to avoid double counting since the EU was in the process of implementing the final Basel III reforms, which influence the calculation of RWAs.[4] The new regulations under the CRR III for calculating the risk weights that also affect operational and credit risk weights could have a knock-on effect on the Pillar 2 requirements. This means that in certain cases, the risks that were previously addressed by the P2R may already be covered by the Pillar 1 requirements.[5] Therefore, supervisors assessed such risks on a case-by-case basis in order to identify any such overlaps and to address them accordingly.
Such case-by-case assessments began when the phased-in effects of CRR III were introduced. These effects have generally been minor but rather different across banks.
More specifically, the phasing-in of CRR III has so far led to noticeable increases in Pillar 1 requirements for around one-third of the entities supervised by the ECB.[6] At the same time, around 60% of the supervised entities had their Pillar 1 requirements reduced, offsetting other increases. This resulted in relatively stable or sometimes even much lower Pillar 1 requirements at the bank-specific level.
However, an increase in Pillar 1 requirements does not automatically mean that certain risks which had until now been covered by the P2R are now automatically covered by the Pillar 1 minimum requirements. For the one-third of supervised entities that were subject to an increase in Pillar 1 requirements owing to the new CRR III regulations, supervisors comprehensively assessed the drivers behind these Pillar 1 requirement increases, making sure that there would be no potential overlaps with the P2Rs.
Where there were potential overlaps, the respective adjustments to the P2R led to decreases of up to around 0.5 percentage point or smaller. This compensated for the P2R increase that other risk drivers might have caused, for example because the risk profile of the institution in question had deteriorated.
The CRR III will gradually be phased in over the course of the next few years. Therefore, the ECB will continue to monitor the phase-in effects and will tackle any Pillar 1 and Pillar 2 overlaps on a case-by-case using the new P2R methodology.[7]
In addition, ECB Banking Supervision has closely monitored leveraged transactions and the progress made to remediate related deficiencies. Prudent management of leveraged loans is very important, as highly leveraged corporates are particularly vulnerable to market volatility, economic cycles and fluctuations in revenue. The SREP methodology addresses the concentration of exposures to highly leveraged transactions and stipulates that leveraged finance exposures be captured in banks’ risk appetite frameworks. Any related capital requirements are therefore incorporated into the bank-specific P2R for credit risk.
3.2 Leverage-based own funds requirements
Leverage-based own funds requirements act as a backstop to prevent excessive borrowing and to address excess leverage-related risks, such as those stemming from derivatives and off-balance sheet items.
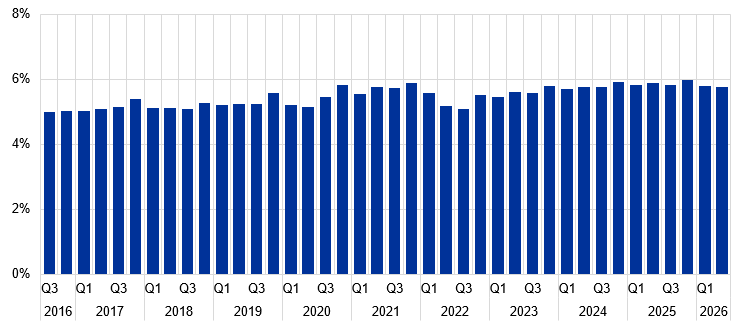
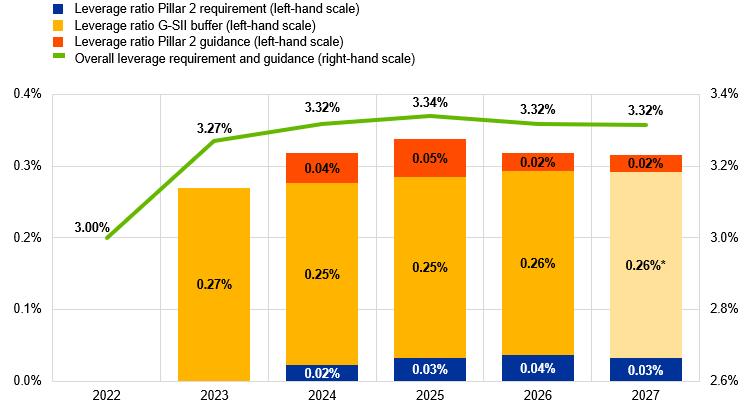
In the 2026 SREP cycle, a P2R leverage ratio add-on (in the range of 10 to 25 basis points) was assigned in 14 cases to address excessive leverage risks not covered by the Pillar 1 requirements. In line with the aforementioned backstop nature of the leverage-based capital stack, the P2R leverage ratio add-ons had a limited impact because, for most banks, the total leverage-based own funds requirements in nominal terms are lower (and consequently less binding) than the risk-based ones. Moreover, five banks were subject to a P2G leverage ratio add-on. Overall, the risk of excessive leverage is considered to be low. The weighted average of the fully phased-in[8] leverage ratio as at the second quarter of 2026 stood at 5.8% (Chart 11) as compared with the overall leverage requirements and guidance that have been set at around 3.3% for 2027 (Chart 12).
Chart 11
Fully phased-in weighted leverage ratio
(percentage)
Sources: ECB supervisory banking statistics and internal calculations. Link to ECB Data Portal series on fully phased-in leverage ratio.
Note: The sample selection follows the approach of the methodological note for the supervisory banking statistics.
Chart 12
Overall weighted leverage requirements and guidance
(percentages of total exposure)
Sources: ECB supervisory banking statistics and ECB SREP database.
Notes: The sample consists of entities with an applicable leverage ratio P2R and/or P2G. For 14 banks, a P2R leverage ratio add-on was applied. Weighted averages are shown. Rounding differences may apply. Estimated values are shown in a fainter yellow colour and are marked with an asterisk. The minimum Pillar 1 requirements of 3% are not shown in this chart to aid graphic visualisation.
3.3 Non-performing exposure Pillar 2 requirement add-on
If a bank’s risk provisioning for NPEs[9] is assessed as inadequate, the resulting shortfall is addressed by a specific P2R add-on.
The relevant institutions are encouraged to close their provisioning gaps by posting the maximum level of provisions permitted under the respectively applicable accounting standards. Where the accounting treatment does not fall in line with or meet the ECB’s supervisory expectations, institutions have the further option of adjusting their CET1 capital on their own initiative.
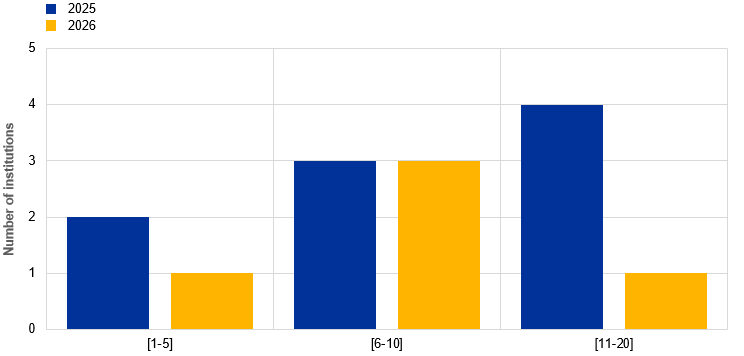
The 2026 SREP cycle resulted in NPE P2R add-ons being issued for five banks. The RWA-weighted average shortfall in NPE provisions amounted to 10 basis points in 2026, down from 12 basis points in 2025. The bank-specific NPE P2R add-ons ranged from 5 to 12 basis points (Chart 13).
For certain institutions with persistent and significant coverage shortfalls stemming from older NPEs, the relevant P2R add-on was imposed fully in the form of CET1 capital.
Chart 13
Non-performing exposure shortfall add-ons
(total, basis points)
Source: ECB internal calculations.
Notes: 2025 SREP values are based on assessments of 105 banks and 2026 SREP values are based on assessments of 108 banks. Only institutions with a non-zero add-on are displayed.
4 Qualitative measures
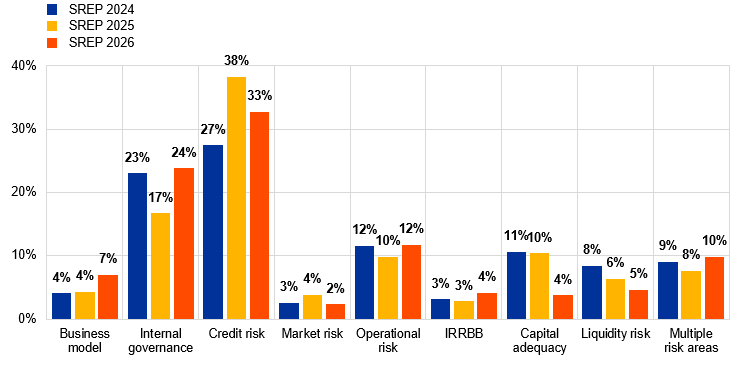
Qualitative measures to address supervisory findings were issued for 78 banks in the form of SREP decisions or SREP operational letters. Most of these measures focused on credit risk (33%), followed by internal governance (24%), and operational risk (12%), as shown in Chart 14.
Credit risk remained the most frequently addressed area of deficiency, reflecting continued supervisory scrutiny. A significant share of these measures targeted NPL management and credit monitoring practices. Internal governance measures increased, pointing to continued supervisory concerns regarding management body effectiveness, risk data aggregation and risk management. Operational risk measures also rose, reflecting continued supervisory focus on ICT risk and operational resilience.
Chart 14
Developments in share of qualitative measures by risk category
(percentages)
Source: ECB SREP database.
Notes: 2024 SREP values are based on assessments of 103 banks; 2025 SREP values are based on assessments of 105 banks; 2026 SREP values are based on assessments of 108 banks. This chart does not include weaknesses addressed by supervisory measures taken outside of the SREP cycles. Rounding differences may apply.
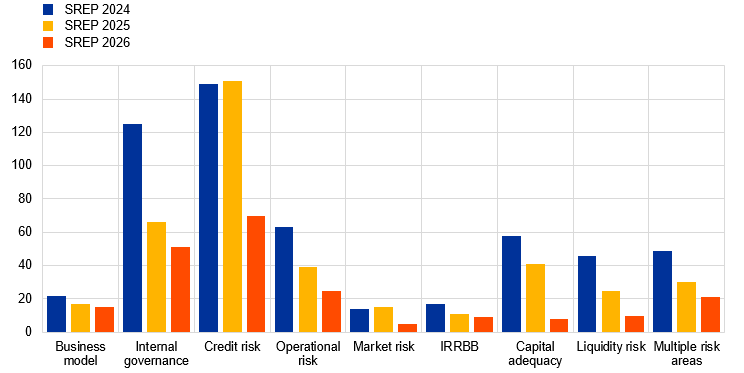
Compared with the previous year, the total number of new qualitative measures fell by roughly 50%, with the most notable declines observed in the areas of credit risk and capital adequacy (Chart 15). This was in line with the reduction in the total number of supervisory measures issued during the year, including those stemming from on-site inspections, internal model investigations and other supervisory activities. The decline was also consistent with ECB Banking Supervision’s SREP reform, the purpose of which was to focus on the key supervisory concerns and material weaknesses in the form of SREP decisions and letters. This tiered approach, introduced in July 2025, further streamlined the follow-up of supervisory findings and measures. It simplified the process for less severe findings, while sustaining its routine and careful monitoring for severe findings.
Chart 15
Developments in number of qualitative measures by risk category
Source: ECB SREP database.
Notes: 2024 SREP values are based on assessments of 103 banks; 2025 SREP values are based on assessments of 105 banks; 2026 SREP values are based on assessments of 108 banks. This chart does not include weaknesses addressed by supervisory measures taken outside of the SREP cycles.
4.1 Distribution of qualitative measures
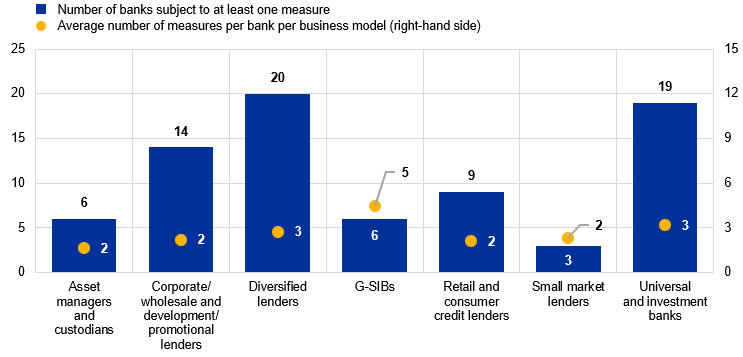
Chart 16 shows the average number of qualitative measures by business model, alongside the number of banks subject to at least one qualitative measure during the 2026 SREP cycle. G-SIBs had the highest average, at close to five measures per bank. Diversified lenders and universal and investment banks followed closely, with an average of three measures per bank, with the remaining business model categories averaging two measures per bank. These results reflect differences in the size and complexity of the various institutions within each business model.
Chart 16
Average number of qualitative measures by business model
(percentages)
Source: ECB SREP database.
Notes: 2026 SREP values are based on assessments of 108 banks. This chart does not include weaknesses addressed by supervisory measures taken outside of the 2026 SREP cycle. Corporate/wholesale lenders and development/promotional lenders have been grouped together in this chart to preserve statistical confidentiality.
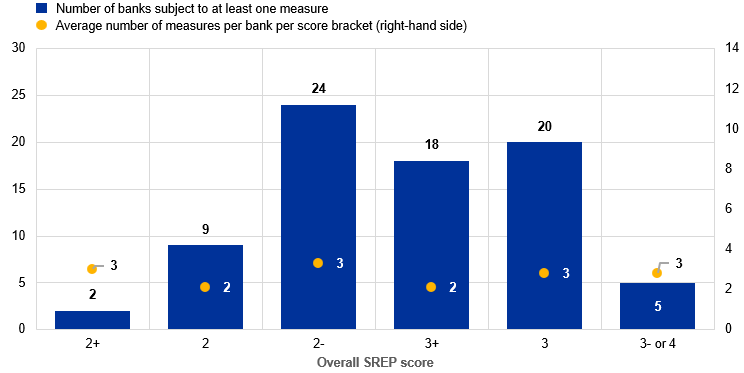
The average number of measures by overall SREP score (Chart 17) shows that the number of new qualitative measures does not necessarily rise in parallel with weaker overall SREP scores. The average number of measures should be interpreted in the context of the broader supervisory engagement, as institutions with weaker overall SREP scores are often already subject to ongoing qualitative measures and more intensive follow-up through other supervisory activities.
Further information on qualitative measures by risk element is provided in Chapter 5.
Chart 17
Average number of qualitative measures by overall SREP score
(totals)
Source: ECB SREP database.
Notes: 2026 SREP values are based on assessments of 108 banks. There are no banks with an overall SREP score of 1. This chart does not include weaknesses addressed by supervisory measures taken outside of the 2026 SREP cycle.
5 Detailed analysis
5.1 Element 1 - Business model
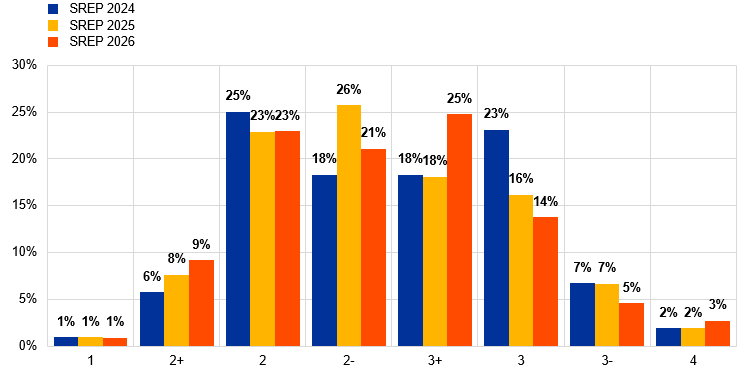
In the 2026 SREP cycle, the average business model score remained stable at 2.4 compared with the previous cycle. 16% of scores improved, but 10% of scores were downgraded, which was more than double compared with the previous year (Chart 18).
In 2025, in the setting of a lower interest rate environment, albeit with heightened macroeconomic and geopolitical risks, profitability across the banking sector remained strong, with a stable return on equity and return on assets, at 9.5% and 0.7% in aggregate terms, respectively. Despite NII decreasing by 1.3% year on year, operating income rose by 2.2%, driven by net fee and commission income. Operating expenses rose by 2.3% in 2025, leading to a cost-to-income ratio of around 55%.
Score improvements were driven by sustained profitability, enhanced cost efficiency, the remediation of qualitative deficiencies, advancements in digital transformation, and successfully executed strategic initiatives. Score deteriorations stemmed from structural sensitivities to interest rates (e.g. reliance on variable rate portfolios, loan margin compression, concentration in interest income revenue) and rising cost bases. Supervisory measures focused primarily on deficiencies in business strategy, projections and forecasting capabilities, as well as on cost management.
In 2026, the impact of digitalisation on business models remained the key focus and ECB Banking Supervision organised several workshops with 11 banks on emerging generative AI use cases, gaining insight into their impact on business, internal governance, risk management, and operational resilience. Those banks that took part were selected on the basis of their advanced use of generative AI to transform their business strategy and internal governance. These findings will be used as input for bank-specific feedback and the ECB’s supervisory approach to new technologies.
Chart 18
Element 1: Business model SREP scores
(percentages)
Source: ECB SREP database.
Note: 2024 SREP values are based on assessments of 103 banks; 2025 SREP values are based on assessments of 105 banks; 2026 SREP values are based on assessments of 108 banks.
5.1.1 Breakdown of SREP scores by business model
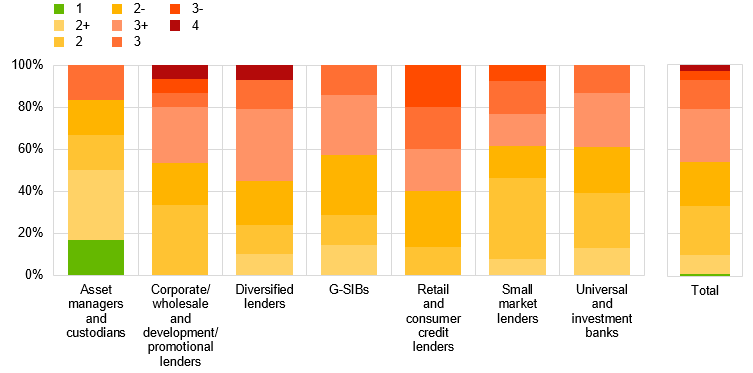
Chart 19
Breakdown of business model SREP scores by business model
(percentages)
Source: ECB SREP database.
Notes: 2026 SREP values are based on assessments of 108 banks. Corporate/wholesale lenders and development/promotional lenders, and universal banks and investment banks have been grouped together in this chart to preserve statistical confidentiality.
The key observations specific to the individual peer groups in the 2026 SREP cycle are as follows:
- Global systemically important banks: their scores remained stable. Operating income increased thanks to growth in NII (mainly from assets held for trading) and net fee and commission income. Challenges across the peer group included low net interest margins in retail networks, high-cost base and execution risks related to strategic initiatives.
- Universal banks and investment banks: score improvements were driven by sustained profitability, enhanced execution capabilities and improvements in strategic steering. At peer group level, growth in net fee and commission income and net trading and investment income offset the decline in NII.
- Diversified lenders: score improvements were supported by sustained profitability, efficient cost management and revenue diversification in fee-generating business. Score downgrades were linked to weaker income generation capacity and higher cost levels.
- Corporate/wholesale lenders and promotional/development lenders: scores deteriorated for this group of lenders owing to reduced profitability as a result of lower NII and interest margins, rising costs, limited revenue diversification and sectoral concentration.
- Retail and consumer credit lenders: scores remained broadly stable with a few downgrades owing to weaker performance and slow progress in implementing strategic initiatives. Net operating income significantly increased on the back of NII and net fee and commission income, while operating expenses grew at a slower pace.
- Small market lenders: despite some deterioration in their scores, this group continued to be the best performer in terms of both profitability and cost efficiency. Its NII, however, dropped significantly as a result of variable rate portfolios, but its net fee and commission income and operating costs remained broadly stable.
- Asset managers and custodians: this group still had one of the best-scoring business models. Their success was driven by strong profitability, supported by steady fee-based income, high client retention and asset volumes, as well as operational efficiency.
5.1.2 Profitability
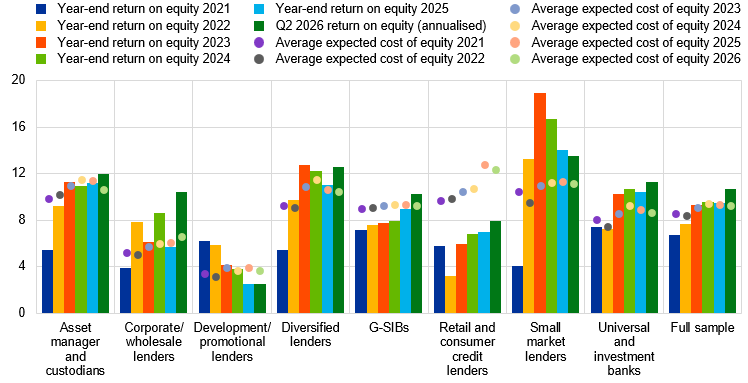
In 2025, the aggregate profitability of supervised entities remained relatively high, with their return on equity standing at 9.5%, despite a slowdown in revenue growth resulting from a lower contribution from NII in the income mix. In the second quarter of 2026, aggregate profitability increased, with the return on equity reaching almost 11% (Chart 20). With some exceptions, banks earned their cost of equity on aggregate. NII remained under pressure in 2025, declining by 1.3% compared with 2024. In the first half of 2025, margin compression more than offset modest volume growth. NII began to recover from the fourth quarter of 2025 and continued to strengthen through the first half of 2026, supported by higher loan volumes and improving interest margins. Loan pricing reflected two contrasting dynamics: rates on floating rate loans fell steadily following the ECB’s rate cuts in 2024, whereas rates on fixed rate loans continued to rise. Recent movements in key policy rates may support a more favourable outlook[10].
Net fee and commission income was the primary driver of revenue growth following the rate cuts in 2024 and 2025. Year on year, this income grew by 4.1% in 2025, with increases observed across all business models. The main contributors to this growth included asset management, custodian, and corporate finance activities. This positive momentum carried into the second quarter of 2026, supported by rising retail growth and favourable market conditions, further consolidating net fee and commission income as a key source of revenue.
Year-on-year net trading and investment income declined in 2025 by 8.8%. In March 2026, market responses to the economic and geopolitical developments fuelled this income on the back of heightened trading activity and wider bid/ask spreads.
Chart 20
Return on equity and cost of equity by business model
(percentages)
Sources: ECB supervisory banking statistics and internal calculations. Link to ECB Data Portal series on return on equity.
Notes: Weighted average. The sample selection follows the approach of the methodological note for the supervisory banking statistics. Cost of equity as self-reported by the institutions. Owing to data availability constraints, the sample for the cost of equity comprises a lower number of entities than the sample for the return on equity. The average expected cost of equity in 2026 is based on 98 entities. ECB estimates (based on established methodologies) indicate a cost of equity which is higher than the self-reported cost of equity.
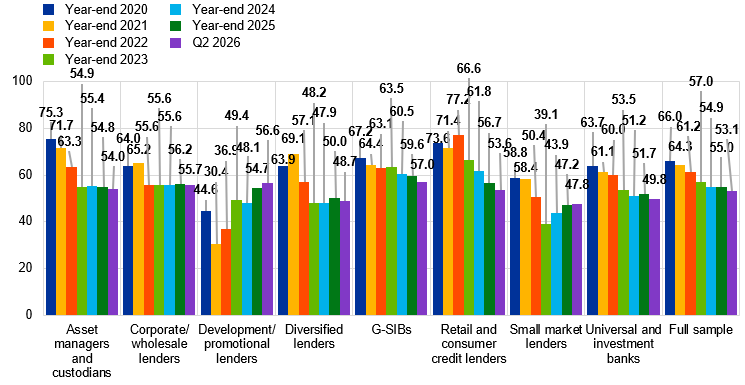
Chart 21
Cost-to-income ratio by business model
(percentages)
Sources: ECB supervisory banking statistics and internal calculations. Link to ECB Data Portal series on the cost-to-income ratio.
Notes: Weighted average. The sample selection follows the approach of the methodological note for the supervisory banking statistics.
The increase in total operating income in 2025 (+2.2% year on year) was offset by a comparable rise in operating expenses (+2.3%), resulting in a slight increase in the cost-to-income ratio, from 54.9% to 55.0%. The rise in operating expenses was primarily driven by higher staff expenses (+3.4%), mirroring inflation developments and the growing number of specialised IT staff required to support ongoing digitalisation efforts. The overall impact continued to be limited, as reflected in the cost-to-assets ratio, which remained stable at 1.3% in 2025.
In the first half of 2026, operating expenses grew as against the same period in 2025 owing to pressure from wages, IT and strategic investments. However, strong revenue performance contributed to improving efficiency, as reflected in the decline in the aggregate cost-to-income ratio to 53.1% as at the second quarter of 2026 (Chart 21). Business models with diversified income streams, especially those benefiting from non-interest income, contributed significantly to this gain in efficiency.
5.1.3 Qualitative measures
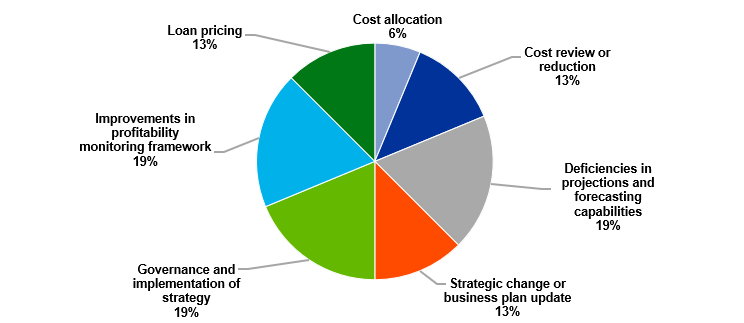
In this SREP cycle, supervisors focused on the robustness of business strategies amid a volatile geopolitical and macroeconomic environment. Qualitative measures (Chart 22) targeted deficiencies in internal governance and the implementation of business strategies (19%), projections and forecasting capabilities (19%), as well as profitability monitoring (19%). The remaining measures addressed loan pricing (13%), strategic changes or business plan updates (13%), as well as costs-related deficiencies (13%).
Qualitative measures on business strategy were designed to support the rollout of strategic plans, enhancing business strategy-setting frameworks and adapting them to changes in the business environment. Measures related to projections and forecasting capabilities required banks to improve their financial projection frameworks, incorporate sensitivity analyses and develop alternative scenarios that reflected the changing outlook amid the growing geopolitical uncertainties.
Chart 22
Detailed breakdown of business model-related measures
(percentages)
Source: ECB SREP database.
Notes: 2026 SREP values are based on assessments of 108 banks. This chart does not include weaknesses addressed by supervisory measures taken outside of the 2026 SREP cycle.
5.2 Element 2 - Internal governance and risk management
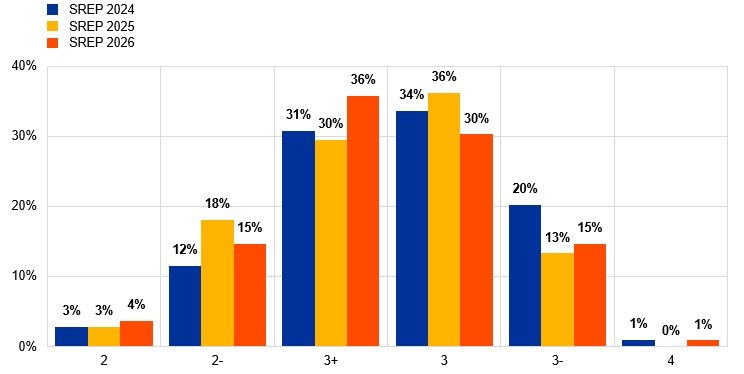
In the 2026 SREP cycle, the average internal governance and risk management score continued to be stable at 2.8 compared with the previous cycle. Slight progress was made, with 17% of scores being upgraded and 15% being downgraded, and the majority of banks scoring in the range of score 3 (80%), with a slight shift from score 3 to score 3+ (Chart 23). Uncertainty remained elevated, mainly due to geopolitical tensions, shifting trade policies, other potential disruptions and the quickening pace of technological innovation, which showed that further improvements were needed. Strong internal governance arrangements and risk management frameworks are a prerequisite for building resilience and preventing the accumulation of unchecked risks, as illustrated in the outcome of the 2026 ECB reverse stress test on geopolitical risk.
Scores were largely driven by risk data aggregation and risk reporting weaknesses. ECB Banking Supervision intensified its supervisory focus on these weaknesses and on monitoring banks’ progress following the publication of ECB Guide on effective risk data aggregation and risk reporting, currently under revision. Although multi-year remediation programmes are increasingly being used and management body engagement has improved, key issues persisted, including inadequate IT and data architectures, weak data lineage and data quality controls, continued reliance on manual processes and recurring supervisory reporting issues. As a result, while momentum and commitment were positive, most institutions still needed to fully comply with Basel Committee on Banking Supervision (BCBS) 239 expectations.
Another area of supervisory focus was risk appetite frameworks. A horizontal benchmarking exercise was conducted in 2026. 19 significant institutions were assessed in this exercise using a risk-based approach. This exercise complemented the first part of the analysis of 28 significant institutions’ risk appetite frameworks in 2025, which also fed into the 2026 SREP aggregated results. While some progress was made, there are some key areas that still require following up, namely, internal governance processes, consistency between risk identification and risk appetite, adequate coverage of some non-financial and emerging risks, the calibration of limits, as well as consistency between banks’ strategic decision-making, their remuneration frameworks and their risk appetite frameworks.
ECB Banking Supervision will follow up on these issues as part of its supervisory dialogue or, where necessary, in the form of targeted action in response to severe findings.
Chart 23
Element 2: Internal governance SREP scores
(percentages)
Source: ECB SREP database.
Notes: 2024 SREP values are based on assessments of 103 banks; 2025 SREP values are based on assessments of 105 banks; 2026 SREP values are based on assessments of 108 banks. There are no banks with an internal governance score of 1 or 2+. Rounding differences may apply.
5.2.1 Breakdown of SREP scores by business model
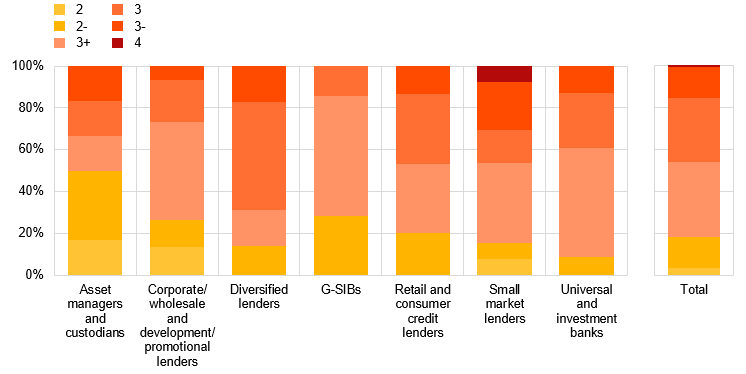
Chart 24 shows the breakdown of SREP scores by business model type. Internal governance scores across most business models remained stable in 2026 compared with the previous year, yet there are differences across business models. Small market lenders made the most visible progress thanks to improvements in risk management, compliance and internal audit functions. G-SIBs and retail and consumer credit lenders also made positive progress.
The average score for universal and investment banks and corporate/wholesale and development/promotional lenders worsened overall compared with the previous year. Asset managers and custodians, which again performed well in 2025, were also downgraded slightly. That said, they were the best-scoring group, with the highest proportion of scores in the range of 2 or 2-. However, the group with the least score fluctuations since the previous cycle was the diversified lender group.
Chart 24
Breakdown of internal governance SREP scores by business model
(percentages)
Source: ECB SREP database.
Notes: 2026 SREP values are based on assessments of 108 banks. Corporate/wholesale lenders and development/promotional lenders have been grouped together in this chart to preserve statistical confidentiality.
5.2.2 Qualitative measures
In the 2026 SREP cycle, the overall number of new qualitative measures for internal governance and risk management fell for the third year in a row, reflecting the focus on key supervisory concerns, the application of the multi-year approach for SREP assessments and the use of various supervisory tools, such as follow-up letters and operational letters related to horizontal activities and ECB supervisory decisions. Despite this general decline, internal governance remained a key source of concern, ranking second for new measures in the 2026 SREP cycle.
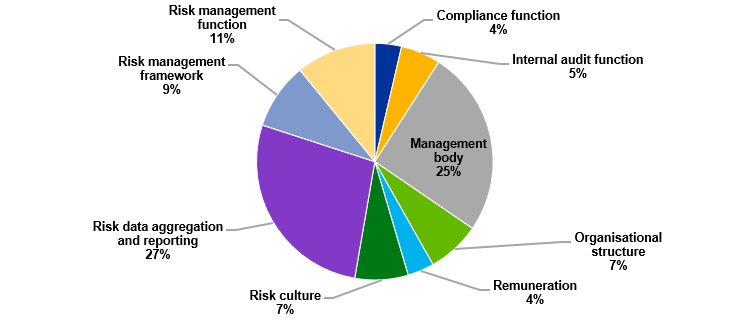
The supervisory findings for internal governance were in keeping with the supervisory priorities for 2026-28, with measures concentrated in two key areas: risk data aggregation and risk reporting (27%) and management body-related issues (25%). These measures focused on the risk management function (11%), but the risk management framework (9%) was also subject to measures, albeit far fewer than in the previous cycle. Measures for risk data aggregation and risk reporting capabilities were mainly related to governance arrangements and the IT infrastructure, such as persisting issues concerning the oversight role of management bodies, the data governance framework, integrated architecture and data quality management. Management body related measures mainly concerned board and committee compositions and collective suitability.
In this cycle, fewer measures were needed to address the internal audit function, compliance function, risk culture, remuneration and organisational structure, accounting for between only 4% and 7% of the total new qualitative measures for internal governance and risk management (Chart 25).
Chart 25
Breakdown of qualitative measures for internal governance and risk management
(percentages)
Source: ECB SREP database.
Notes: 2026 SREP values are based on assessments of 108 banks. This chart does not include weaknesses addressed by supervisory measures taken outside of the 2026 SREP cycle. One qualitative measure can be allocated to several sub-categories.
5.3 Element 3 - Credit risk
In the 2026 SREP cycle, 35% of credit risk scores changed, with 46% of these being upgraded (Chart 26). The overall average credit risk score remained largely unchanged.
While progress was made in strengthening risk controls and addressing previous supervisory concerns, challenges remained. These challenges primarily concerned the asset quality of certain vulnerable portfolios amid the uncertain geopolitical and macroeconomic environment.
Positive developments, however, included a strong private sector performance supported by low unemployment and increasing earnings. This was mirrored in continued resilience in aggregate asset quality, with the NPL ratios remaining at historical lows. Furthermore, Stage 2 ratios fell, and corporate bankruptcies stabilised in the first quarter of 2026, having risen 10% in 2025. Commercial real estate portfolios showed signs of recovery but were still problematical for several institutions. Residential real estate portfolios were resilient, supported by elevated property prices. However, risks were still prevalent in energy-intensive sectors, such as manufacturing, automotive, chemicals, transportation, and agriculture, which faced pressure from the prolonged energy shocks, weaker demand, and higher costs amid geopolitical uncertainties. Despite concerns, banks’ aggregate direct exposure to private credit remained limited, with no visible widespread credit deterioration. While non-financial corporations’ asset quality continued to be broadly stable, rising corporate bankruptcies, particularly among small and medium enterprises and more leveraged firms, as well as vulnerabilities in specific sectors, warranted further monitoring.
ECB Banking Supervision focused on assessing banks’ underwriting standards and risk measurement capabilities, as well as the implementation of the Pillar 1 capital requirements for the standardised approach under CRR III. One particular focus was the quality of banks’ underwriting frameworks for new lending and recognising the role of inadequate loan origination practices in NPL accumulation. Through a risk-based approach targeting the most material-risk portfolios, the ECB plans to proactively identify vulnerabilities in new lending practices and pinpoint segments of the industry where underwriting standards are possibly becoming too relaxed.
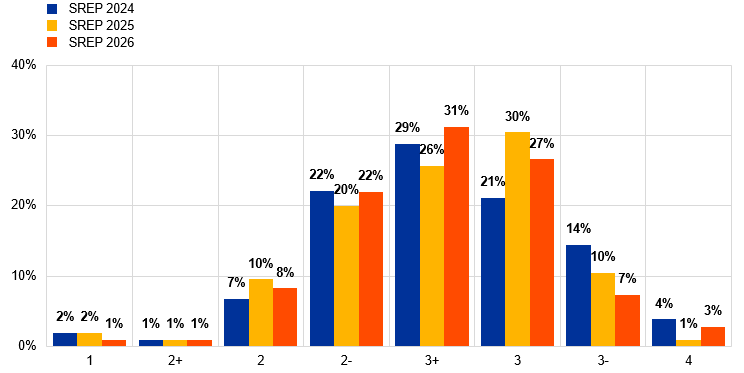
Chart 26
Element 3: Credit risk SREP scores
(percentages)
Source: ECB SREP database.
Notes: 2024 SREP values are based on assessments of 103 banks; 2025 SREP values are based on assessments of 105 banks; 2026 SREP values are based on assessments of 108 banks.
5.3.1 Breakdown of SREP scores by business model
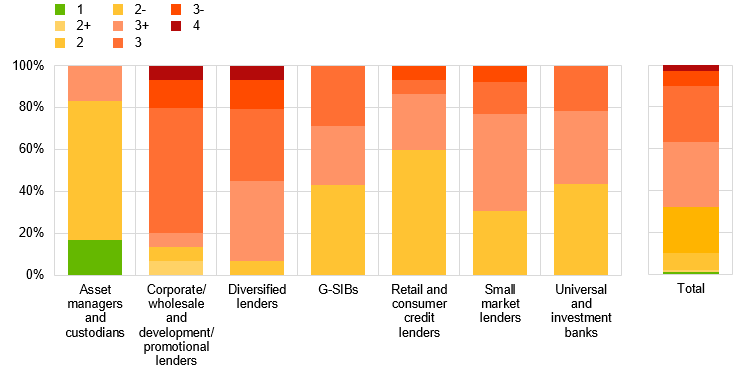
Banks’ aggregate NPL ratio continued to be low and Stage 2 ratios fell. The credit risk profile of most groups, namely diversified lenders, retail and consumer credit lenders, universal and investment banks, and G-SIBs, remained broadly stable, year on year. As seen in Chart 27, these groups fall predominantly in the 2- to 3+ score range, with no major shift in distribution compared with the previous cycle.
Small market lenders continued to perform well, recording the best year-on-year improvement, from 2.9 in 2024 and 2.8 in 2025 to 2.6 in 2026. This was the result of several significant institutions remediating their risk control weaknesses.
Development and promotional lenders’ scores deteriorated the most, from 2.2 in 2025 to 2.5 in 2026. This was largely driven by persistent deficiencies in the risk control of guaranteed loans, which constitute 90% of the lending portfolio. Supervisors require that this group improve their risk management frameworks.
Corporate and wholesale lenders still had the worst average credit risk score across all business models. As shown in Chart 27, scores were clustered in the 3, 3- and 4 bands, with very few scores falling in the 1 or 2+ range. The average year-on-year score remained broadly the same. Several banks experienced increasing NPL ratios, some of which in Stage 2, while continuing to face considerable challenges from high exposure to commercial real estate. For some banks, challenges emerged due to exposure to the automotive sector and to highly leveraged segments. This was exacerbated by the vulnerability of these portfolios to rising geopolitical and macroeconomic uncertainties.
Chart 27
Breakdown of credit risk SREP scores by business model
(percentages)
Source: ECB SREP database.
Notes: 2026 SREP values are based on assessments of 108 banks. Corporate/wholesale lenders and development/promotional lenders have been grouped together in this chart to preserve statistical confidentiality.
5.3.2 Qualitative measures
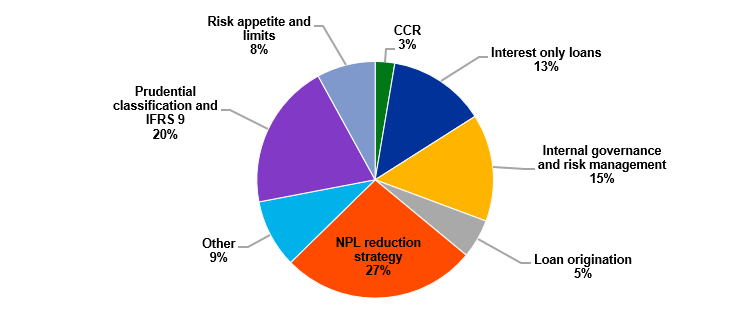
In this SREP cycle, supervisors addressed bank-specific concerns about credit risk management by applying 70 qualitative measures to 37 banks across all business models (Chart 28). Compared with the previous year, these qualitative measures were distributed more evenly across credit risk areas.
As much as 27% of the measures were taken to encourage banks to find strategies for reducing their volumes of NPLs in highly concentrated NPL portfolios or subsidiaries. That said, the number of banks subject to such requirements has declined considerably over recent years. Such measures, as well as those on interest only loans, were measures applicable to a larger set of banks facing similar issues. Other measures, however, were taken by the JSTs as part of their general supervisory activities and were typically tailored to address bank-specific issues. This was the case for the qualitative measures for internal governance and risk management, which accounted for 15% of all measures. The remaining categories of measures are listed in Chart 28.
Chart 28
Breakdown of credit risk-related qualitative measures
(percentages)
Source: ECB SREP database.
Notes: 2026 SREP values are based on assessments of 108 banks. This chart does not include any weaknesses which may already have been addressed by supervisory measures taken outside of the 2026 SREP cycle.
5.4 Element 3 - Operational and information and communication technology risk
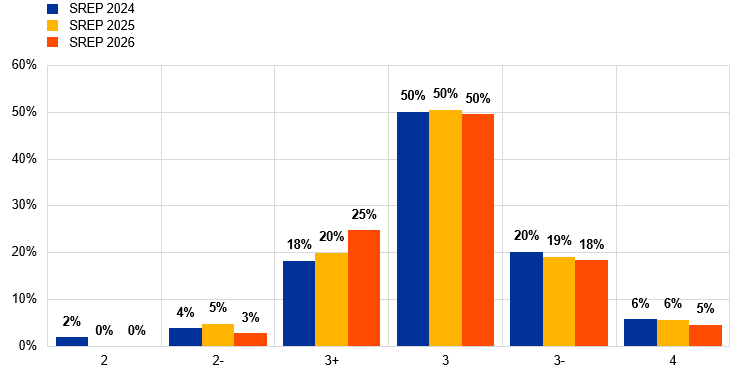
In the SREP 2026 cycle, operational and information and communication technology (ICT) risk scores remained among the worst-scored risk categories, with 96% of significant institutions being given medium-high risk scores (Chart 29). The banking sector faced ongoing ICT-related and operational resilience challenges due to rapid digitalisation, changing consumer expectations, rising cyber threats and heavy reliance on critical third-party providers, including cloud service providers. Geopolitical tensions further amplified cyber risks and the vulnerabilities of outsourcing arrangements, particularly for service providers outside of the European Union.
16% of banks saw score improvements but 13% were downgraded, driven by rising operational losses, persistent risk control deficiencies, ICT vulnerabilities and cyberattacks related to gaps in implementing DORA, as well as to third-party risks. However, some overall improvements were observed in risk controls. Nonetheless, ICT risk continued to contribute the most to the overall score in this category, with a growing impact from third-party risk.
In 2026, ECB Banking Supervision performed two key horizontal activities. The third round of the targeted review of outsourcing again focused on selected aspects of banks’ ICT third-party risk management, only this time it also assessed their compliance with DORA. A targeted review of ICT change management was also conducted to identify gaps in banks' basic risk control frameworks, given that failures in ICT system changes were a primary root cause of unscheduled downtime.
Chart 29
Element 3: Operational and ICT risk SREP scores
(percentages)
Source: ECB SREP database.
Notes: 2024 SREP values are based on assessments of 103 banks; 2025 SREP values are based on assessments of 105 banks; 2026 SREP values are based on assessments of 108 banks.
5.4.1 Breakdown of SREP scores by business model
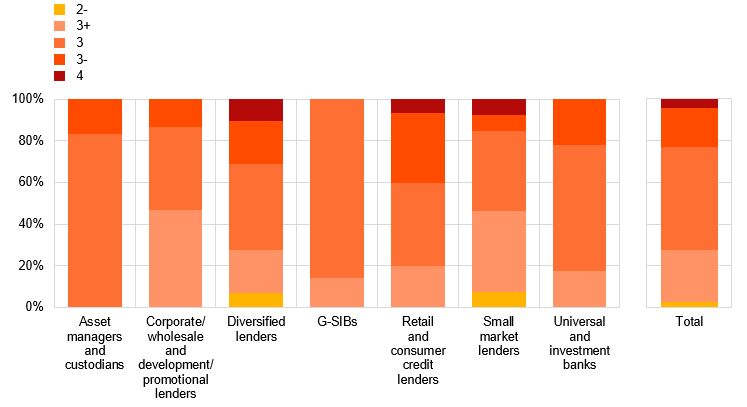
Despite some differences in operational and ICT risk score distributions across business models (Chart 30), operational and ICT risk continued to rank among the worst-scored risk categories, with an average score of 2.99. The ICT risk component scored on average 3.02. The risk profiles of most business models scored broadly the same as last year.
The most upgrades were made to small market lenders and diversified lenders, followed by corporate and wholesale lenders. This was a result of improvements in cyber resilience capabilities and risk governance frameworks, as well as to the remediation of previously identified control deficiencies, although in several cases, these improvements were not adequate to justify any score changes given the low starting point.
Asset managers and custodians were scored least favourably, with assessments clustered in the 3 and 3- range. Universal and investment banks were also assessed as having a rather weak risk profile. By contrast, G-SIBs had the most concentrated distribution of scores, with the vast majority scoring 3 and the remainder 3+. This was a result of structurally high operational losses, persistent risk control deficiencies and the complexity of ICT environments and third-party dependencies. Legal and conduct risk still contributed the most to total operational losses, with ICT vulnerabilities related to legacy system remediation, cloud provider concentration and DORA implementation gaps also continuing to weigh on ICT risk scores.
On the positive side, progress was made on the back of continued investment in cybersecurity capabilities and refinements to third-party risk governance frameworks. However, continued monitoring would be required to address resource inadequacy and a growing dependency on cloud service providers in geopolitically vulnerable regions.
Chart 30
Breakdown of operational and ICT risk SREP scores by business model
(percentages)
Source: ECB SREP database.
Notes: 2026 SREP values are based on assessments of 108 banks. Corporate/wholesale lenders and development/promotional lenders have been grouped together in this chart to preserve statistical confidentiality.
5.4.2 Qualitative measures
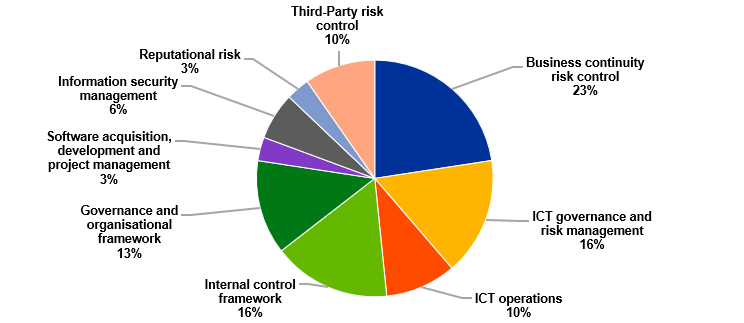
Supervisory findings for operational and ICT risk were in line with the supervisory priorities for 2026-28, with measures concentrated in four key areas: business continuity risk control at 23%, followed by ICT governance and the risk management and internal control framework, each accounting for 16% of the total measures and governance and organisational framework at around 13% (Chart 31). ICT operations and third-party risk control also accounted for a large share of the new measures, both standing at 10%. In addition, several measures were taken to address weaknesses in ICT change management, and in particular deficiencies in testing, deployment controls and post-implementation monitoring.
Chart 31
Breakdown of operational and ICT risk-related qualitative measures
(percentages)
Source: ECB SREP database.
Notes: 2026 SREP values are based on assessments of 108 banks. This chart does not include weaknesses which may have already been addressed by supervisory measures taken outside of the 2026 SREP cycle.
5.5 Element 3 - Capital adequacy
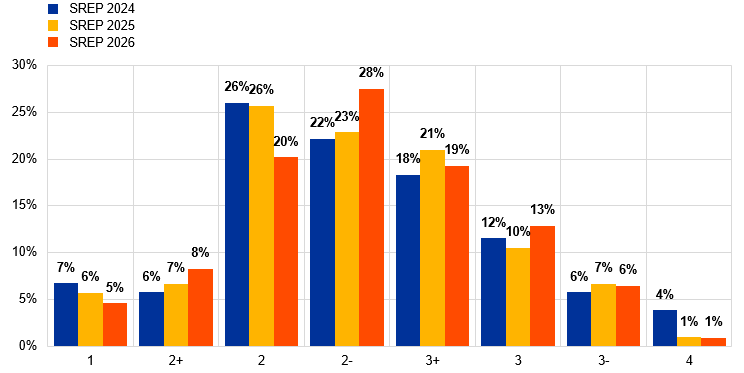
Capital adequacy scores remained broadly stable, albeit with several changes in their distribution compared with 2025 (Chart 32). Around 81% of banks were assigned the same score as in the previous SREP assessment cycle, while 11% saw their score deteriorate and 9% scored better than in the last cycle.
For the assessment of capital adequacy-related risk levels, supervisors scrutinised institutions’ current and forward-looking capital situations. An increased focus on the assessment of relevant risks was further enabled by the ECB’s recently launched fast track assessments for capital and securitisation, supporting faster responses for approval processes, while still applying rigorous standards. This involved analysing major drivers of capital adequacy, such as banks’ planned dividend distributions in combination with the possible related effects on capital planning and on the available and projected capital headroom.
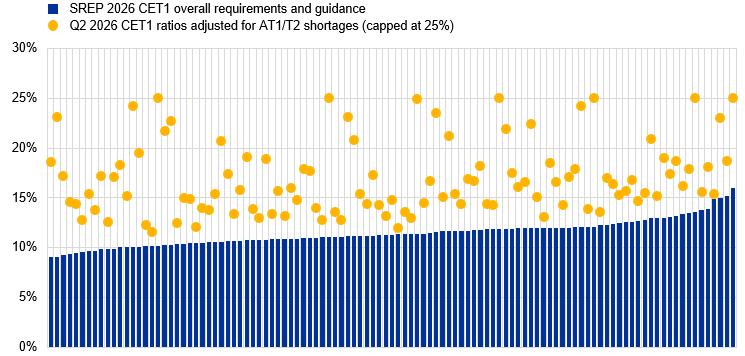
When comparing data from the second quarter of 2026 against the capital requirements applicable in 2027, all institutions have current capital levels above the required projected total of overall forecasted capital requirements, buffers and guidance (Chart 33).
With regard to the ICAAP, supervisors continued to focus on progress in institutions’ capital planning. This included assessing processes, capacity and the general quality of these capital planning frameworks in the context of ongoing geopolitical and macroeconomic uncertainties. This also took the form of reverse stress testing, which links the ICAAP to banks’ recovery plans.[11] Reverse stress tests are based on a predefined outcome (e.g. a breach of total capital requirements) and are designed to challenge the comprehensiveness and conservatism of the ICAAP framework’s assumptions. Reverse stress test outcomes can also support the finetuning of institutions’ recovery scenarios. Based on banks’ individual risk profiles, the thematic reverse stress test conducted by ECB Banking Supervision revealed which geopolitical shocks and transmission channels could most severely affect banks’ profitability and solvency.
These capital planning factors have a major impact on the reliability and timeliness of banks’ capital projections. Therefore, further work is needed here to ensure an effective response to any bank-specific or widespread crisis in the future.
Chart 32
Element 3: Capital adequacy SREP scores
(percentages)
Source: ECB SREP database.
Notes: 2024 SREP values are based on assessments of 103 banks; 2025 SREP values are based on assessments of 105 banks; 2026 SREP values are based on assessments of 108 banks.
Chart 33
CET1 capital headroom against overall capital requirements and Pillar 2 guidance after the 2026 SREP
(percentages)
Sources: ECB supervisory banking statistics and ECB SREP database.
Notes: Pillar 2 CET1 requirements in accordance with the published list of P2Rs applicable as at the first quarter of 2027, and Pillar 2 CET1 guidance in accordance with the 2025 EU-wide stress test coordinated by the EBA and the 2025 SREP. CET1 ratios are as at the second quarter of 2026 and are capped at 25%. For systemic buffers (G-SII, O-SII, SyRB) and the CCyB, the levels shown are those anticipated for the first quarter of 2027 and included in the 2026 CET1 requirements and guidance. Each blue line represents a bank’s overall capital requirements and guidance as in CET1 capital. CET1 ratios are adjusted for AT1/T2 shortages.
5.5.1 Breakdown of SREP scores by business model
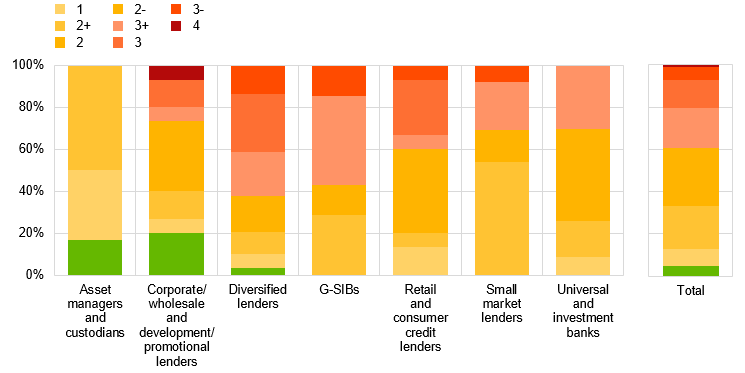
As for the distribution of capital adequacy scores broken down by business model, there was a concentration of scores of 2 and 3 among G-SIBs, retail and consumer credit lenders, small market lenders and universal and investment banks.
A capital adequacy score of 1 was less frequent and mainly assigned to corporate/wholesale lenders and development/promotional lenders, followed by asset managers and custodians as well as diversified lenders.
The capital adequacy score of 4 was assigned to a low percentage of corporate/wholesale lenders and development/promotional lenders.
Chart 34
Breakdown of capital adequacy SREP scores by business model
(percentages)
Source: ECB SREP database.
Notes: 2026 SREP values are based on assessments of 108 banks. Corporate/wholesale lenders and development/promotional lenders have been grouped together in this chart to preserve statistical confidentiality.
5.5.2 Qualitative measures
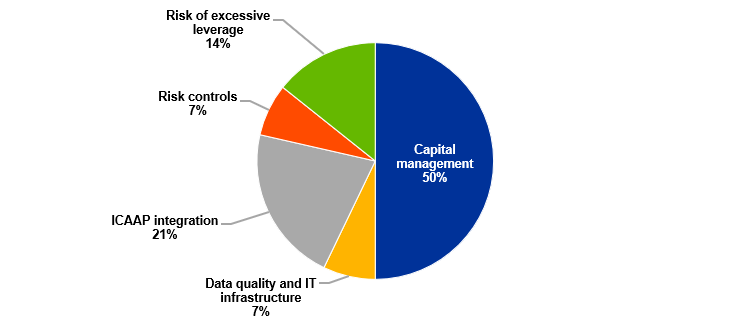
ECB Banking Supervision identified shortcomings in banks’ capital planning frameworks and their ability to generate sufficiently reliable capital projections under both baseline and adverse scenarios. Aside from measures pertaining to capital management, including those on dividend policies and distributions and coverage of risks arising from irrevocable payment commitments, supervisors continued to follow up on ICAAP integration and risk controls for the ICAAP.
Chart 35
Breakdown of capital adequacy-related qualitative measures
(percentages)
Source: ECB SREP database.
Notes: 2026 SREP values are based on assessments of 108 banks. This chart does not include weaknesses which may have already been addressed by supervisory measures taken outside of the 2026 SREP cycle.
5.6 Climate and nature-related risk
In 2026, climate and nature-related (C&N) risks remained a key supervisory priority. The ECB is now switching from a foundational to a business-as-usual approach in terms of its supervision of C&N risk. This comes at the end of the ECB’s five-year C&N risk programme to advance banks’ C&N risk management capabilities. Following the 2022 thematic review of climate-related and environmental risks as well as the climate risk stress test, ECB Banking Supervision encouraged banks to speed up progress, with final deadlines being set for the end of 2024 to bring their practices in line with the supervisory expectations. Binding supervisory decisions were issued to banks with material deficiencies, including the potential imposition of periodic penalty payments. The ECB also imposed periodic penalty payments on two banks for failure to comply with such decisions.
In 2026, the EBA[12] set new regulatory requirements for banks to develop prudential climate-neutral transition plans on a gradual and targeted basis. Overall, considerable progress has been made, with most severe findings remediated in line with the supervisory expectations. Most measures initiated in previous SREP cycles were completed, illustrating how the increased focus on escalation resulted in positive progress. In 2026, further measures were taken to address ICAAP integration and climate risk stress testing.
A few institutions made slower progress, with persistent shortcomings in the risk appetite framework, data governance, physical risks and nature-related risks.
ECB Banking Supervision updated its compendium of good practices for C&N risk management and stress testing to help banks close the gaps in their risk management frameworks and navigate the changing risk environment.[13]
Targeted activities were carried out on prudential transition planning requirements and on banks’ compliance with the supervisory expectations and regulatory requirements. In 2027, a new thematic review of banks’ transition planning will be conducted. Moreover, several additional targeted on-site inspections of C&N-related aspects were carried out, and further inspections will take place.
The ECB will conduct further analyses of banks’ capabilities to address ongoing challenges in specific areas, such as physical C&N risks and the effects of climate change on nature. Such challenges were the focus of a dedicated workshop held with banks and academia on 15 June 2026.
6 Conclusions and outlook
The results of the 2026 SREP cycle continued to showcase the strong resilience of the European banking sector, despite the prominent downside risks. These included heightened geopolitical risks, surging energy prices and supply chain disruptions.
Overall, SREP scores, capital requirements and guidance have remained broadly stable over the past year, reflecting both the positive and negative drivers of these scores, as well as the short-term, backward-looking and the long-term, forward-looking perspectives in the SREP assessments.
On the positive side, the most noticeable improvements were seen in the area of profitability, the sustained low aggregate levels of NPLs, improvements in loan origination and monitoring practices, and the progress made in enhancing internal governance frameworks, such as the compliance function and role of the management body.
On the negative side, the main drivers of the poorer SREP scores included the broad decline in NII and structural cost challenges, as well as competition pressures and persisting deficiencies in credit risk management frameworks. There was also a need for further improvements in areas such as risk data aggregation and risk reporting capabilities, the risk management framework, the management body composition and suitability, and the risk culture.
The 2026 SREP outcome also helped to identify the key vulnerabilities for the euro area banking sector going forward, providing input for the supervisory priorities for 2027-29. These priorities reflect the need for the banking sector to remain resilient in the face of the uncertain geopolitical environment, in which strong operational resilience and ICT capabilities will be paramount.
The SREP reform was fully implemented in 2026. In this respect, the SREP outcomes were communicated two months earlier than was previously the case before the reform. Furthermore, the number of qualitative measures taken fell significantly compared with the last cycle, reflecting the continued streamlining of the SREP outcomes and the focus on higher severity findings. Finally, the SREP decisions are now more centred on key vulnerabilities, with a reduction in the length of the SREP decision from 30 pages to roughly 9 pages. Going forward, ECB Banking Supervision, together with the national competent authorities, will continue to advance its reform agenda for more effective, efficient and risk-based European banking supervision[14].
© European Central Bank, 2026
Postal address 60640 Frankfurt am Main, Germany
Telephone +49 69 1344 0
Website www.ecb.europa.eu
All rights reserved. Reproduction for educational and non-commercial purposes is permitted provided that the source is acknowledged.
For specific terminology please refer to the ECB glossary (available in English only).
HTML ISBN 978-92-899-8079-1, ISSN 2811-6887, doi:10.2866/8599117, QB-01-26-257-EN-Q
The Capital Requirements Regulation (CRR) defines the total capital ratio as the own funds of the institution expressed as a percentage of the total risk exposure amount. The Common Equity Tier 1 capital ratio is the Common Equity Tier 1 capital of the institution expressed as a percentage of the total risk exposure amount (Capital Requirements Regulation).
The Pillar 2 requirement is a bank-specific capital requirement which supplements the minimum capital requirement (known as the Pillar 1 requirement) in cases where the latter underestimates or does not cover certain risks (Pillar 2 requirement). The Pillar 2 guidance is a bank-specific recommendation that indicates the level of capital the ECB expects banks to maintain in addition to their binding capital requirements to ensure they can absorb potential losses resulting from adverse scenarios (Pillar 2 guidance).
The countercyclical capital buffer (CCyB) is intended to ensure that credit institutions accumulate sufficient capital during periods of excessive credit growth to be able to absorb losses during periods of stress. The systemic risk buffer (SRB) is applied to the financial sector or to one or more subsets of the sector, in order to prevent and mitigate long-term non-cyclical systemic or macroprudential risks. The global systemically important institutions (G-SII) buffer and the other systemically important institutions (O-SII) buffer aim to reduce the moral hazard created by the implicit state support and guarantee of bail-out using taxpayers’ money that such institutions enjoy due to their size, cross-border activities and interconnectedness (Macroprudential policy and financial stability glossary).
In the EU, the final Basel III reform package is implemented through Directive 2024/1619 (“CRD VI”) and Regulation 2024/1623 (“CRR III”).
See “Understanding the banking sector capital framework in the European UnionOccasional Paper Series, No 387”, , ECB, 2026.
Increases in the Pillar 1 requirements due to changes in the risk profile or portfolio composition have been disregarded for the purpose of this assessment.
For details on the new P2R methodology, see “How the Pillar 2 requirement is set”, ECB’s banking supervision website, 18 November 2025.
“Fully phased-in” refers to the full implementation of the Basel III rules and the EU banking package (CRR III and CRD VI), which European banks are expected to comply with by 2033.
An NPE P2R add-on is an additional capital requirement imposed if a bank does not have adequate provisions to fully cover the risk of its bad loans. The NPE P2R add-on is included in “step 3” of the ECB’s new P2R methodology.
See Financial Stability Review, ECB, May 2026.
For further information, see Principle 7 of the ECB Guide to the internal capital adequacy assessment procedure (ICAAP).
See “EBA Guidelines on the management of environmental, social and governance (ESG) risks”, published in January 2025 and applicable from January 2026.
See “Good practices for climate and nature risk management - Observations from the ECB’s five-year climate and nature risk programme (2020-25)”, ECB, May 2026.
See “Streamlining supervision, safeguarding resilience: the ECB’s agenda for more effective, efficient and risk-based European banking supervision”, Executive summary, ECB, 2025.