


- PRESS RELEASE
ECB publishes supervisory banking statistics on significant institutions for the second quarter of 2026
15 September 2026
- Common Equity Tier 1 ratio at 16.00% in second quarter of 2026, compared with 15.99% in previous quarter and 16.09% one year ago
- Annualised return on equity at 10.73% in second quarter of 2026, up from 10.02% in previous quarter and 10.11% one year ago, highest reported value since start of time series (second quarter of 2015)
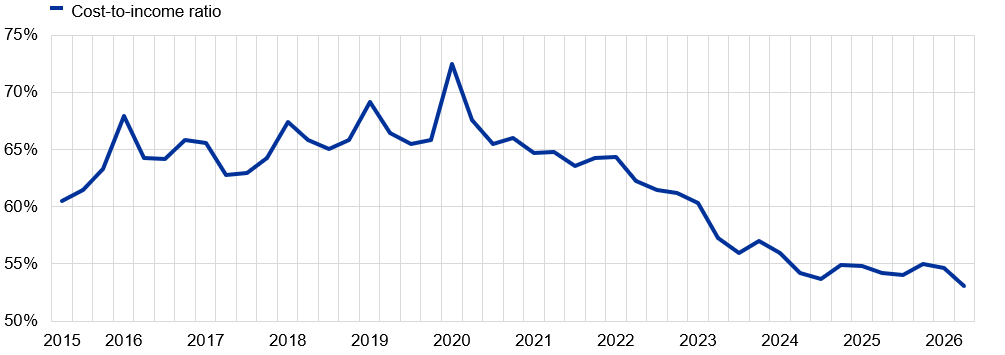
- Cost-to-income ratio at 53.06%, down from 54.63% in previous quarter and 54.20% one year ago, lowest level since start of time series
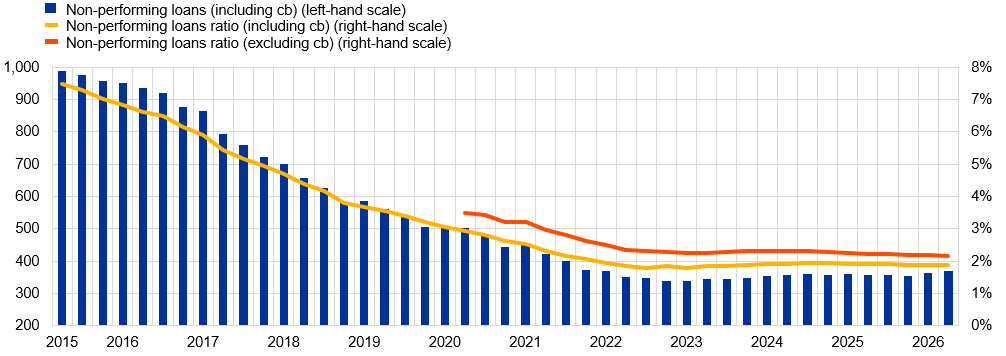
- Non-performing loans ratio (excluding cash balances) at 2.17% in second quarter of 2026, compared with 2.18% in previous quarter and 2.22% one year ago
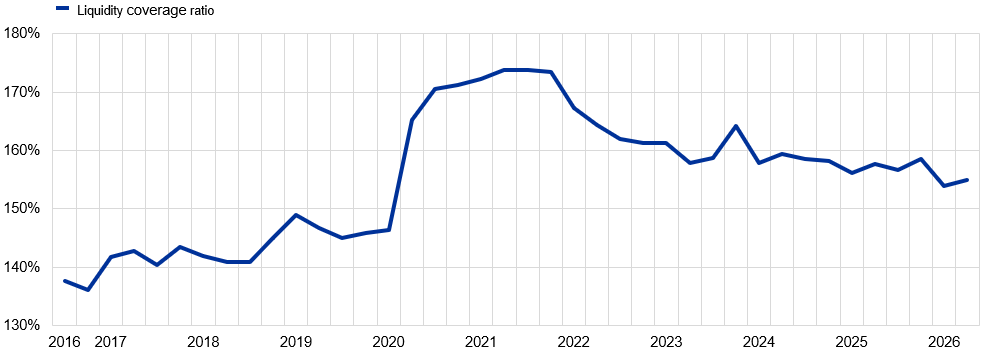
- Liquidity coverage ratio at 154.91% in second quarter of 2026, up from 153.94% in previous quarter and down from 157.71% one year ago
- ECB publishes system-wide supervisory banking statistics on all supervised institutions, representing combined aggregates of statistics for significant and less significant institutions
Capital adequacy
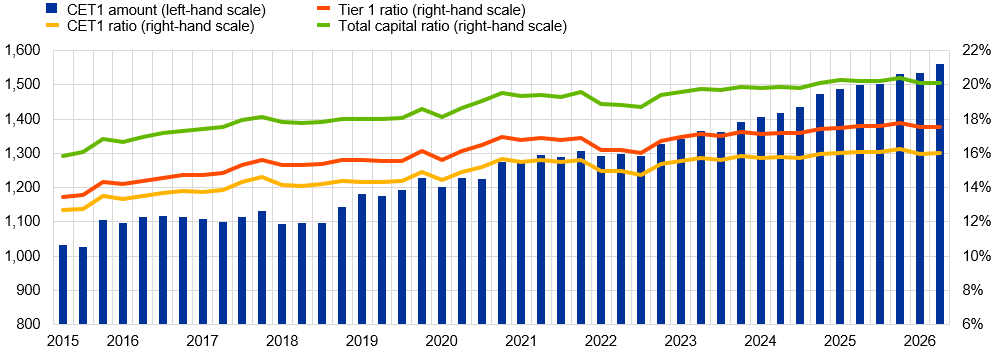
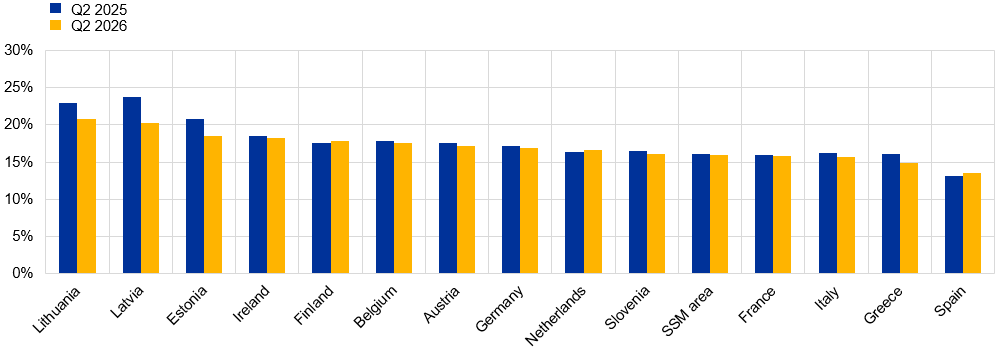
Capital ratios interactive reportIn the second quarter of 2026, the aggregate capital ratios of significant institutions (banks supervised directly by the ECB) were up from the previous quarter and down from the same period last year. The aggregate Common Equity Tier 1 (CET1) ratio stood at 16.00%, compared with 15.99% in the previous quarter and 16.09% one year ago. The aggregate Tier 1 ratio stood at 17.53%, compared with 17.51% in the previous quarter and 17.57% one year ago. Meanwhile, the aggregate total capital ratio stood at 20.13%, compared with 20.11% in the previous quarter and 20.21% one year ago. Across countries, the CET1 ratio ranged from 13.52% in Spain to 20.78% in Lithuania.
Chart 1
CET1 amount and capital ratios
(EUR billions)
Source: ECB.
Chart 2
CET1 ratios by country
Source: ECB.
Notes: “SSM” stands for Single Supervisory Mechanism. Some countries participating in European banking supervision are not included in this chart, either for confidentiality reasons or because there are no significant institutions at the highest level of consolidation in that country.
Asset quality
Non-performing loans interactive reportThe non-performing loans (NPL) ratio excluding cash balances at central banks and other demand deposits stood at 2.17% in the second quarter of 2026. The stock of NPLs (numerator) increased by €7.65 billion (2.1%), at the same time the total amount of loans and advances (denominator) rose by €429.27 billion (2.6%). As a result, the ratio decreased slightly by one basis point compared with the previous quarter.
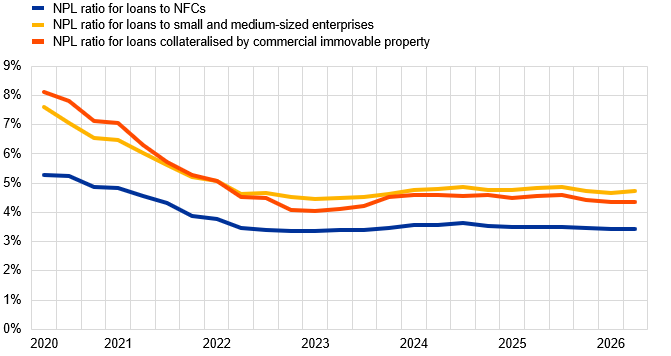
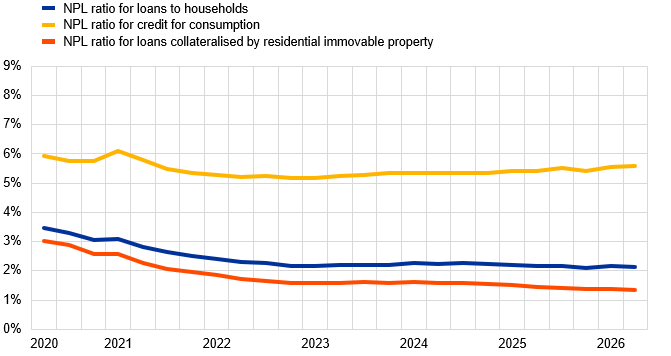
At the sector level, the NPL ratio for loans to households stood at 2.14%, compared with 2.15% in the previous quarter and 2.16% one year ago. For loans to non-financial corporations (NFCs), the ratio stood at 3.44%, unchanged from the previous quarter and down from 3.50% one year ago. Considering the NFC portfolio by segment, the NPL ratio for loans collateralised by commercial immovable property stood at 4.36%, down from 4.37% in the previous quarter and from 4.55% one year ago. The NPL ratio stood at 4.72% for loans to small and medium-sized enterprises, compared with 4.65% in the previous quarter and 4.85% one year ago.
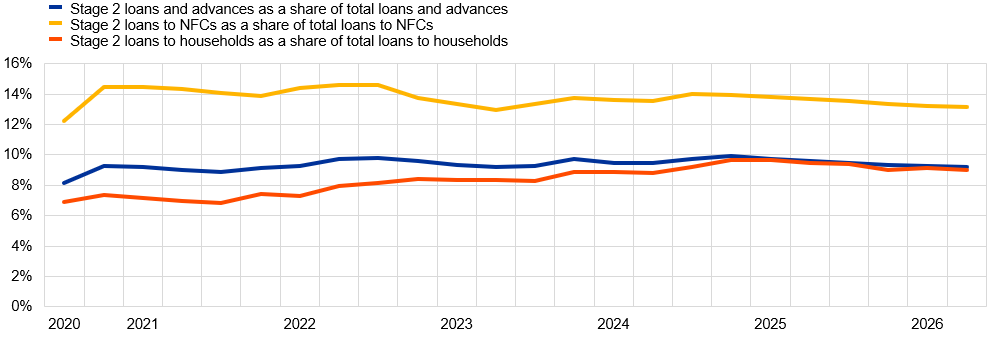
Aggregate stage 2 loans as a share of total loans decreased to 9.18% from 9.29% in the previous quarter and 9.59% one year ago. The ratio for loans to NFCs and the ratio for loans to households decreased, respectively, to 13.13% and 9.03% from 13.22% and 9.13% in the previous quarter.
Chart 3
Non-performing loans
(EUR billions)
Source: ECB.
Note: “cb” stands for cash balances at central banks and other demand deposits.
Chart 4
Non-performing loans by counterparty sector
a) Breakdown of NFC portfolio by segment | b) Breakdown of household portfolio by segment |
|---|---|
 |  |
Source: ECB.
Chart 5
Stage 2 loans and advances as a share of total loans and advances subject to impairment review
Source: ECB.
Note: Stage 2 assets are those that have shown a significant increase in credit risk since initial recognition. Loans and advances subject to impairment review are loans and advances at amortised cost and fair value through other comprehensive income, classified in Stage 1, Stage 2, Stage 3, or as purchased or originated credit-impaired.
Profitability
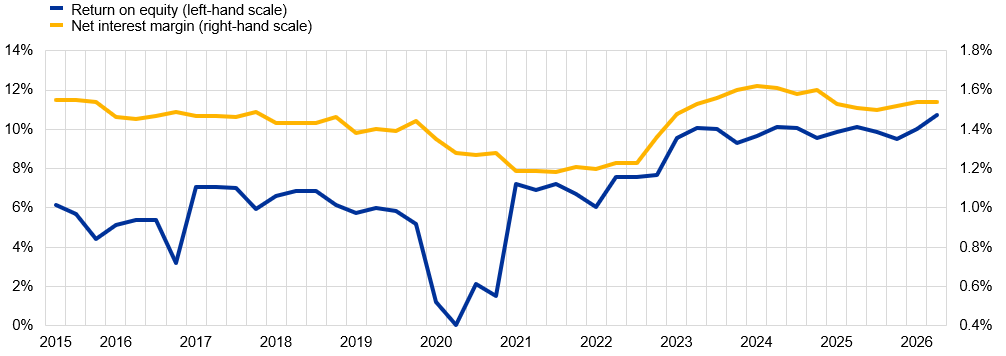
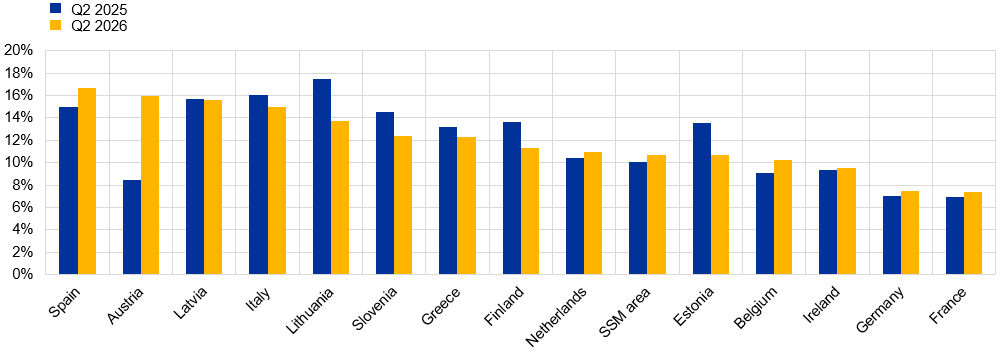
Profitability interactive reportThe aggregate annualised return on equity stood at 10.73% in the second quarter of 2026 compared with 10.02% in the previous quarter and 10.11% one year ago. A sizeable increase in operating income (driven by higher net interest income and net fee and commission income, both of which rose by 8% year on year) was partially offset by higher equity (owing to a 6% increase in reserves compared with one year ago). The return on equity across countries ranged from 7.41% in France to 16.64% in Spain in the second quarter of 2026. At the same time, the aggregate net interest margin remained unchanged at 1.54% compared with the previous quarter.
Chart 6
Return on equity and net interest margin
Source: ECB.
Chart 7
Return on equity by country
Source: ECB.
Notes: “SSM” stands for Single Supervisory Mechanism. Some countries participating in European banking supervision are not included in this chart, either for confidentiality reasons or because there are no significant institutions at the highest level of consolidation in that country.
In the second quarter of 2026, the cost-to-income ratio was 53.06%, the lowest level recorded since the start of the time series in 2015. The ratio declined from 54.20% one year earlier, as the 6% increase in operating income more than offset the 4% rise in administrative expenses and depreciation.
Chart 8
Cost-to-income ratio
Source: ECB.
Liquidity
Liquidity interactive reportThe aggregate liquidity coverage ratio stood at 154.91% in the second quarter of 2026, up from 153.94% in the previous quarter and down from 157.71% one year ago. The quarter-on-quarter upward trend was driven mainly by an increase of €87 billion (1.7%) in the liquidity buffer compared with the previous quarter.
Chart 9
Liquidity coverage ratio
Source: ECB.
System-wide statistics
Key figuresThe ECB has released a new set of aggregated banking statistics representing combined aggregates of significant institutions (SIs) and less significant institutions (LSIs). The system-wide statistics offer a unique supervisory perspective of the entire Single Supervisory Mechanism (SSM) banking sector and enhance transparency. Mirroring the structure of the SI and LSI statistics, the system-wide statistics cover key indicators on capital, profitability, liquidity and asset quality. The indicators can be explored visually via interactive reports, which provide an overview of the latest developments in these areas and allow users to analyse time series as well as to select either SIs, LSIs or system-wide samples. The dataset for the new system-wide statistics will be updated on a quarterly basis, jointly with the LSI statistics.
Factors affecting changes
Supervisory banking statistics are calculated by aggregating the data reported by banks which report COREP (capital adequacy information) and FINREP (financial information) data at the relevant point in time. Consequently, changes from one quarter to the next can be influenced by the following factors:
- changes in the sample of reporting institutions;
- mergers and acquisitions;
- reclassifications (e.g. portfolio shifts as a result of certain assets being reclassified from one accounting portfolio to another).
For media queries, please contact Benoit Deeg, tel.: +491721683704.
Notes
- The complete set of supervisory banking statistics with additional quantitative risk indicators is available on the ECB’s banking supervision website. The time series are also available for download from the ECB Data Portal.
Banco Central Europeu
Direção-Geral de Comunicação
- Sonnemannstrasse 20
- 60314 Frankfurt am Main, Alemanha
- +49 69 1344 7455
- media@ecb.europa.eu
A reprodução é permitida, desde que a fonte esteja identificada.
Contactos de imprensa