- THE SUPERVISION BLOG
Overlays and in-model adjustments: identifying best practices for capturing novel risks
Blog post by Elizabeth McCaul, Member of the Supervisory Board of the ECB, and Stefan Walter, Director General of Horizontal Line Supervision
Frankfurt am Main, 26 May 2023
Introduction
It’s a fact of life for supervisors that they constantly face new risks that need to be assessed. While the gloomy outlook of the pandemic is receding, a stream of emerging risks has arisen. Energy supply, geopolitical risks and inflation come to mind. That’s why this is a good moment to reflect on how prepared the European banking system is to identify and cover novel credit risks in a timely manner. This blog post focuses on one area within our supervisory priorities for 2022 to 2024: IFRS 9 provisioning frameworks of our supervised banks. This matters to us because it has a direct effect on prudential capital ratios, profitability and, ultimately, bank resilience.
Against this background, in November 2022 we launched a targeted review of IFRS 9 provisions to better understand whether and how banks already cover novel risks with loan loss provisions. The information we have gathered from the review is helping us target our supervisory actions and establish credible and consistent provisioning practices.
How are banks coping with emerging risks in provisioning?
We asked almost half of the banks under our supervision how their IFRS 9 provisioning framework captures emerging risks. We selected the sample on the basis of our benchmarking framework for assessing the quality of banks’ internal provisioning practices.
We asked banks about five novel risks likely to have a prominent impact on default rates identified in our previous surveys: supply of energy, supply chains in general, environmental risks, inflation and geopolitical risks. All five have something in common: they lack the necessary historical data on which classical expected loss provisioning models depend. That’s why banks need alternative approaches to quantify and cover these risks reliably. Spoiler alert: some challenges remain.
First, though, some good news: banks acknowledge that there are indeed novel risks and try to capture them. As we expected, most respondents said they use “overlays”[1] to assess novel risks. But we also identified some credible alternative approaches. These include using complementary model solutions (“in-model adjustments”) and additional models relying on a different modelling logic, like simulations, scenario analysis or client sampling techniques. While these solutions do not yield client-specific provisions, they provide for collective allowances at a sectoral level. With a top-down view, banks can steer and monitor novel risks actively, and set aside sufficient capital to cover them.
When banks use in-model solutions, provisions incorporate novel risks automatically. In contrast, when banks quantify emerging risks outside the existing models, they record overlays. Overlays became prevalent during the pandemic, and are now widely used for different novel risks not easily captured by models. To be clear, using overlays that are grounded in sound analysis with strong governance and transparency is welcomed.
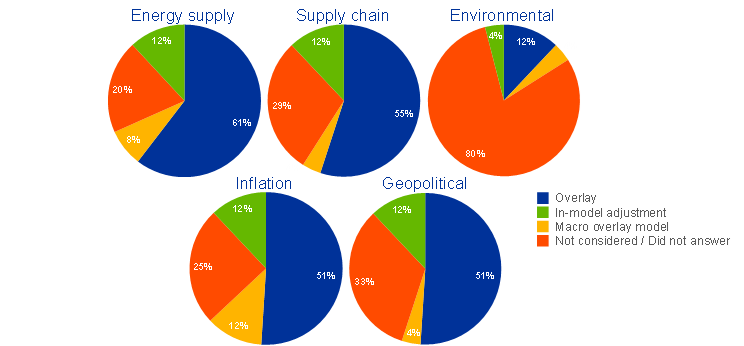
We are pleased to see that many banks have already started to use in-model adjustments or evidence-based overlays to try to quantify how inflation, geopolitical risk, supply chain shortages and energy prices have affected their clients’ creditworthiness. In-model adjustments and overlays exist in many forms and configurations. Think of an in-model adjustment capturing the effects of higher interest rates by increasing the default probability for clients active in the development of commercial real estate, or an overlay that leverages on households’ payment history to simulate how an increase in the cost of living would strain their debt service capacity. A small portion of pioneer banks even include concrete model solutions to add environmental risk to their IFRS 9 provisioning framework (12% using overlays and 4% using in-model adjustments). For example, some re-rate all their clients assuming higher levies on carbon emissions, or higher costs to consume natural resources like water, and thus model environmental risk-driven defaults. We recommend that others follow the good example set by banks using such in-model adjustments or overlays for the effects of higher interest rates on commercial real estate client debt capacity or for modelling environmental risk-driven default.
Where do we see cause for concern? Unfortunately, a significant minority of banks are not yet capturing novel risks. And among those that do, not all quantify them robustly. Chart 1 shows the proportions of banks that are not capturing certain risks at all (red segments). The yellow segments show banks that claim that their legacy IFRS 9 macro-overlay models would capture novel risks. However, these legacy models were designed before 2018 to prepare for the introduction of IFRS 9. By definition, such models lack sensitivity towards the novel risks we are concerned about today. They are incapable of differentiating the nuanced sectoral impacts of each novel risk.
Chart 1
While overlays take a prominent place in banks’ arsenal of tools to manage emerging risks, a significant minority are not yet capturing emerging risks
Proportion of respondents applying certain methods to capture different emerging risk factors
(percentages)
Sources: ECB calculations based on data collected in the IFRS 9 questionnaire.
Notes: Based on a sample of 51 banks. The pie charts show, for each risk factor considered in the questionnaire, the way in which banks say they capture that risk factor in their IFRS 9 provisioning framework.
These two groups of banks are not yet positioned to even capture novel risks. In addition to the obvious prudential concerns stemming from unidentified risks, they may end up systematically mispricing newly originated loans. On the one hand, banks may earn margins that are not commensurate with the risk they are taking. On the other hand, they may forfeit profitable lending opportunities to safer clients if their pricing mechanisms do not correctly capture the riskiness of their customers. We strongly encourage these banks to develop concrete solutions to catch up with their peers, especially with those that are adjusting their existing models to capture novel risks (Chart 1, green segments).
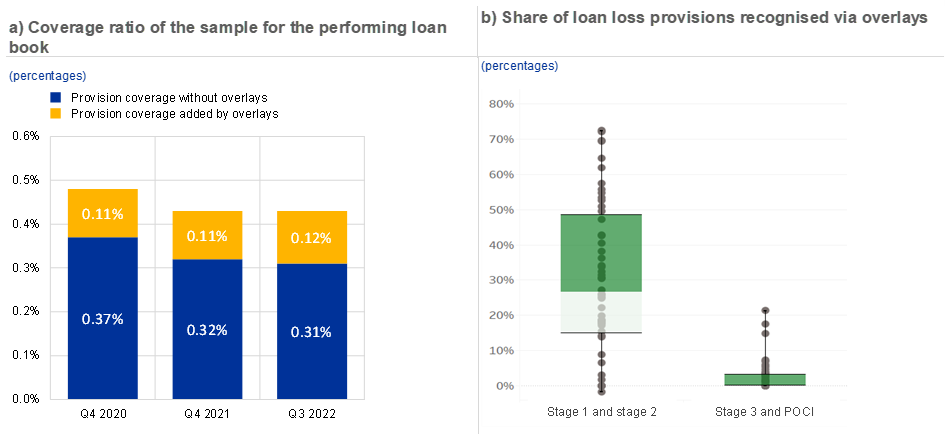
Among the banks that do capture novel risks, overlays are the most common approach (Chart 1, blue segments). While this approach is useful, concerns arise if such overlays are not implemented properly. Our data indicate that overlays make up a significant part of stage 1 and 2 provisions, contributing 0.12% to a coverage ratio of 0.43% in the third quarter of 2022 (Chart 2, panel a). What surprised us, however, is how much the use of overlays differed across banks. The share of overlays in loan loss provisions for stage 1 and stage 2 exposures ranges from 0% to well above 70%, with a median value of 27% (Chart 2, panel b).
Chart 2
Overlays play an important role in provisions for banks’ performing loan books, but there are significant differences across banks
Sources: ECB calculations based on data collected in the IFRS 9 questionnaire and supervisory reporting (FINREP).
Notes: Data shown are for FINREP template F18.00 row 0180 “Debt instruments at cost or at amortised cost”. Panel a) shows the coverage ratio for stage 1 and stage 2 exposures at aggregated level for the 51 banks in the sample. Panel b) shows the share of overlays in the stock of loan loss provisions. The boxes represent the interquartile range, showing the spread of the middle 50% of the data. The line inside the boxes represents the median. The whiskers extend from the boxes and indicate the range of the data. Reference date for panel b): 30 September 2022. POCI stands for “purchased or originated credit-impaired”.
Given their prominence, we will now go on to explore how overlays can play a useful role in banks’ arsenal of tools to properly manage and provision for emerging risks.
Overlays: good and bad practices observed
It is worth repeating that the use of overlays does not in and of itself give us cause for concern. Rather, we are concerned about any deficiency in quantifying risk coming from an ineffective use of overlays, and we worry when a lack of governance and transparency for overlays prevents risks from being sufficiently quantified. To design evidence-based approaches to capture novel risks, banks must first quantify them at a sectoral level and then identify which groups of clients are affected by each novel risk.
A number of banks are already doing this. Some quantify the impacts by simulating stress on all or some (vulnerable) borrower groups and assessing how much they are affected in baseline and adverse scenarios. Others carry out sensitivity analyses based on sector-specific scenario assumptions in which client ratings are recalculated and downgraded depending on how risks affect their financial status. Some banks also achieved this by using robust sampling techniques where they take a representative sub-sample and assess individual clients in-depth. They then extrapolate the impact on expected credit losses, complemented by collective stage transfers. These techniques provide examples of good practice.
Unfortunately, we also found that most other banks lacked risk-sensitivity and relied too much on judgement. Bad practices include applying “umbrella overlays”, which tend to cover a broad spectrum of unrelated risks and/or multiple portfolios or borrower groups with different underlying credit risk characteristics.
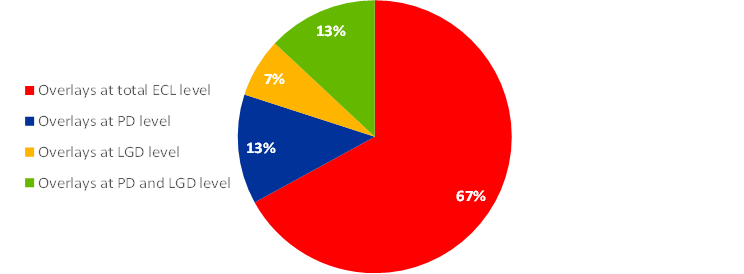
Another area of concern is the predominant use of overlays that do not distinguish probability of default (PD) and loss given default (LGD) (Chart 3). These “overlays at total expected credit loss (ECL) level” lack risk sensitivity. It is well known that credit risk behaves nonlinearly, so it stands to reason that aggregating several risk dimensions into one single metric systematically underestimates their combined impact.
Chart 3
Overlays are predominantly applied at an aggregated level that does not easily allow for risk differentiation
Level in provisioning process where overlays are applied
(percentages)
Sources: ECB calculations based on data collected in the IFRS 9 questionnaire.
Notes: We asked banks to report detailed information about their ten most significant in-model adjustments and overlays. Banks reported a total of 203 different overlays.
In addition, banks using “overlays at total ECL level” did not reflect the risks driving ECL overlays in their stage 2 classifications. They correctly assumed that increased credit risk should lead to increased provisions within a certain stage, but they simply disregarded the fact that increased credit risk also requires transfers to stage 2. This practice is not just contradictory, it also leads to insufficient risk coverage.
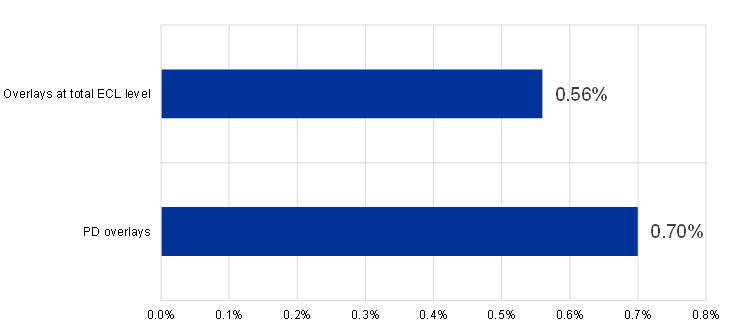
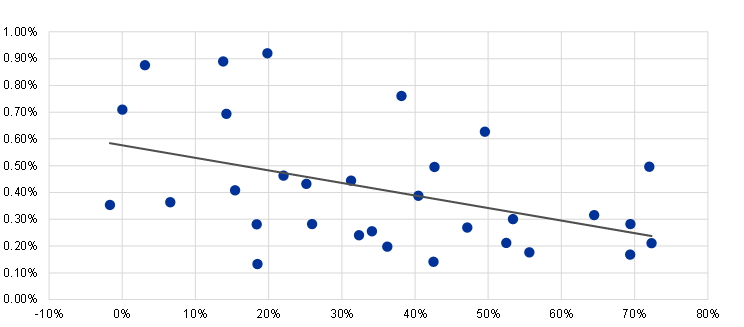
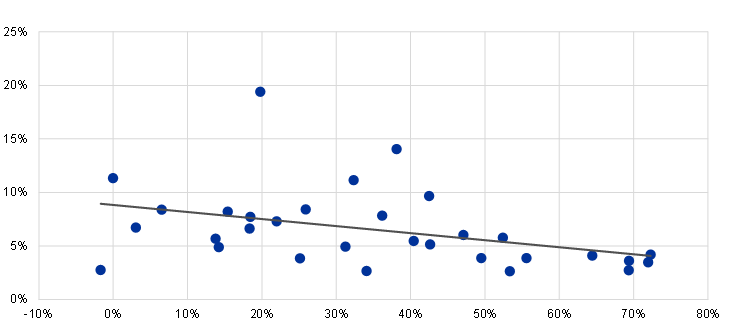
Our concerns were confirmed by a significant quantitative correlation (Chart 4): banks tended to record lower provisions when they did not drill down into the impact of novel risks at the PD or LGD level. Banks using less risk-sensitive approaches for overlays tended to have lower provision coverage (Chart 5, panel a) and lower stage 2 ratios (Chart 5, panel b). As supervisors, we expect banks either to identify risks at the PD or LGD level or, at least, to complement their overlays at total ECL level with collective stage 2 transfer methodologies.
Chart 4
Banks applying overlays at a less granular level show lower coverage of the performing loan book
Coverage ratio for the performing loan book
(percentages)
Sources: ECB calculations based on data collected in the IFRS 9 questionnaire and supervisory reporting (FINREP).
Notes: Data shown are for F18.00 r0180 “Debt instruments at cost or at amortised cost”. Reference date: 31 September 2022. The chart shows the coverage ratio for stage 1 and stage 2 exposures at aggregated level for the banks in each category. The category “Overlays at total ECL level” includes 31 banks that solely reported overlays at total ECL level. The category “PD overlays” includes eight banks that reported overlays at PD level and/or overlays at PD/LGD level. The difference between the two categories is statistically significant at a 5% confidence level.
Chart 5
Extensive reliance on overlays correlates with lower provisioning coverage and a lower stage 2 ratio
a) Reliance on overlays against the coverage ratio for stage 1 and stage 2 exposures
(percentages)
b) Reliance on overlays against the stage 2 ratio
(percentages)
Sources: ECB calculations based on data collected in the IFRS 9 questionnaire and supervisory reporting (FINREP).
Notes: Data shown are for F18.00 r0180 “Debt instruments at cost or at amortised cost”. Reference date: 31 September 2022. Based on a sample of 31 banks that solely reported overlays at total ECL level. Panel a) plots the share of overlays in the stock of loan loss provisions (x-axis) against the coverage ratio for stage 1 and stage 2 exposures (y-axis). Panel b) plots the share of overlays in the stock of loan loss provisions (x-axis) against the stage 2 ratio (y-axis). For both panels, the coefficient of X is statistically significant at a 5% confidence level.
Our evidence confirms not only that the use of overlays “at total ECL level” is at odds with the principles of IFRS 9, which require banks to capture all identifiable risks for stage transfers, but also that it correlates with lower provisioning coverage.
Conclusion
The results of the targeted review provided some important insights about current market practices. We want to share these insights to promote the identification and remediation of weaker practices and the broader adoption of some best practices.
Traditional IFRS 9 models fall short of reflecting actual credit risk expectations for novel risks in a rapidly changing environment. Overlays are a useful tool to address emerging risks, but only when they are delivered with strong governance and transparency, are supported by evidence and are built on sound methodologies. Umbrella overlays that do not reflect sectoral nuances for novel risks do not meet these criteria. In-model adjustments that seek to quantify the impact of novel risks using scenarios and simulations are one example of best practice.
We welcome the effort made by most banks to design risk-sensitive overlays addressing novel risks. However, we also see too many banks that are ignoring the relevance of these risks altogether. We strongly encourage those banks to follow the best practices of their peers and use simulations or scenarios to re-rate their clients, combined with sampling techniques. We see good practices as assessing the impact of emerging risks on borrowers’ creditworthiness, resulting in timely transfers to stage 2 and adequate provision coverage in banks’ regulatory capital. We can’t stress this enough. For example, it is crucial in today’s market to fully consider inflation risk and its secondary effects on debt and repayment capacity. This is also particularly important for climate and environmental risks, which are becoming a prominent driver of expected credit losses.
In sum, we encourage the effective use of in-model adjustments and evidence-based overlays that help banks to quantify risk, provide proper stage 2 classifications and, ultimately, assess the right levels of capital to set aside for novel risks.
IFRS 9 does not include a definition of “overlay”; banks sometimes refer to overlays as “management adjustment”, “post-model adjustment” or “top level adjustment”. For the purpose of our targeted review, the following definitions were used: (i) overlay: “the type of adjustment that is performed only after the model is operated. Post-model adjustments are considered as overlays for this questionnaire”; (ii) in-model adjustment: “those adjustments that are performed inside of the IFRS 9 model – either before or during the run time of the model. For instance, adjustments to the model input (e.g. overrides to the component of forward-looking information), adjustments to the model parameters (e.g. alteration of a PD model input parameter), or ad hoc adjustments to the model or model calibration”.


