Annual report on the outcome of the SREP IT Risk Questionnaire – Feedback to the industry
Executive summary
In the light of the European Banking Authority (EBA) Guidelines on ICT Risk Assessment[1] under the Supervisory Review and Evaluation process (SREP)[2], ECB Banking Supervision together with the National Competent Authorities developed a dedicated SREP IT risk assessment methodology[3]. This includes the IT Risk Questionnaire (ITRQ) as a form of standardised information collection from supervised institutions for the comprehensive assessment of all IT risk areas.
This document presents the key observations and conclusions based on a horizontal analysis of the ITRQ, for which self-assessments were submitted to ECB Banking Supervision in the first quarter of 2019 by the significant supervised institutions. This publication is designed to share insights from the analysis and increase awareness on IT risk management overall within the supervised institutions. The desired outcome would be for institutions to further improve their resilience, which is seen as a critical factor for financial stability.
The main observations can be broadly divided into five areas, all of which were also observed to some extent in the previous year’s analysis, and are further detailed in Part 1 of this report:
- IT governance, which is characterised by overly optimistic self-assessment by the institutions;
- “Data quality management” and “IT risk management”, which were reported as the weakest amongst all areas;
- IT security, where the use and management of “end-of-Life” systems (EOL) for critical processes is still particularly challenging for many institutions;
- IT outsourcing, a higher concentration of which was observed at the level of individual institutions and several institutions have reported losses due to the unavailability or poor quality of outsourced services;
- IT audit and examinations, the large majority of critical findings which had not been addressed for more than one year – stemming from all types of investigations – were related to IT security risk.
ECB Banking Supervision has identified a number of focus areas which will be discussed in more detail in this report, namely in Part 1, section 3:
- ECB Banking Supervision intends to focus on the collective suitability of the boards with respect to their IT expertise;
- ECB Banking Supervision plans to increase the focus on institutions that report on having EOL systems supporting critical banking activities with the aim at decreasing the dependencies on EOL systems;
- ECB Banking Supervision is placing greater emphasis on outsourcing activities, including cloud outsourcing, and their monitoring by the institutions. In line with the EBA Guidelines on outsourcing arrangements, ECB Banking Supervision expects full compliance with the applicable regulation regarding outsourcing[4] within the respective timeline[5].
- ECB Banking Supervision is further increasing its supervisory focus on the coverage of IT audits. It is desirable that all the institutions’ critical IT functions to be assessed by internal IT audit functions (in line with Article 205 of the Guidelines and the national and international professional standards[6]).
1 Technical report on the IT Risk Questionnaire
1.1 ECB Banking Supervision IT and cyber risk
Financial institutions are required to function in a dynamic and digital operating environment in the context of rising customer expectations, constantly changing IT landscapes, banking regulations and technical innovation, while facing evolving IT risks. ECB Banking Supervision has therefore focused on IT and cyber risk since its inception, and is addressing these risks from various angles through ongoing supervision, with the regular assessment of IT-related risks and on-site inspections.
The ongoing supervision is performed by Joint Supervisory Teams (JST) and complies with the EBA Guidelines on IT Risk Assessment under the Supervisory Review and Evaluation Process (SREP)[7]. As part of the annual SREP[8], JSTs perform their assessment of IT and cyber risk following a common and standardised risk assessment methodology. These assessments are complemented by thematic reviews and horizontal analyses on IT risk topics.
Frequent on-site inspections also allow ECB Banking Supervision to assess individual IT and cyber risk management capabilities at the institutions. These inspections are carried out based on a set of common inspection objectives providing insights from a horizontal perspective.
Given the interconnectedness of the financial sector, it is acknowledged that cyber incidents could spread rapidly throughout the entire sector. Therefore, and in order to allow supervisors to identify and monitor trends in cyber incidents in the banking sector more effectively, the ECB cyber incident reporting process was introduced in 2017[9]. All significant institutions from the 19 euro area countries are required to report significant cyber incidents to the ECB[10]. This makes it easier for the ECB to respond quickly if in the event of a major incident affecting one or more institutions.
It is worth noting that the ECB also participates in various international working groups related to IT and cyber risk, such as the EBA Taskforce on IT risk, the Basel Committee on Banking Supervision Operational Resilience Working Group and the Financial Stability Board working group on Cyber Incident Response and Recovery.
This report is structured in two parts. Part I covers the main observations of the annual horizontal analysis and corresponding conclusions. Part II provides a detailed analysis of six different risk areas, including a general description of each risk, the assessment methodology used and individual observations.
1.2 Main observations
In 2018, over 100 IT risk self-assessment questionnaires for the reference year 2017[11] supported a horizontal analysis at group level of the significant supervised institutions. The horizontal analysis did not highlight any particularly clear patterns regarding certain business models or countries. However, it did identify a number of important insights and these allowed the ECB Banking Supervision together with the National Competent Authorities to perform an initial benchmarking exercise across various aspects of IT risk areas.
In general, institutions provided a rather optimistic self-assessment of the IT risk areas. The general overall score in every risk area was “medium, without major incidents identified”. At the same time, the horizontal analysis pointed to indicators of higher risk that led to further investigations by the JSTs. These identified indicators were:
- A significant number of institutions were relying on end-of-life (EOL) systems for their critical processes;
- At the level of individual institutions, an IT outsourcing concentration on single service providers was identified;
- The large majority of critical findings which had not been addressed for more than one year – stemming from all types of investigations – were related to IT security risk.
In 2019, again over 100 IT risk self-assessment questionnaires from significant supervised institutions for the reference year 2018[12] were analysed at group level. Building on the previous years’ experience, a more granular analysis was carried out, including a year-on-year comparison.
Chart 1
Share of institutions taking part in the 2019 ITRQ
(reference year 2018; percentage by business model; y-axis: number of institutions as a percentage of total ITRQ participants)

This year’s analysis shows that institutions seem to have shifted towards a more prudent self-assessment, presenting their risks as adequately under control while acknowledging the inherent risks (risk levels)[13].
Chart 2
Institutions’ average overall risk levels and risk control self-assessment scores
(reference years 2017 and 2018; y-axis: average risk level self-assessment score)
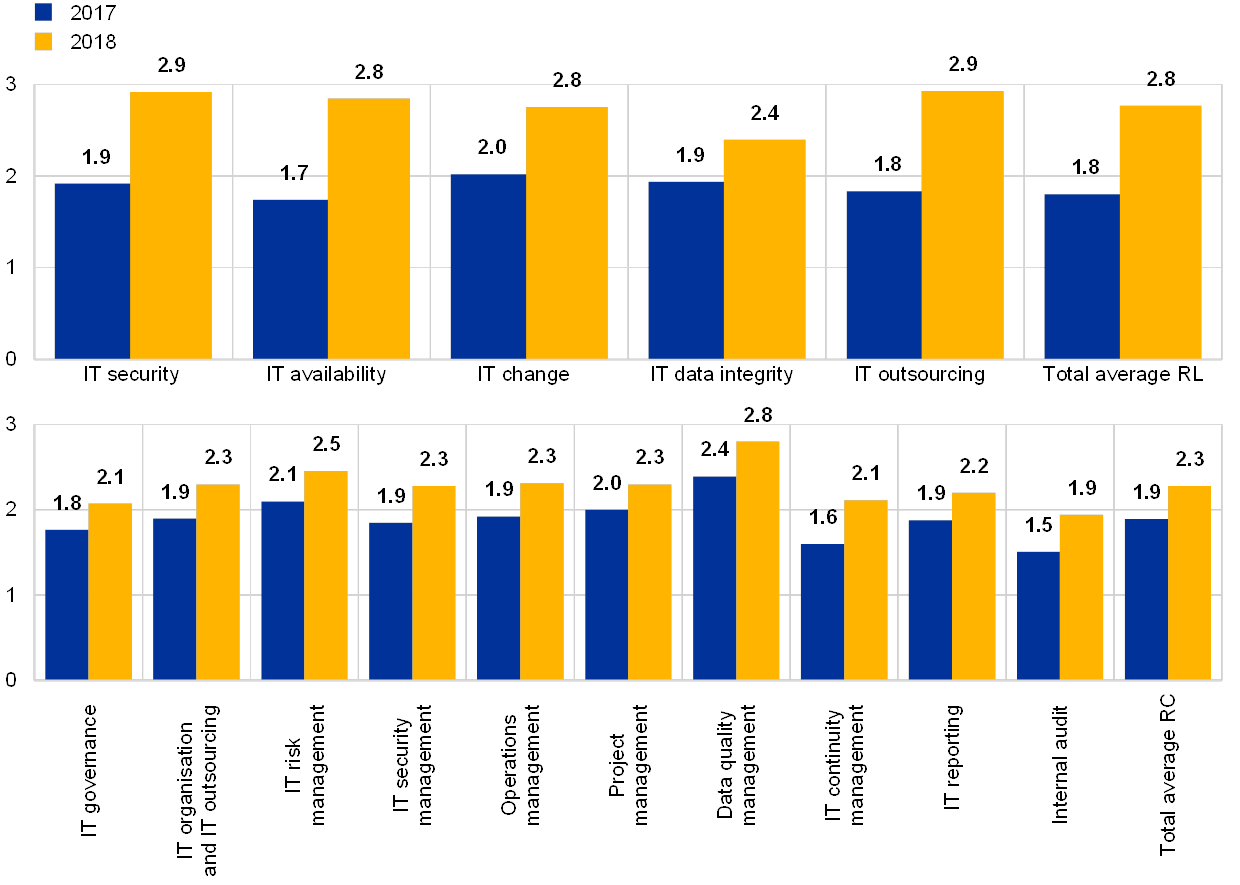
Some of the institutions report that data quality remains a key concern, with a number of cases where data was wrongly submitted to supervisors having already been observed. A number of institutions reported that they do not have adequate risk controls in place, with the weakest areas being “data quality management” and “IT risk management”.
For institutions which have a higher number of board members with IT expertise, this coincides with a number of positive characteristics. These institutions report higher expenditures in terms of IT innovation and a closer monitoring of IT risks. Through their self-assessments – and when compared to banks with fewer number of board members with IT expertise – they report their bank’s IT risk levels and controls more prudently as worse. But they also present themselves as in better control in several IT risk categories including a lower number of successful cyber-attacks and less downtime of critical IT systems.
Chart 3
Average risk control self-assessment scores of institutions with at least 3 board members with IT expertise versus those without
The institution has at least 3 board members with IT expertise
(reference year 2018; y-axis; average risk self-assessment score)
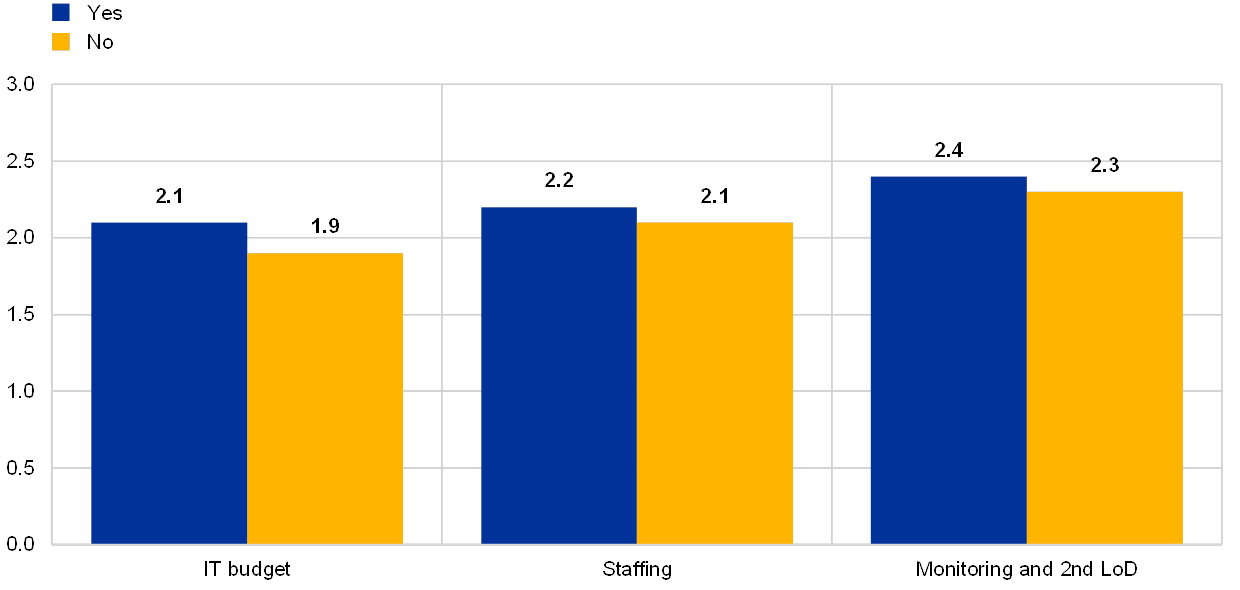
Chart 4
Correlation between the number of board members with IT expertise and the number of successful cyberattacks and overall unplanned downtime of critical IT services
(reference year 2018)
i) the number of successful cyberattacks,
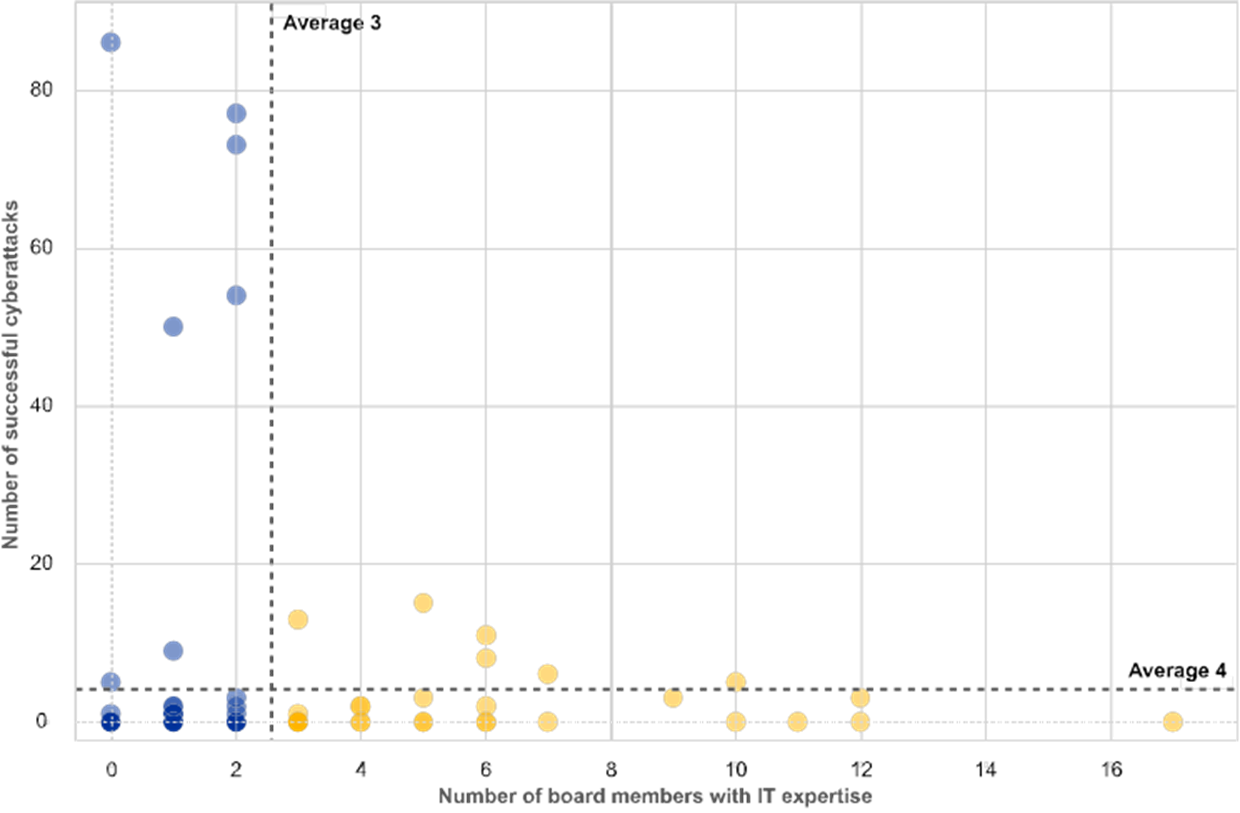
ii) overall unplanned downtime of critical IT services
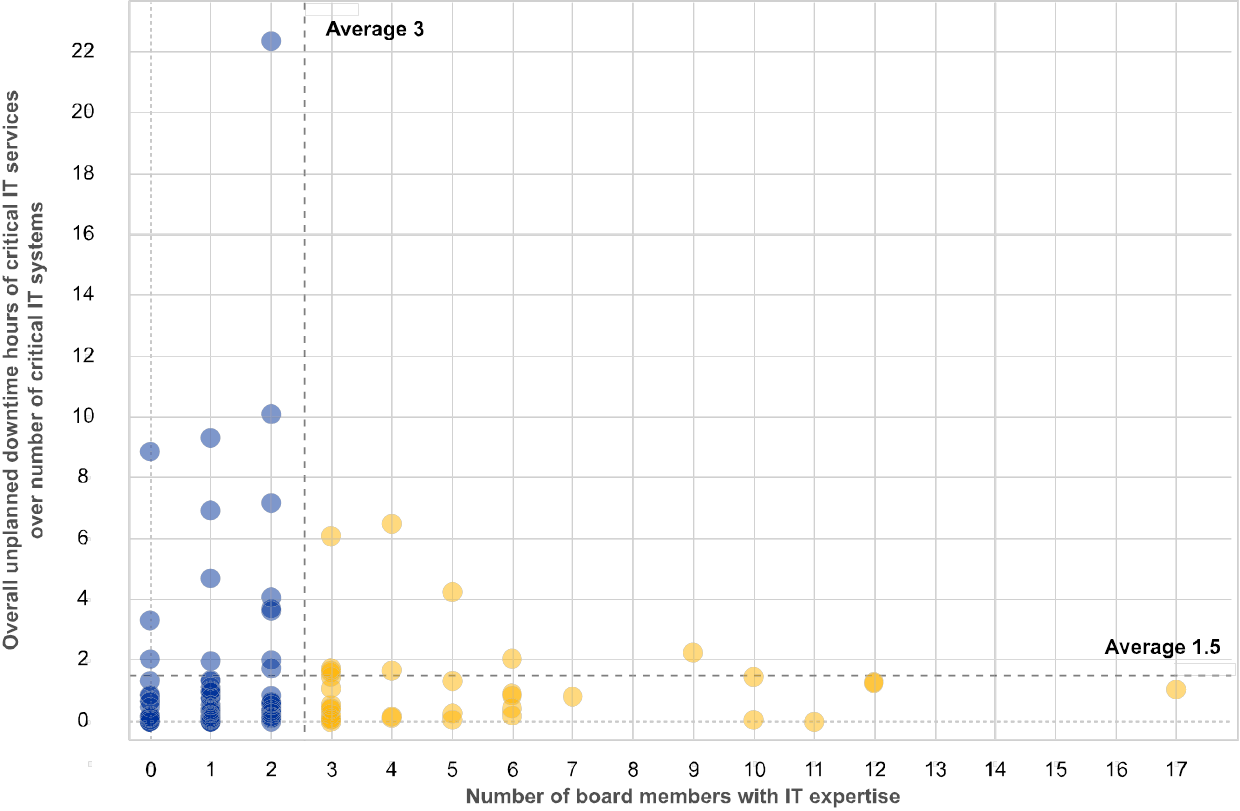
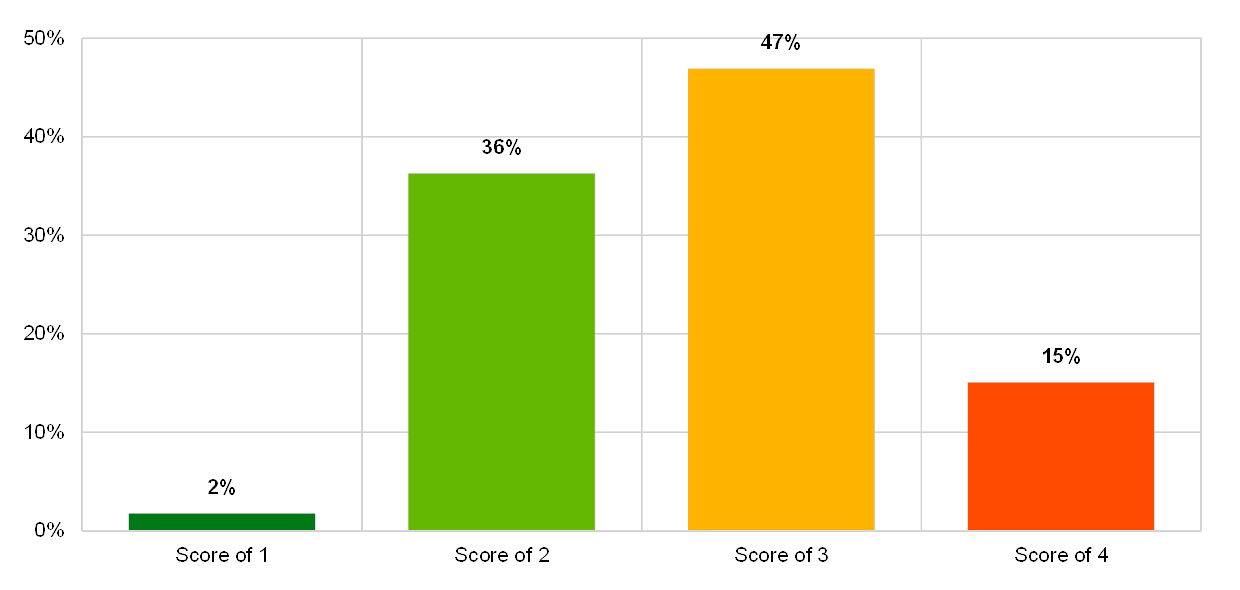
Chart 5
Board member IT expertise in institutions with at least one known case of wrongly submitted data in their supervisory reporting due to IT issues
The institution has at least 3 board members with IT expertise
(reference year 2018; y-axis: percentages)
A few institutions report spending more than 10% of their total annual expenses on IT innovation, while others report very limited investment in IT innovation. The average ratio of IT innovation expenses to total expenses varies across business models, from a minimum of 2% to a maximum of 5%. Furthermore, the institutions report that IT expenses accounted for approximately 21% of total annual expenditure, which is seen as relatively stable when compared to the 20% reported previous year.
However, the top ten institutions, ranked on the amount of their IT expenses, spend an average of 41% of their total expenses on IT, compared with only 7% for the bottom ten institutions. To a large extent, this difference is attributable to different amounts of IT outsourcing. The top expenditures are still broadly aligned with the previous year’s 42%, while the bottom trend has seen a slight increase of 2% from the 5% reported the previous year.
Similarly to the results for the reference year 2017, in 2018 institutions with a complex IT landscape seem to be more exposed to operational incidents which could potentially have a systemic impact, especially when reported by institutions providing critical services to other institutions.
In general, the more complex systems are, the more difficult they are to protect, to control and to change. Institutions that report having “medium to highly complex IT systems” (69%) have on average:
- More losses due to disruptions of critical IT systems;
- More critical projects with significant IT involvement;
- Higher number of successful cyberattacks;
- Higher dependency on EOL systems.
The results for the reference year 2017 had already highlighted that a number of critical business processes are significantly dependent on EOL systems. The results for the reference year 2018 show that the overall presence of EOL systems is increasing, leaving institutions more exposed to possible vulnerabilities. This was also reported for EOL systems supporting critical processes in the institutions. Moreover, some institutions reported deficiencies in the management of end-user computing.
Chart 6
Institutions reporting dependencies on EOL systems, including those supporting critical activities
(reference years 2017 and 2018)
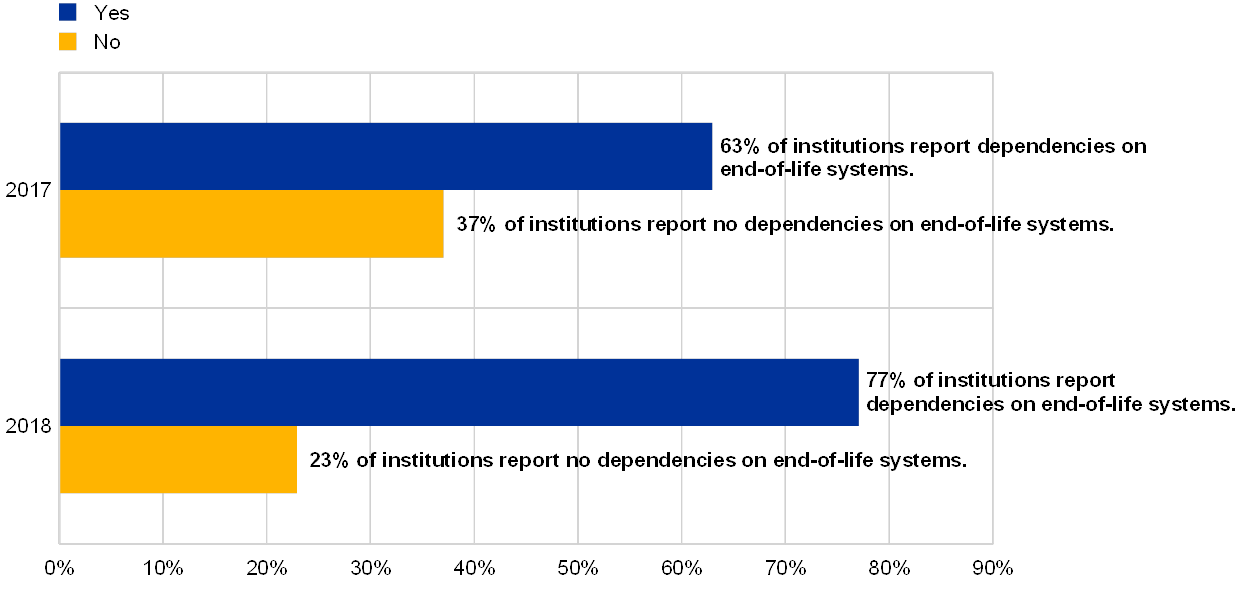
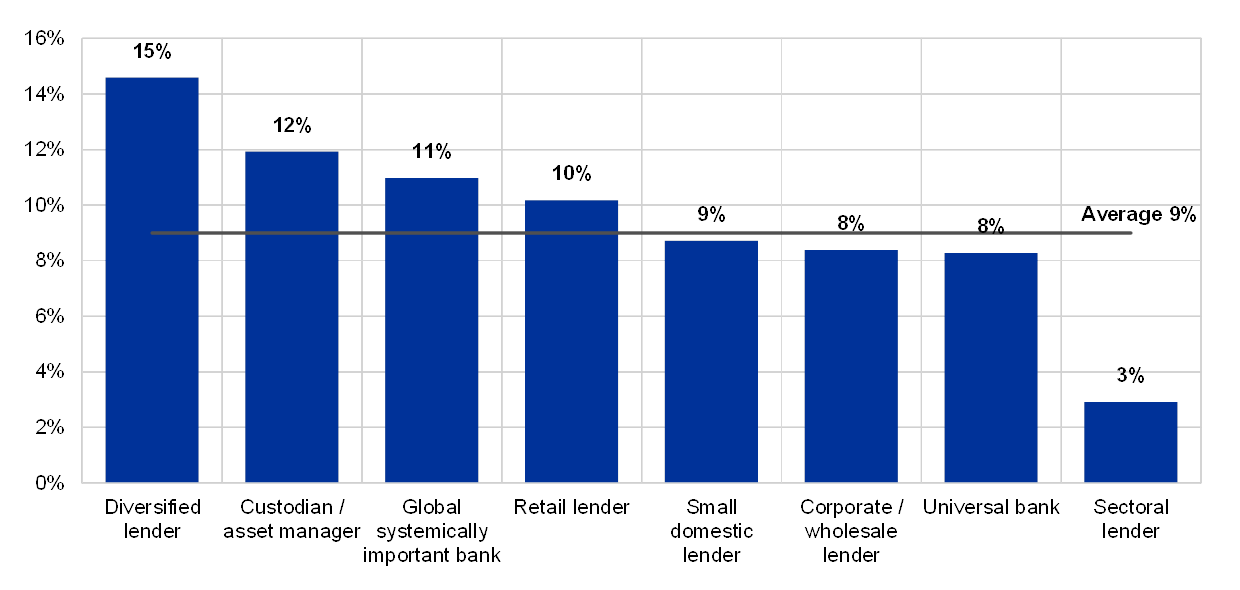
Chart 7
Institutions, grouped by their business model, declaring at least one successful cyberattack and declaring dependencies on EOL systems supporting critical activities
(percentages by business model; reference year 2018; y-axis: percentage of supervised entities having experienced successful cyberattacks during the reference year)

Note: In this chart the business models were anonymized to protect confidentiality of the respondents and generally they refer to the standard business model categories such as Universal banks, Retail lender, Global systematically important bank, Corporate/wholesale lender and Diversified lender (not in the numerical order).
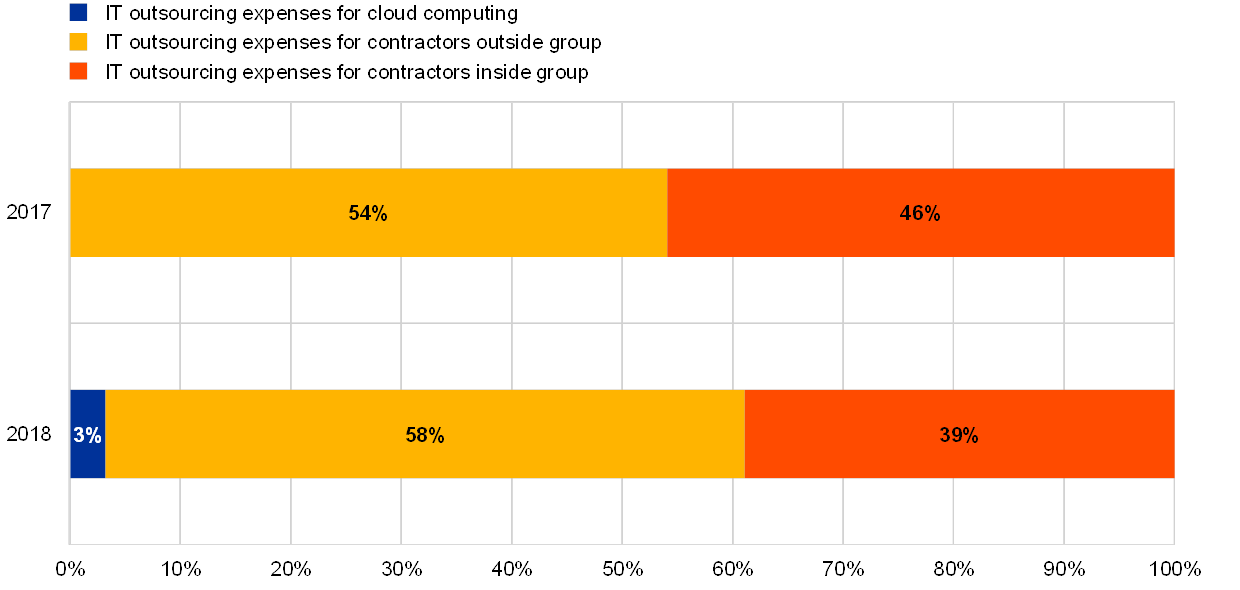
Overall IT outsourcing expenditure has increased by 10% compared with previous year. A large number of institutions continue to show a significant dependency on a single external service provider to which they pay at least half of their reported total IT expenses. Cloud outsourcing is becoming noteworthy, with 3% of the overall IT outsourcing expenditure reportedly spent on cloud outsourcing.
Chart 8
Outsourcing expenditures as reported in the reference years 2017 and 2018
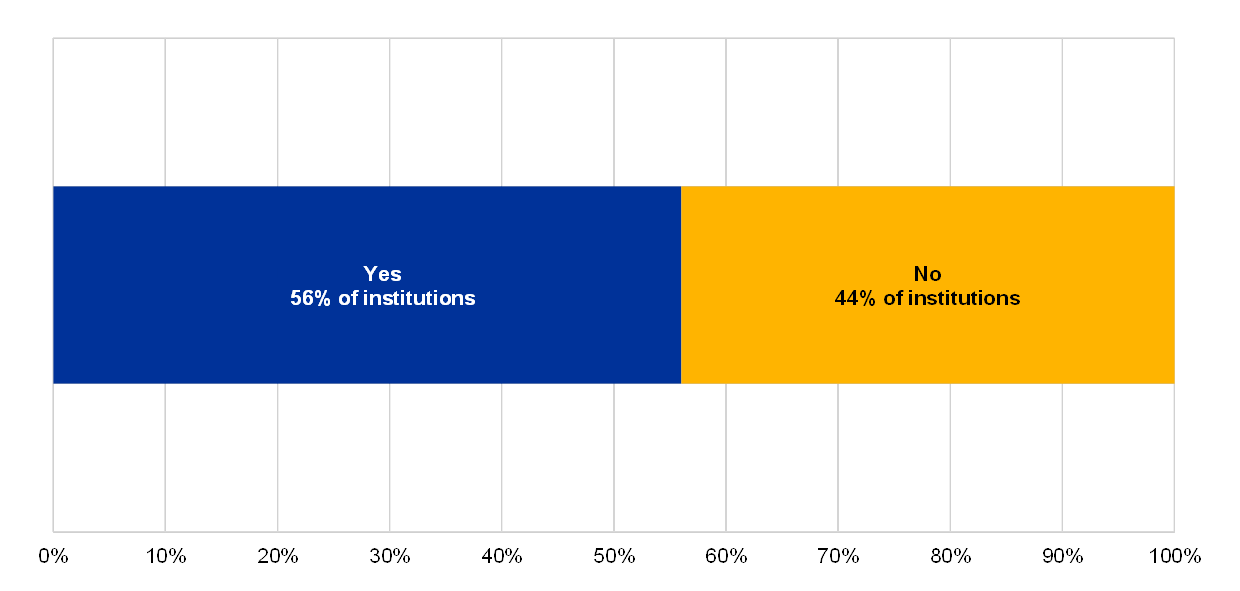
It is important to note that, in general, institutions report a significant improvement in addressing critical findings, although the number of cases remains high. Critical IT findings not addressed for more than one year decreased by 30%, with IT security findings still comprising the majority of cases. However, certain IT areas still have not been fully covered by internal audit reviews in the last three years. Also, institutions that maintain an updated IT asset inventory report having lower outstanding critical IT findings on average.
Chart 9
Percentage of IT functions not assessed in the last 3 years, by business model
(reference year 2018; y-axis: average percentage of IT functions not assessed in the last 3 years)
1.3 Conclusion and key focus areas
Throughout 2019, ECB Banking Supervision has continued to treat IT and cyber risks as a supervisory priority. The recent horizontal analysis reveals a number of observations.
The supervised institutions are seen to have shifted to more prudent self-assessments, but for some IT risk areas they remain too optimistic in their self-assessments. Interestingly, the main shift was reported in areas with high supervisory attention, namely “data quality management” and “IT risk management”. For these risk areas, the reported control scores were the weakest. This is despite the experience of the global financial crisis, which showed that many institutions lacked the ability to correctly aggregate risk exposures and to identify concentration risks quickly and accurately.
Furthermore, the horizontal analysis shows that data integrity risk continues to be of concern, with deficiencies identified in IT data quality management and data architecture models. It is desirable that institutions align their data quality frameworks with the ECB Banking Supervision letter[14] published on Supervisory expectations on risk data aggregation capabilities and risk reporting practices.
With respect to IT security, the horizontal analysis confirmed that IT security continues to be a significant challenge for institutions. It also highlights the need for the institutions to further improve their IT security control measures. The number of reported cyber incidents through the ECB cyber incident reporting framework has increased from year to year. This is also true for incidents with malicious intent. All of this confirms ECB Banking Supervision’s continued focus on IT and cyber risk (ECB Banking Supervision Risk Map for 2020 with a three-year horizon outlook).
From a general point of view, IT and cyber risk should form part of the banks’ general risk governance and management framework, and there should be broad awareness of these risks across the entire organisation. After all, when IT and cyber risks materialise they may have affect the entire company. Likewise, all staff contributes to the mitigation of these risks – across business areas and hierarchies.
Institutions with board members that have IT expertise have reported that they are more aware of the respective IT risks. Through their self-assessments – and when compared to banks with fewer number of board members with IT expertise – they report their bank’s IT risk levels and controls more prudently as worse. But they also present themselves as in better control in several IT risk categories including a lower number of successful cyber-attacks and less downtime of critical IT systems. In addition, these institutions spend more on IT innovation in general. ECB Banking Supervision intends to focus on the collective suitability of the boards with respect to their IT expertise.
A majority of institutions indicated that they have medium to highly complex IT infrastructures with a high number of critical IT systems in both reference years. In addition, the continued reliance on end-of-life (EOL) systems for critical business processes requires a high degree of management attention. Therefore, it is desirable that institutions continue working on simplifying their IT systems and ensuring sufficient agility. ECB Banking Supervision plans to increase its focus on institutions that report having EOL systems supporting critical banking activities, with the aim of decreasing their dependency on EOL systems.
The horizontal analysis showed an increase in IT outsourcing, with a slightly higher concentration of risk at the level of individual institutions. Several institutions have reported losses due to unavailability and/or poor quality of outsourced services. In order to solve such findings it would be desirable that the outsourcing management processes (including risk management) are improved, service level agreements are constantly monitored and that institutions pursue a stricter and more comprehensive inclusion of outsourced processes into their internal control framework. This also includes regularly updating business continuity plans, as well as having adequate exit strategies in place.
In 2019, the EBA published its revised Guidelines on outsourcing arrangements[15], with the aim of establishing a more harmonised framework and integrating recommendations on outsourcing to cloud service providers. The ECB Banking Supervision is placing greater emphasis on outsourcing activities, including cloud outsourcing and its monitoring by the institutions. In line with the EBA Guidelines on outsourcing arrangements, the ECB Banking Supervision expects full compliance with the applicable regulation regarding outsourcing[16] within the respective timeline[17].
Lastly, the institutions reported an improvement in addressing critical findings. The majority of critical findings not addressed for more than a year are related to IT security risk. It would be desirable that all of the institutions’ critical IT functions to be assessed by their internal IT audit functions[18].
It is essential that the institutions align not only with the main IT and cyber risk management principles described in the EBA Guidelines on ICT and security risk management,[19] but also, in the broader context, with expectations on internal governance and outsourcing.
2 Detailed analysis
The IT Risk Questionnaire (ITRQ) is structured according to the five IT risk categories defined by the EBA: IT security risk, IT availability and continuity risk, IT change risk, IT outsourcing risk and IT data integrity risk. The IT risk levels for each of these five risk categories are self-assessed. All scores use the same scale, with “1” being the best mark (low IT risk level) and “4” the worst mark (high IT risk level).
There are also 10 IT risk control categories, split into 35 sub-categories to allow for deeper insight into individual areas. For each of these sub-categories, the institutions are asked to self-assess their IT risk control maturity, with “1” being the best mark (high IT risk control maturity) and “4” the worst mark (low IT risk control maturity). The individual questions in each of the 35 sub-categories are expected to substantiate the risk control self-assessment scores. Building on the experience of the previous year, the ITRQ for the reference year 2019 has been updated in order to provide more specific guidance and clarity on some topics.
In addition, the ITRQ includes general questions about the number of staff in various IT and IT risk functions, various budgets/expenses for IT-related activities, governance of IT-related aspects on the board and in IT audit, and the general IT environment. These questions provide background information so that individual questions about IT risk levels and IT risk control maturity can be better assessed.
Each institution receives a dedicated feedback letter and an individualised comparison of the institution’s results for each IT risk area against the ECB Banking Supervision and business model peers’ averages.
This detailed analysis contains one chapter each about six IT risk areas, five of which are based on the five EBA IT risk categories, with one additional chapter on IT internal audit. This chapter was added to emphasise the importance of an adequate internal governance environment and an effective implementation of the three lines of defence (LoD).
The individual chapters within this report all follow the same structure:
- each chapter starts with a general description of the risk area;
- the second section is related to the assessment methodology;
- this is followed by a presentation of the main observations.
2.1 IT security risk
2.1.1 General description
The definition of IT security risk is directly derived from the EBA Guidelines (EBA/GL/2017/05) which refers to “the risk of unauthorised access to ICT systems and data from within or outside the institution […]”.[20]
According to this definition, IT security risk includes[21]:
- The risk of unauthorised access to IT systems and data from within or outside the institution (e.g. cyberattacks).
- The risk of inadequate internal IT security, which could result in:
- unauthorised access to critical IT systems from within the institution for different purposes and by a variety of techniques;
- unauthorised IT manipulations due to inadequate IT access management procedures and practices;
- security threats due to a lack of security awareness whereby employees fail to understand, neglect or fail to adhere to IT security policies and procedures;
- unauthorised storage or transfer of confidential information outside the institution.
- The risk of inadequate physical IT security, such as the misuse or theft of IT assets via physical access, causing damage; the loss of assets or data; exposure to other threats; and deliberate or accidental damage to physical IT assets caused by terrorism, accidents or unfortunate erroneous manipulations by staff of the institution and/or third parties.
2.1.2 Methodology
The institutions were asked to assess their IT security risk level from a number of different perspectives. The first focus relates to the leakage of sensitive information. Information is considered sensitive when its loss, alteration or destruction has an impact on the institution’s business or compliance with regulation. The institutions were asked to provide (i) the number of external companies with access to internal systems or sensitive data as well as (ii) the number of security incidents that have resulted in a data breach. The second focus relates to the risk of future cyberattacks, taking into account the number of EOL systems that support the institutions’ business-critical processes but also looking into past IT security incidents. A third focus relates to activities taken by institutions to mitigate vulnerabilities. One question asked about the actions taken by the institutions to mitigate the IT security vulnerabilities that were identified through, among other things, penetration tests or vulnerability scannings. Furthermore, institutions were asked to provide the number of findings related to IT security risk, identified in any internal audit and inspection activities, which had not been addressed for more than one year.
In order to assess their IT security risk control, institutions were asked detailed questions related to:
- Information security policies and procedures: to assess whether the controls are documented, approved by the management and supported by appropriate investments in human and technical resources;
- Security reviews: to evaluate whether the controls are carried out regularly by independent parties;
- IT security awareness: to collect information on training sessions and information campaigns for staff;
- Physical security: to understand whether the institutions have implemented adequate physical controls to protect office premises, data centres and sensitive areas;
- Identity and access management: to assess whether the institution has practices in place to ensure access control for systems and data;
- Patch and vulnerability management: to check whether the institution has processes in place to identify vulnerabilities and to regularly update their systems with patches and bug fixes;
- Network security, including remote access: to assess whether the institutions have perimeter defences to protect their IT systems from external intrusion;
- Security event logging and monitoring: to better understand the action taken by the institution in the case of a security event;
- Malware prevention: to assess the institution’s level of protection against malware;
- Data classification: to assess whether sensitive assets are appropriately classified.
2.1.3 Main results and observations
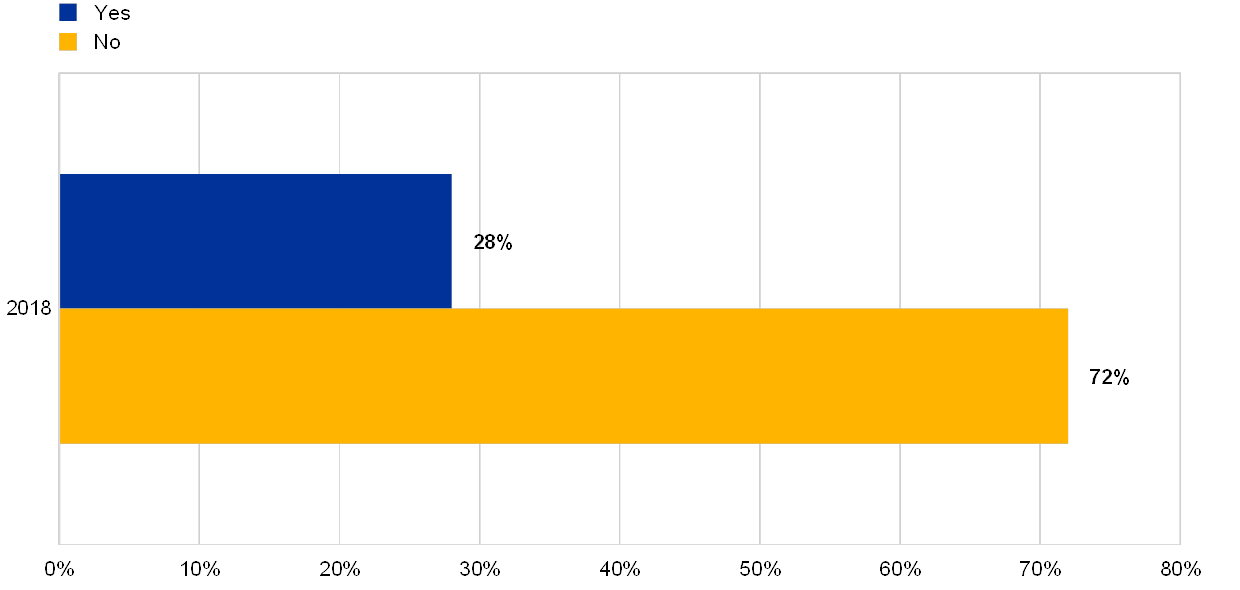
Several institutions reported that they were the target of at least one successful cyberattack in the reference year 2018.
Chart 10
Percentage of banks that reported successful cyber-attacks
(reference year 2018)
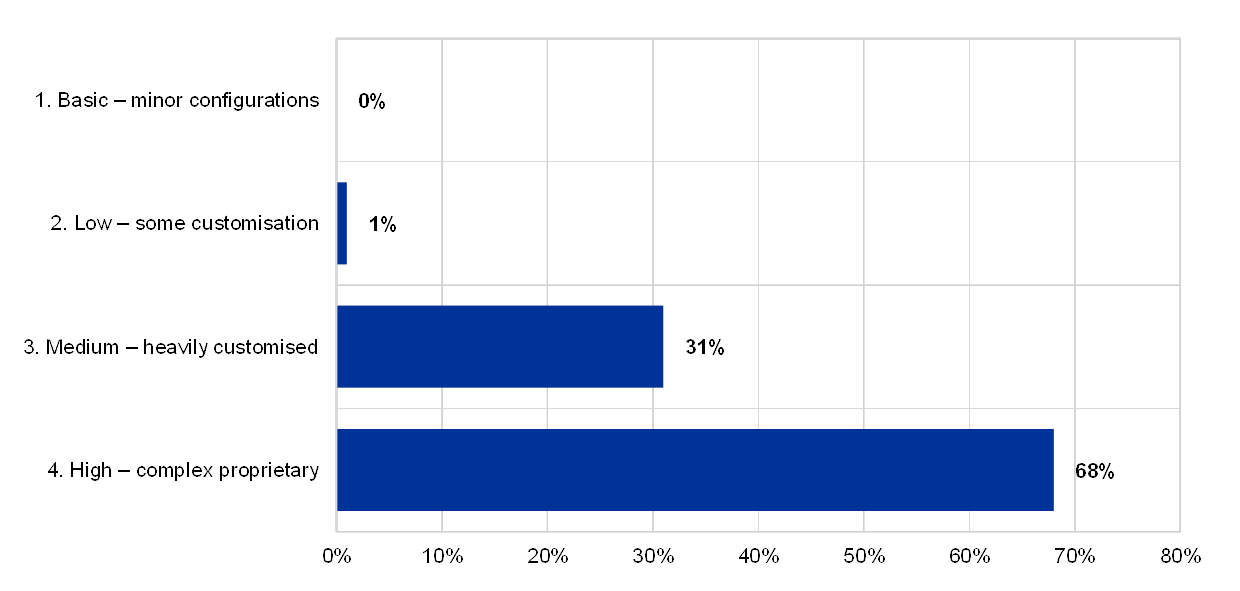
The institutions reporting the highest number of successful cyberattacks also reported themselves as having a complex and proprietary IT system architecture.
Chart 11
Distribution of total number of successful cyberattacks across different levels of IT system complexity
(reference year 2018)
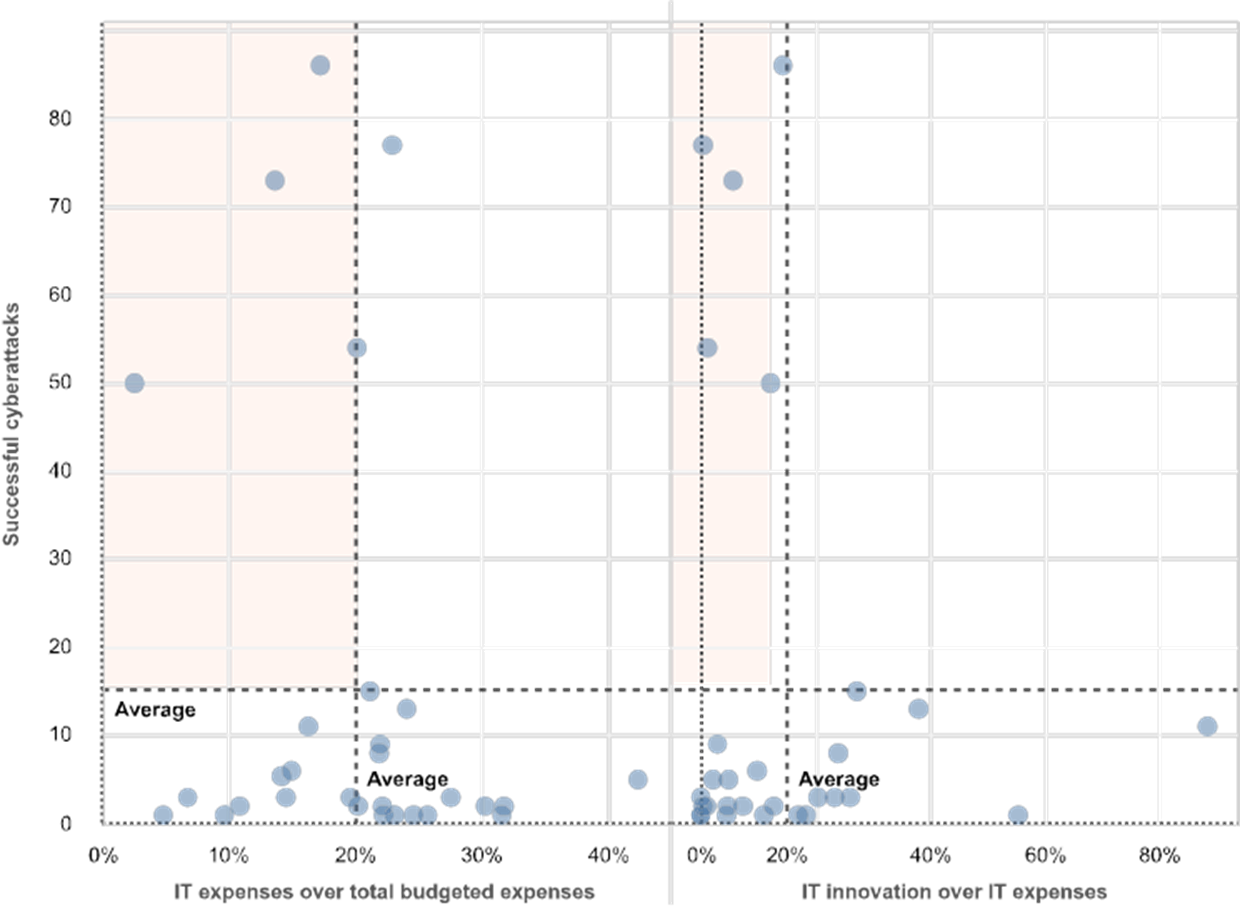
Institutions with the highest number of cyberattacks also reported a below-average ratio of budgeted IT expenses to total expenses.
Chart 12
Successful cyberattacks by institution versus ratios of IT expenses
(reference year 2018; excluding banks with no successful cyberattacks)
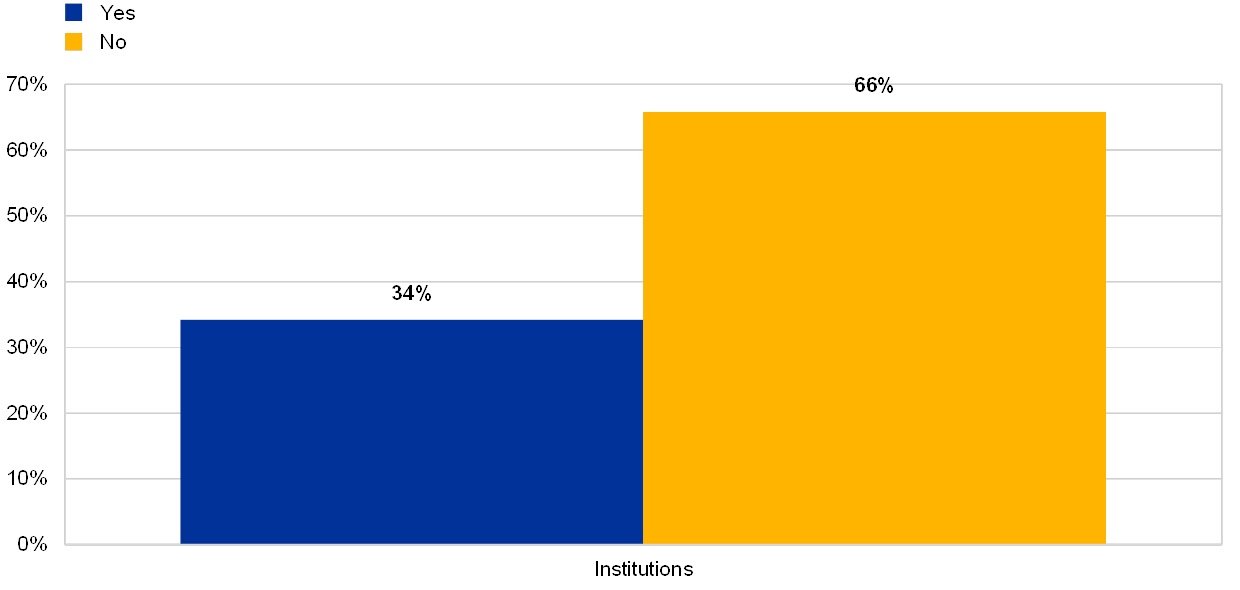
Most of the respondents that suffered at least one successful cyberattack reported a dependency on EOL systems for their business-critical processes.
Chart 13
Institutions, grouped by their business model, declaring at least one successful cyberattack and declaring dependencies on EOL systems supporting critical activities
(percentages by business model; reference year 2018; y-axis: percentage of supervised entities having experienced successful cyberattacks during the reference year)
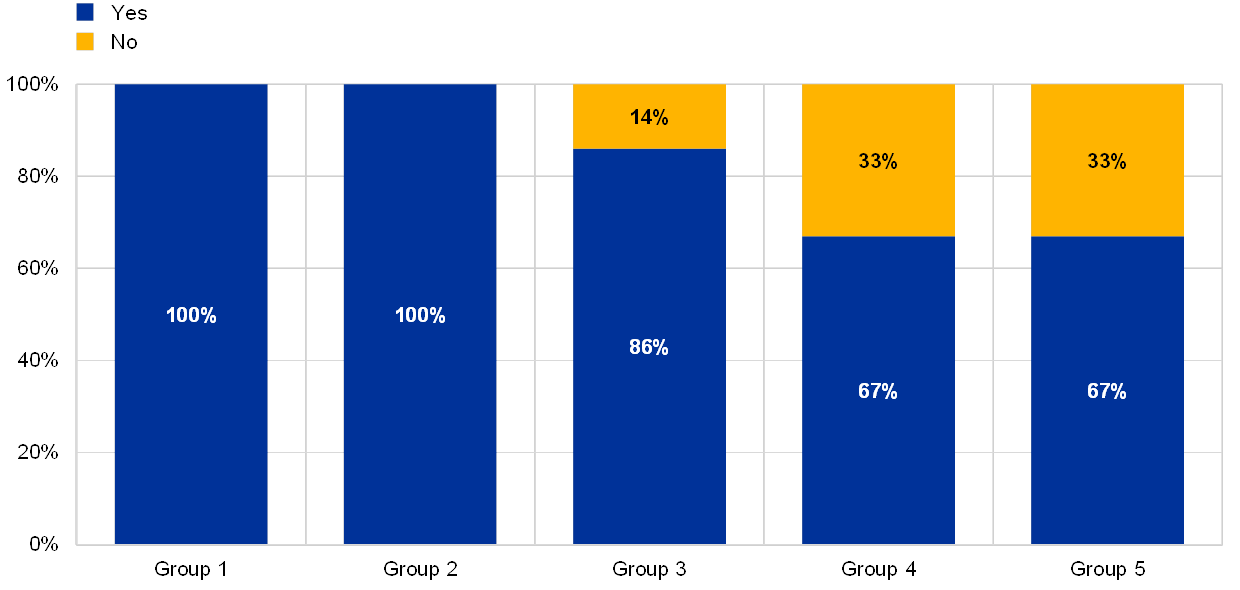
Note: In this chart the business models were anonymized to protect confidentiality of the respondents and generally they refer to the standard business model categories such as Universal banks, Retail lender, Global systematically important bank, Corporate/wholesale lender and Diversified lender (not in the numerical order).
2.1.4 Is the bank depending on EOL systems which are supporting critical activities?
A few of the respondents with at least one EOL system reported that there is room for improvement in their management of existing vulnerabilities.
Chart 14
Management of vulnerabilities among institutions with at least 1 EOL system
Vulnerabilities are identified, centrally documented, analysed, classified or patched
(reference year 2018)
Institutions with boards that have IT expertise tend to assess themselves more prudently.
Chart 15
Average risk control self-assessment scores of institutions with at least 3 board members with IT expertise versus those without
The institution has at least 3 board members with IT expertise
(reference year 2018)

Institutions with the highest ratio of IT innovation budget spent over their overall IT expenses reported (i) a higher number of board members with IT expertise and (ii) that they discuss IT topics at least monthly or quarterly in the Management Board.
Chart 16
Relationship between IT innovation budget (reference year 2018) and
i) number of board members with IT expertise, ii) how often IT is discussed as part of the management board agenda
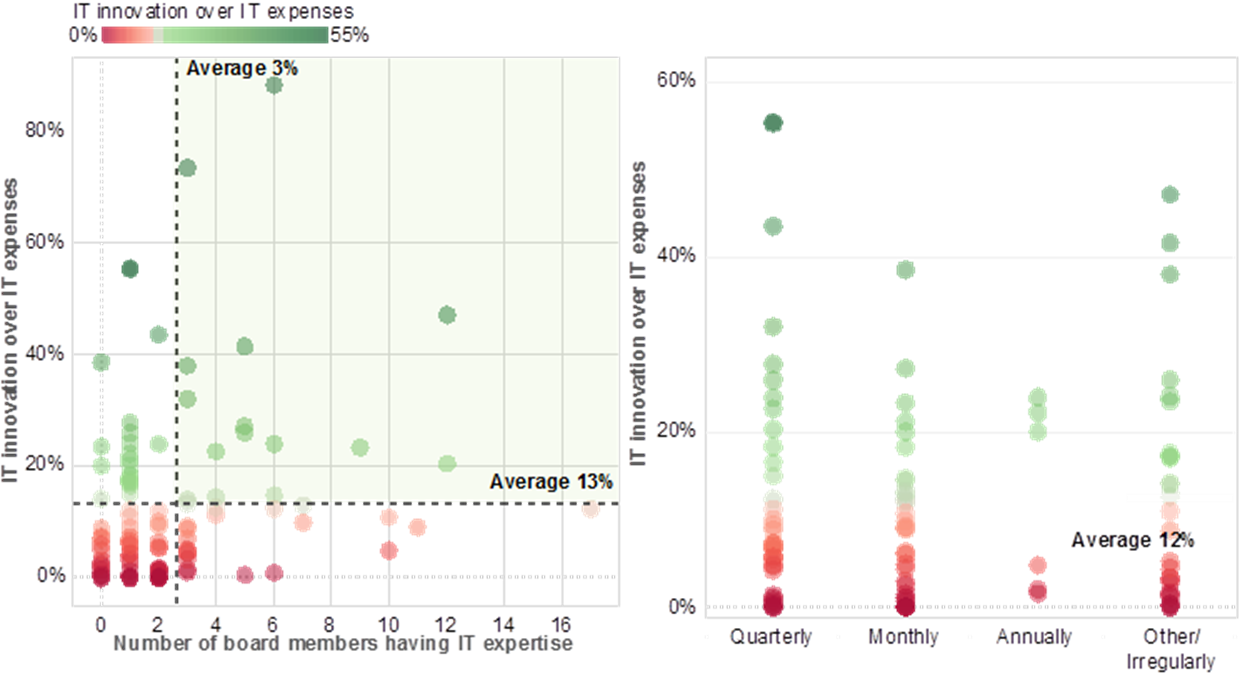
Chart 17
Institutions’ self-assessment scores for the IT risk control “identity and access management”
(reference year 2018; y-axis: percentage of institutions)
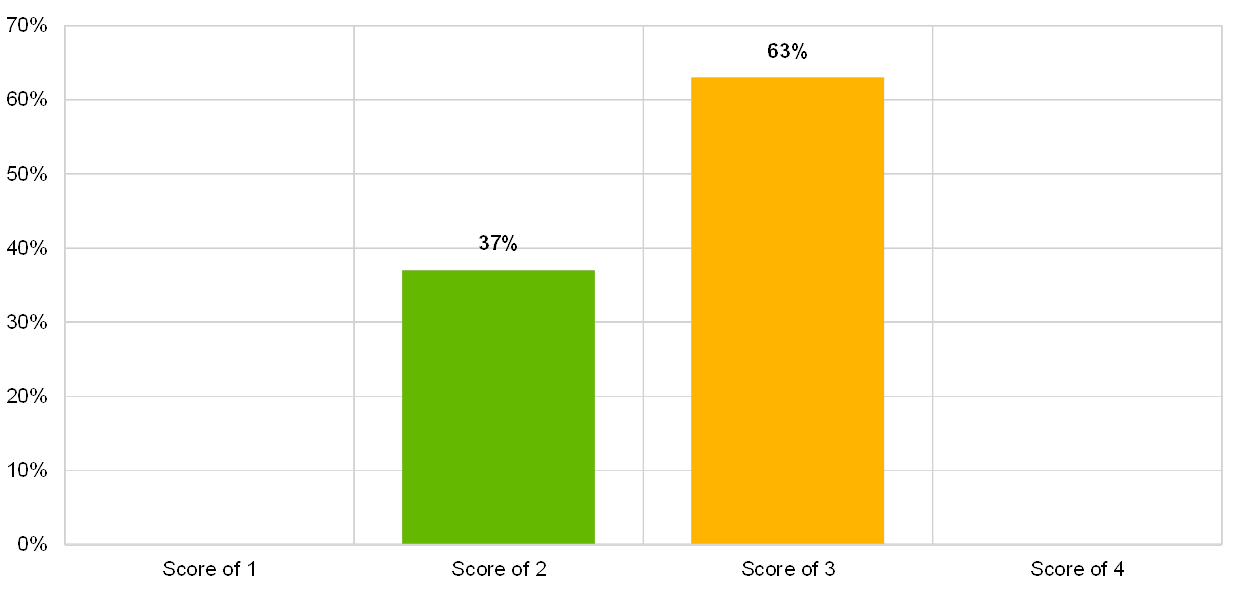
Chart 18
Percentage of institutions which say they implement basic access management principles, among those which reported at least 1 successful cyberattack
Basic access management principles are implemented
(reference year 2018)
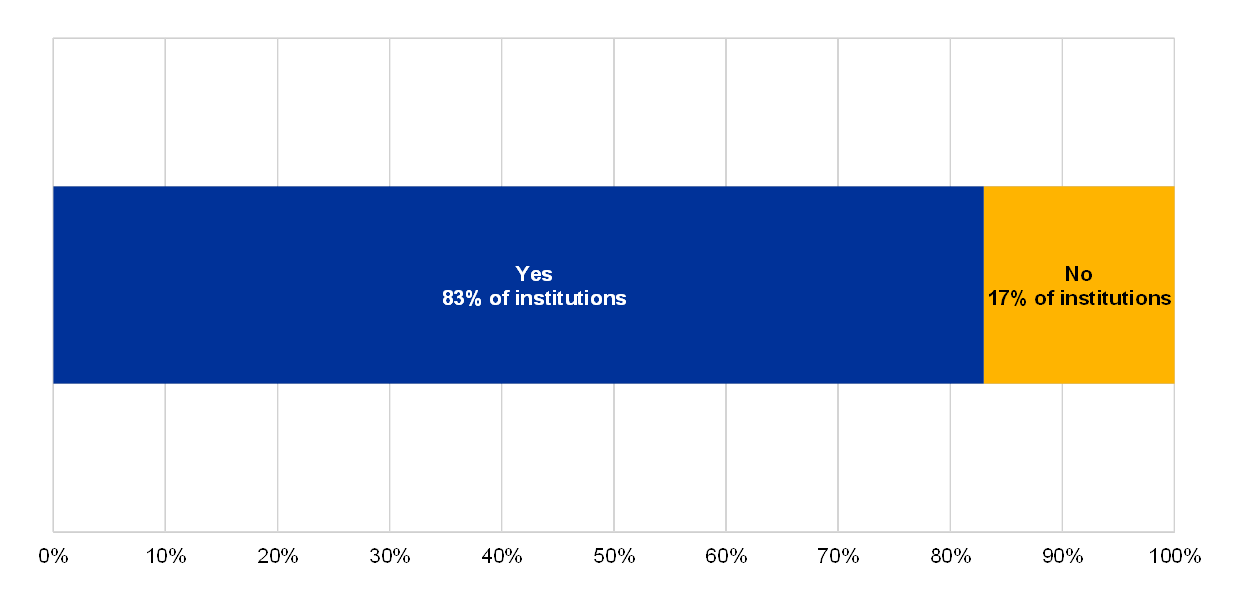
Chart 19
Percentage of institutions which say they have identified their risk profile in the banking sector with regard to cybersecurity, among those which reported at least 1 successful cyberattack
The supervised entity has identified its risk profile in the banking sector with regards to cybersecurity
(reference year 2018)
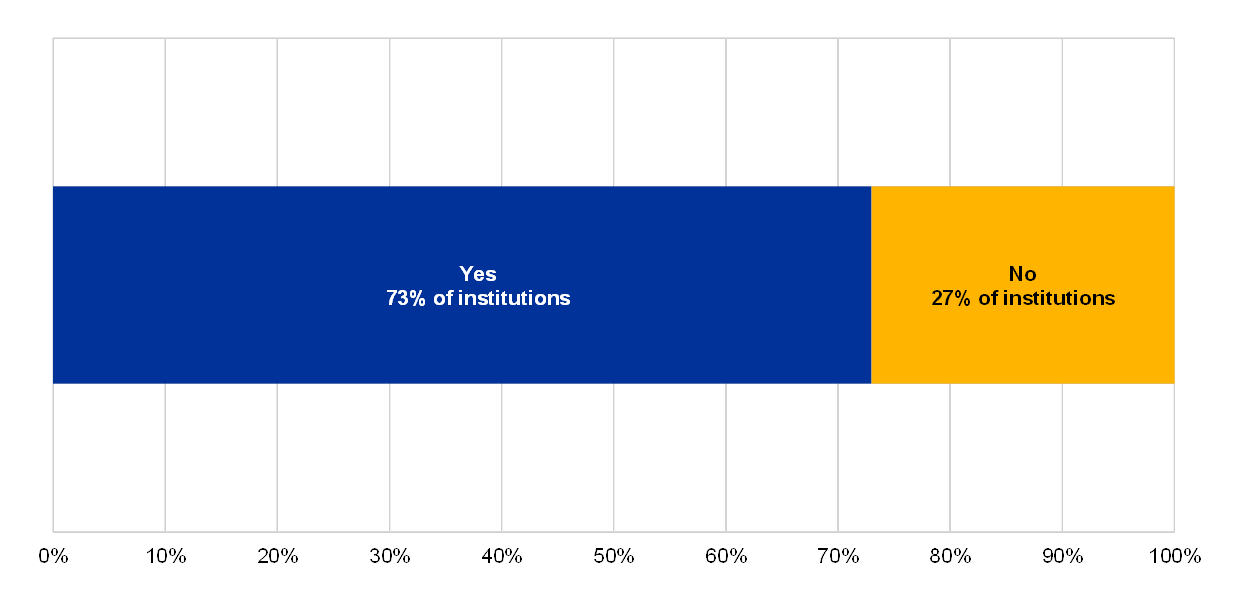
Chart 20
Percentage of institutions which say they have a regularly updated cybersecurity incident response plan, among those which reported at least 1 successful cyberattack
A cybersecurity incident response plan is in place and regularly updated
(reference year 2018)
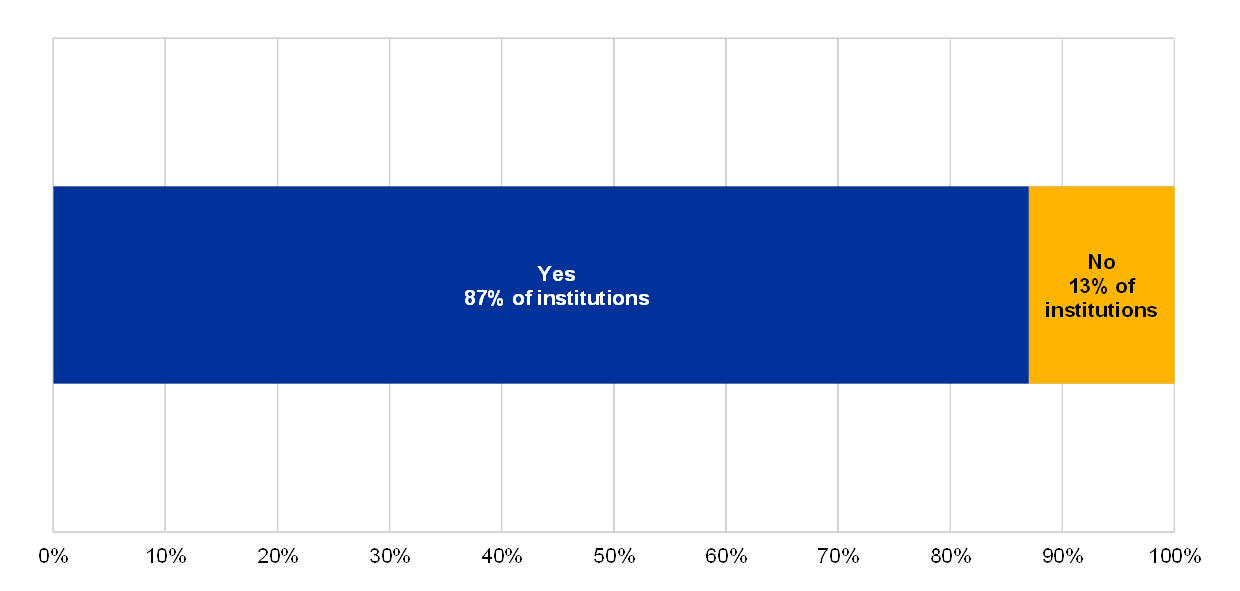
Chart 21
Distribution of risk control maturity scores for the IT risk control topic “security reviews”
(reference year 2018; y-axis: percentage of institutions)
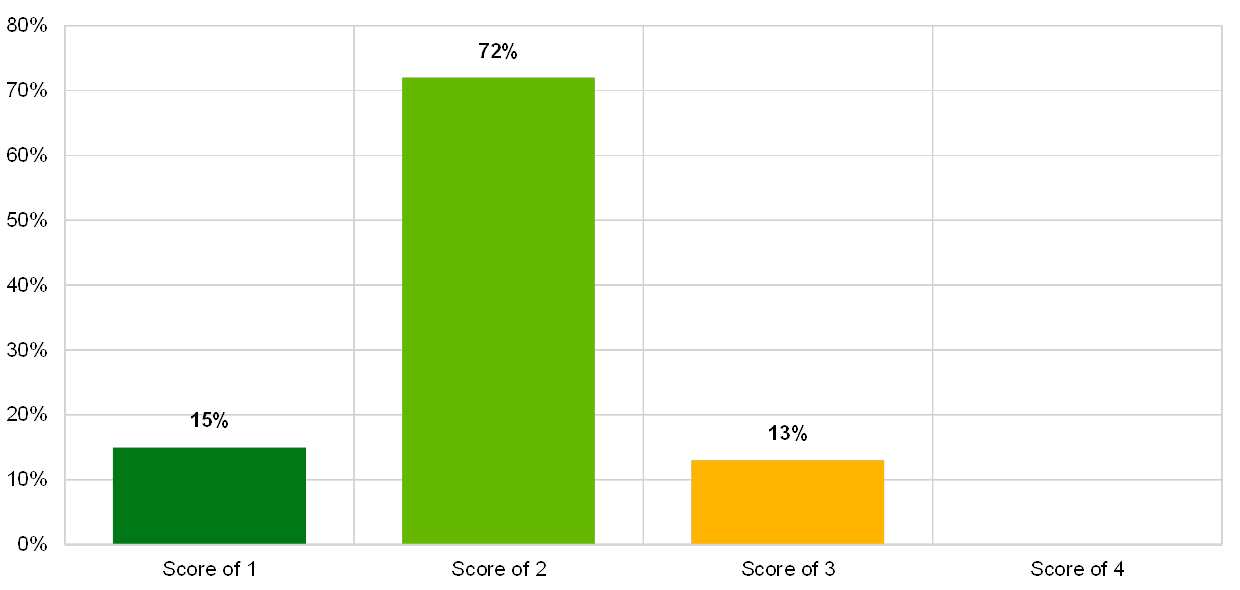
Chart 22
Distribution of risk control maturity scores for the IT risk control topic “IT security awareness”
(reference year 2018; y-axis: percentage of institutions)
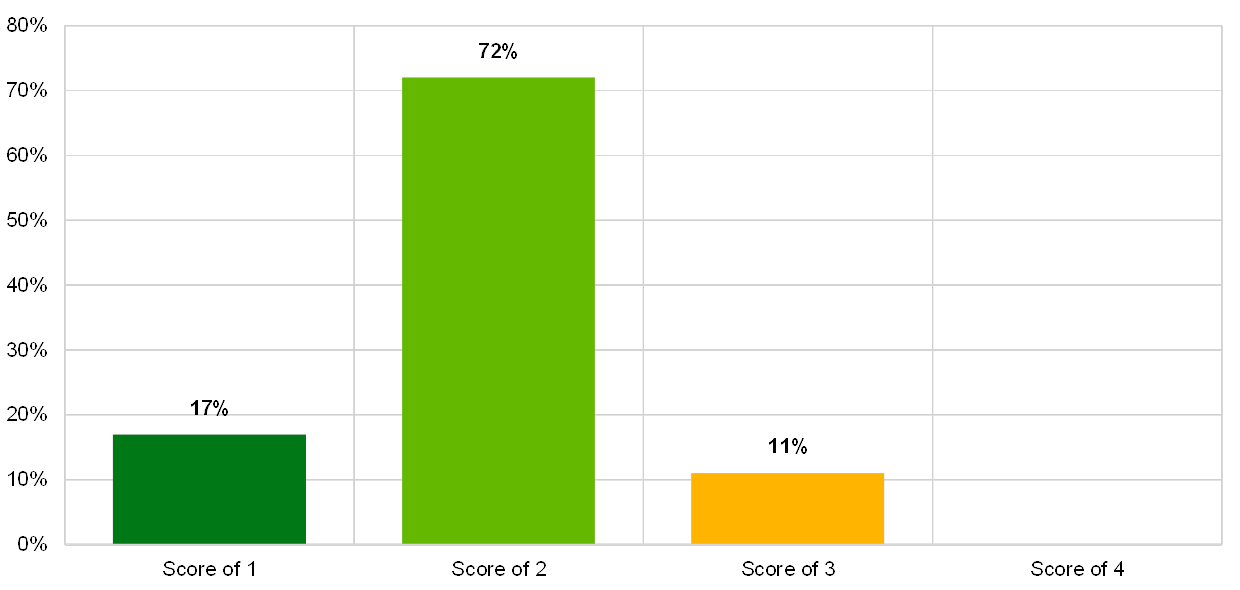
Chart 23
Distribution of risk control maturity scores for the IT risk control topic “IT physical security”
(reference year 2018; y-axis: percentage of institutions)
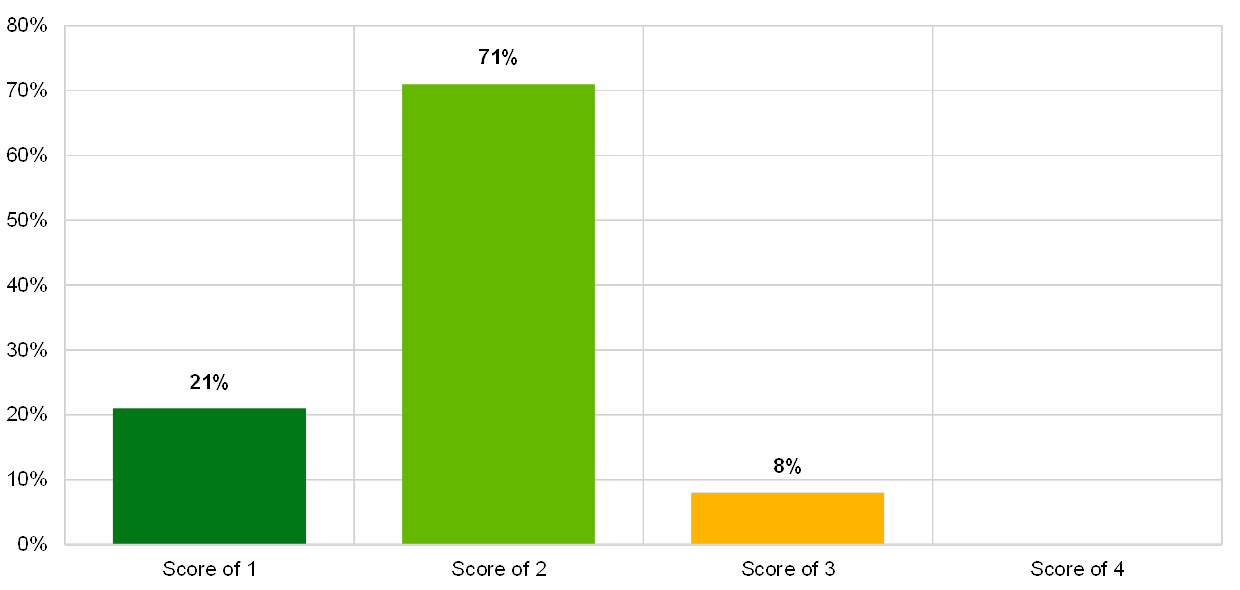
Chart 24
Distribution of risk control maturity scores for the IT risk control topic “data classification”
(reference year 2018; y-axis: percentage of institutions)
2.2 IT availability and continuity risk
2.2.1 General description
The EBA Guidelines (EBA/GL/2017/05) define IT availability and continuity risk as: “the risk that performance and availability of ICT systems and data are adversely impacted, including the inability to timely recover the institution’s services, due to a failure of ICT hardware or software components; weaknesses in ICT system management; or any other event […]”.[22]
2.2.2 Methodology
The institutions’ risk levels for IT availability and continuity risk were assessed across several aspects: locations of business-critical IT operations/data centres, how many times the business continuity planning (BCP) or IT continuity frameworks were triggered, the importance of the banks’ online and mobile presence, and the amount of unplanned downtime.
The effectiveness of an institution’s risk control framework for identifying, understanding, measuring and mitigating IT availability and continuity risk was self-assessed, covering the following aspects:
- Risk analysis, assessment and treatment: to identify an institution’s understanding of its critical activities, its services and its resources, as well as the availability of solutions to restore services in case of IT failure;
- Plans, processes and procedures: to assess whether the continuity and recovery plans are designed, maintained and regularly updated to minimise disruption to an institution's operations, within acceptable limits;
- Technical infrastructure and solutions: to assess whether, at least for its critical activities and services, the institution makes use of sufficiently robust, redundant and secure technical infrastructures and solutions;
- Testing and continuous improvement: to assess whether the institution’s business continuity and disaster recovery solutions work effectively when needed;
- Backups: to better understand and assess whether the institution backs up its IT systems in line with a predefined backup policy, taking into account the applicable regulatory requirements and business recovery requirements, how critical the underlying systems are and the sensitivity of the data;
- Incident and problem management: As the monitoring of incidents is a prerequisite for triggering continuity solutions in a timely manner, this aspect assesses the effectiveness of an institution’s incident and problem management processes.
2.2.3 Main results and observations
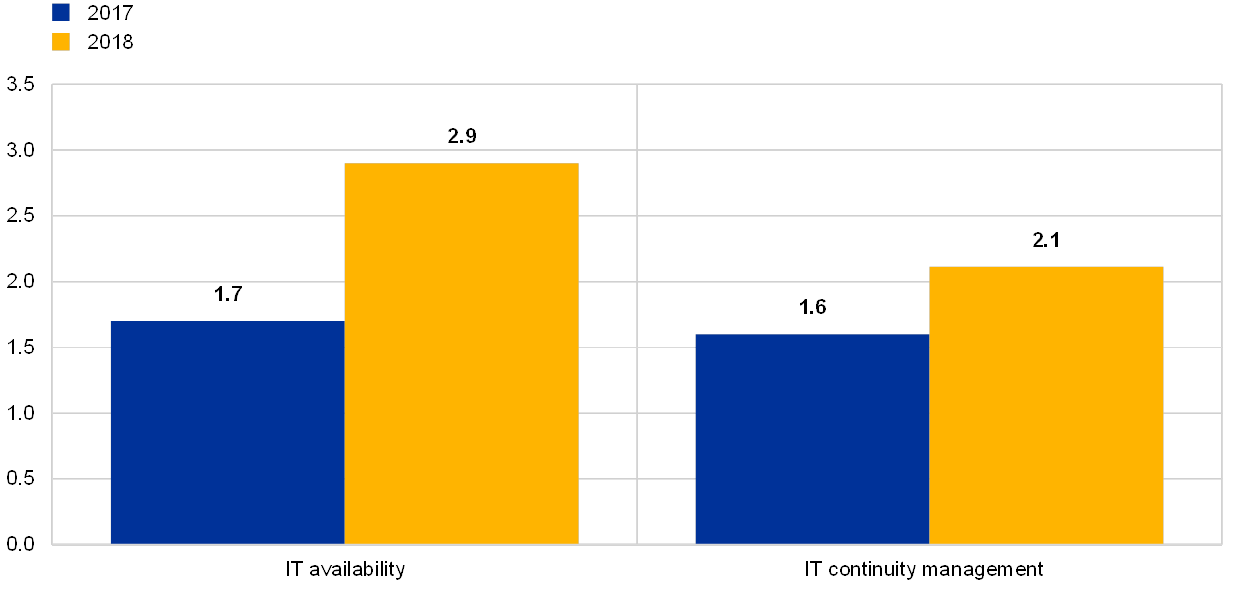
Compared with the previous year (reference year 2017), the institutions seemed to be more prudent in their self-assessment of the maturity level of IT risk controls associated with IT availability and continuity risk.
Chart 25
Change in the average overall risk level (“IT availability”) and risk control (“IT continuity management”) self-assessment scores
(reference years 2017 and 2018; y-axis: average bank's risk control self-assessment score)
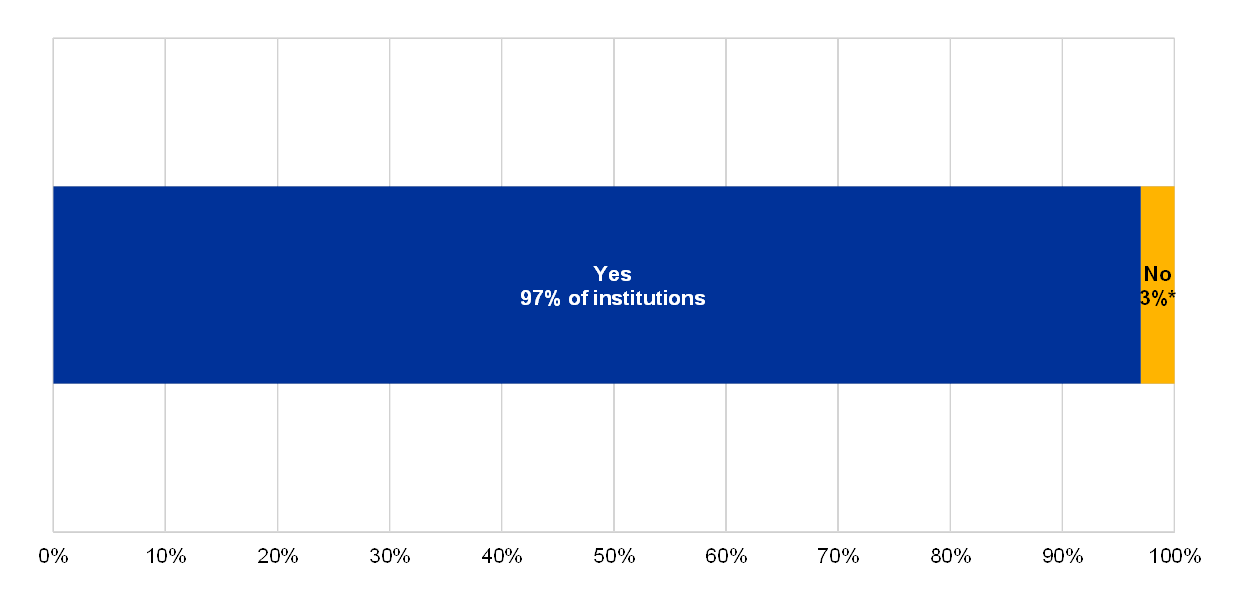
Institutions report having implemented effective measures of prevention, mitigation and correction.
Chart 26
Percentage of institutions with a formally documented process for analysing, approving and treating IT continuity risks
The institution has a formally documented process for analysing, approving and treating IT continuity risks in place
(reference year 2018)
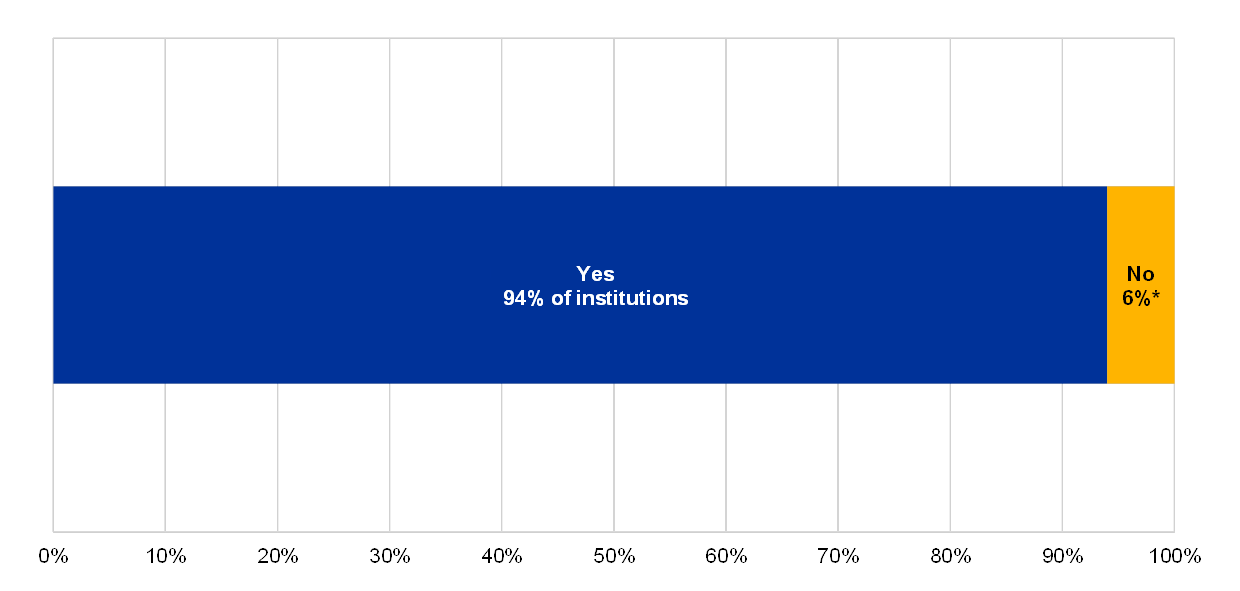
* of institutions.
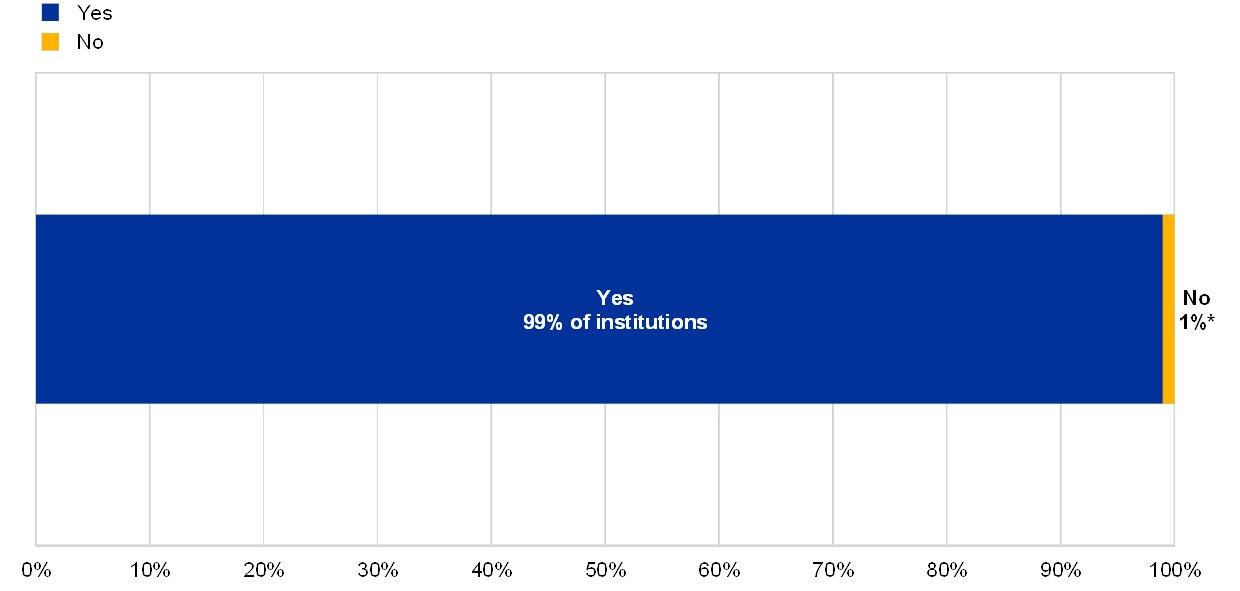
Chart 27
Percentage of institutions with appropriate crisis management framework and IT continuity plans
The institution has an appropriately documented crisis management framework in place and regularly reviews IT continuity plans, processes and procedures
(reference year 2018)

Nearly all of the institutions have had unplanned downtime occurring on critical IT systems with a visible impact on customer services. Also, in many cases, downtime happened in institutions that provide critical services to other institutions.
Chart 28
IT architecture complexity and extent of customisation versus unplanned downtime of critical services and material customer services
(reference year 2018; y-axis: logarithmic hours)

Chart 29
Comparison of critical IT systems risks between institutions which have/have not had mergers or acquisitions in the reference year 2018
Have there been mergers or acquisitions affecting the IT landscape?
(value for losses in EUR thousands)
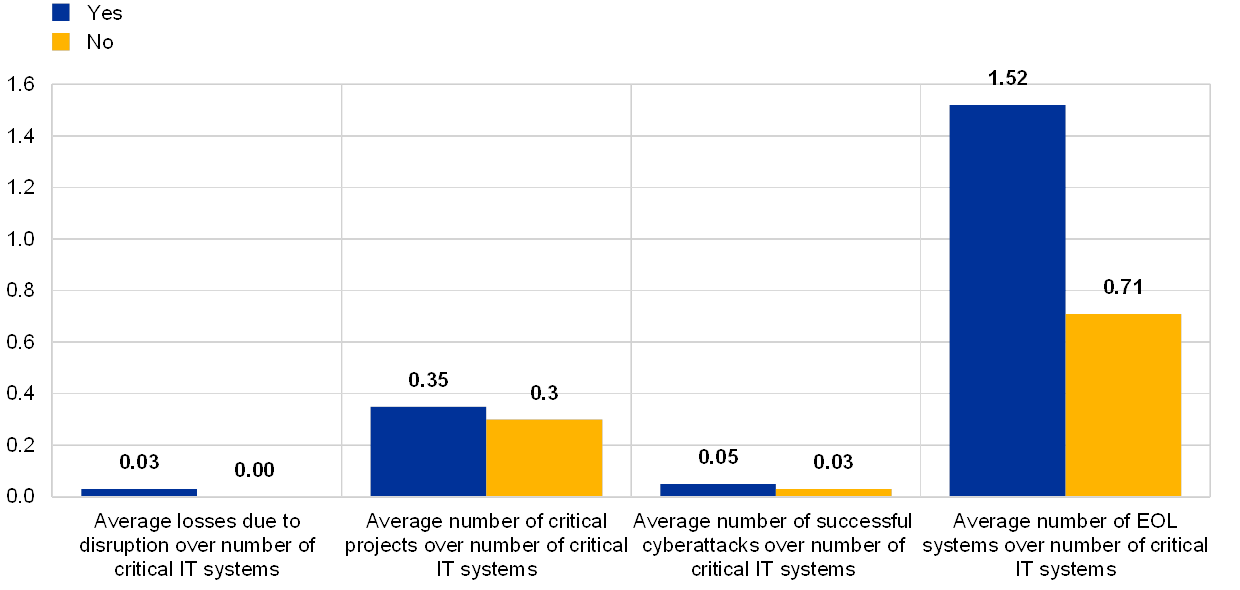
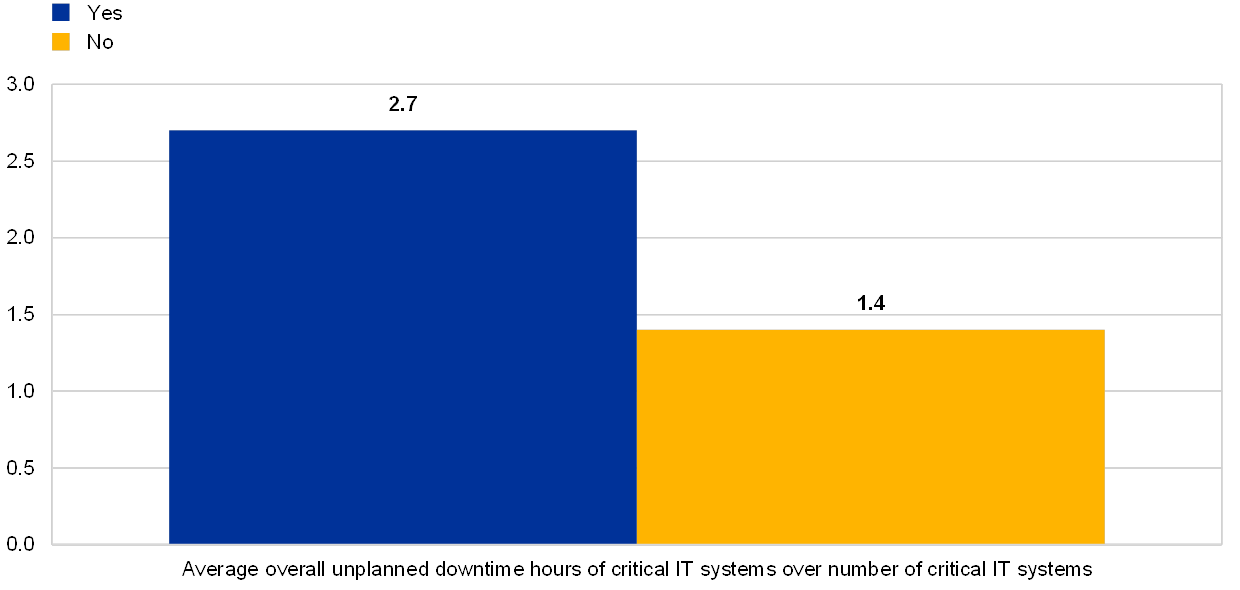
Chart 30
Average overall unplanned downtime of critical IT systems over number of critical IT systems for institutions which do/do not provide critical services to other institutions
Do the institutions provide critical services to other institutions where a disruption could potentially impact the financial sector?
(reference year 2018)
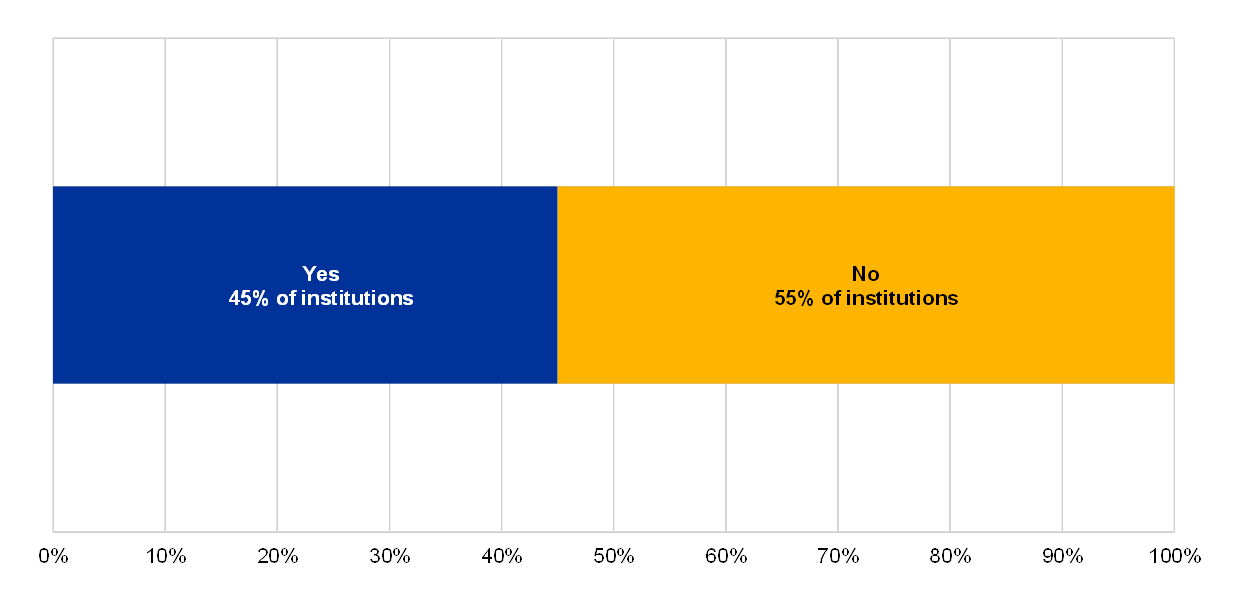
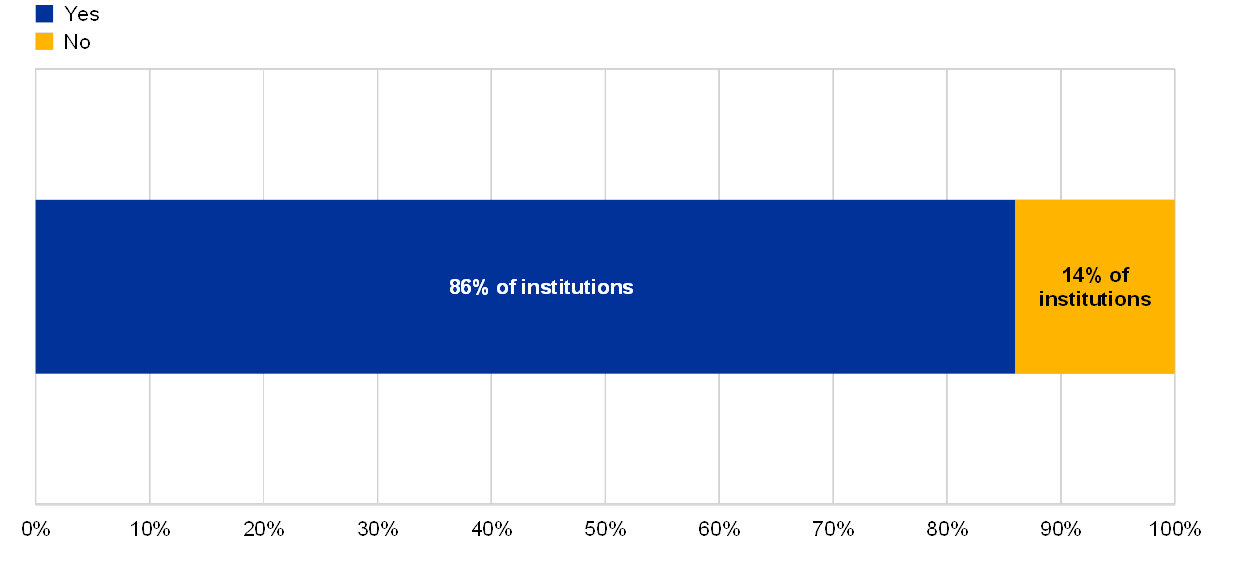
In the reference year 2018, 45% of the institutions reported that they had to activate a continuity solution at least once.
Chart 31
Percentage of institutions which have triggered their BCP or IT continuity frameworks at least once during the reference year (2018)
Have the BCP or IT continuity frameworks been triggered?
(reference year 2018)
A year-on-year comparison shows a 32% increase of overall downtime in critical IT systems, whilst the overall unplanned downtime of material customer services decreased by 27%.
Chart 32
Total overall unplanned downtime of material customer services and critical IT systems
(reference years 2017 and 2018; x-axis: number of hours)
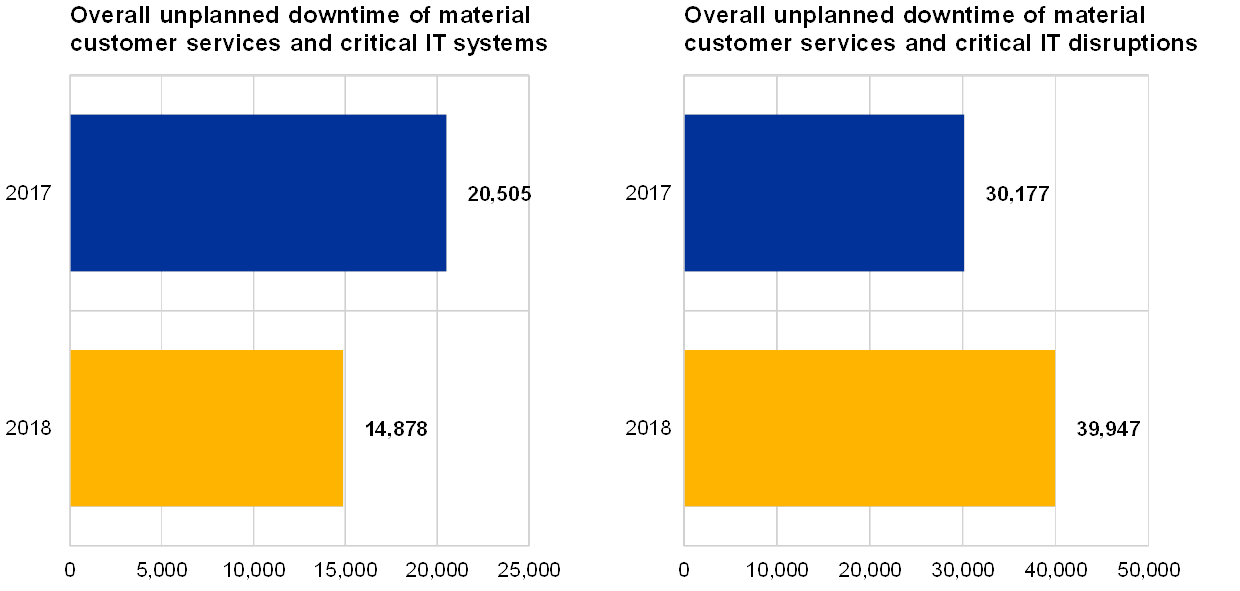
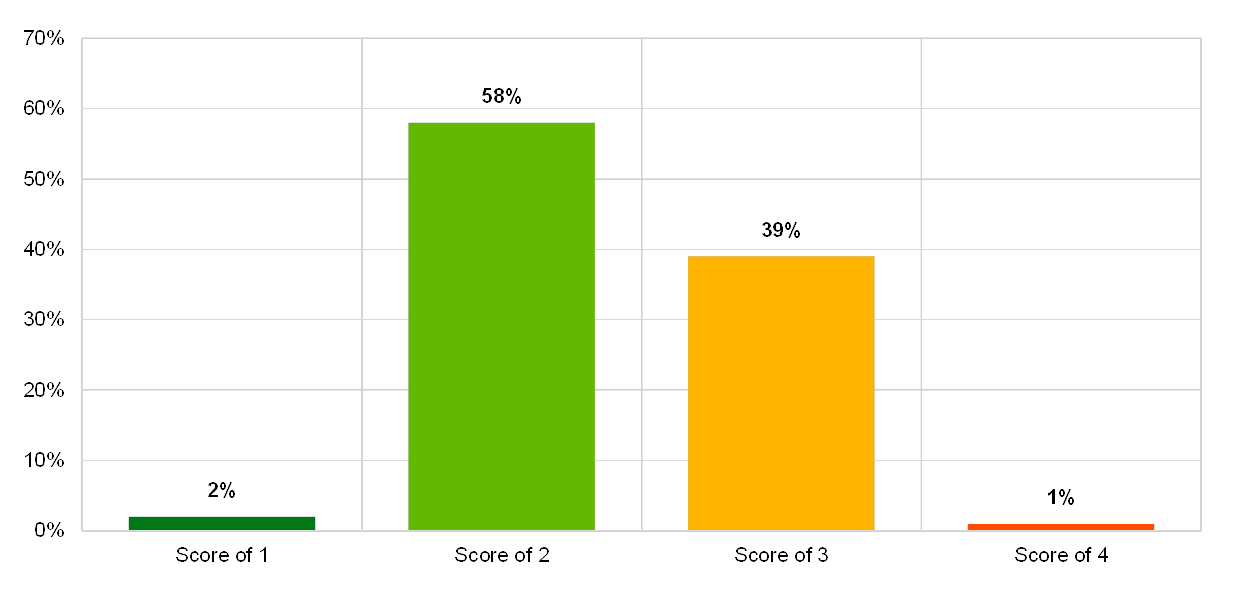
Chart 33
Institutions’ self-assessment scores for risk analysis, assessment and treatment in the IT risk control category “continuity management”
(reference year 2018; y-axis: percentage of institutions)
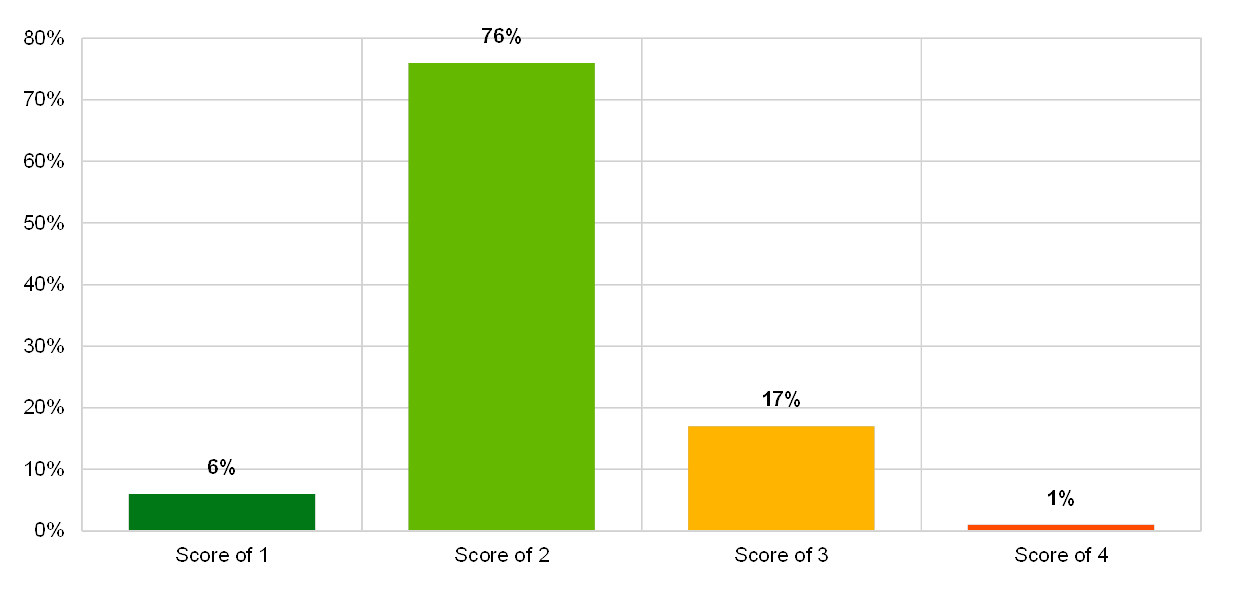
Chart 34
Institutions’ self-assessment scores for plans, processes and procedures in the IT risk control category “continuity management”
(reference year 2018; y-axis: percentage of institutions)
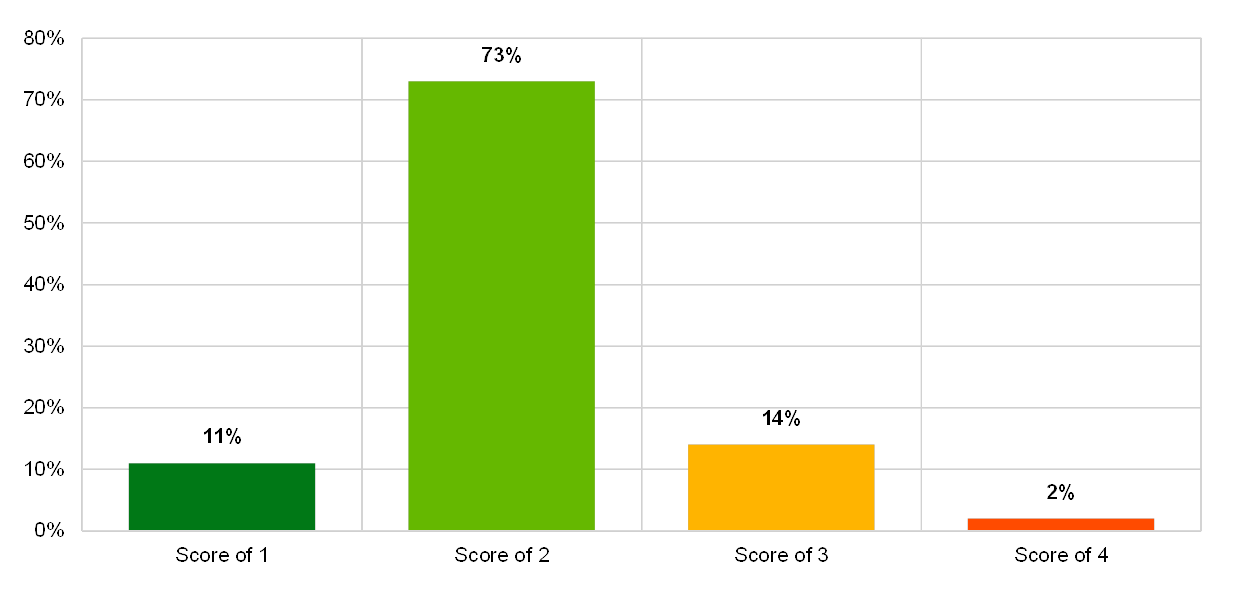
Chart 35
Institutions’ self-assessment scores for technical infrastructure and solutions in the IT risk control category “continuity management”
(reference year 2018; y-axis: percentage of institutions)
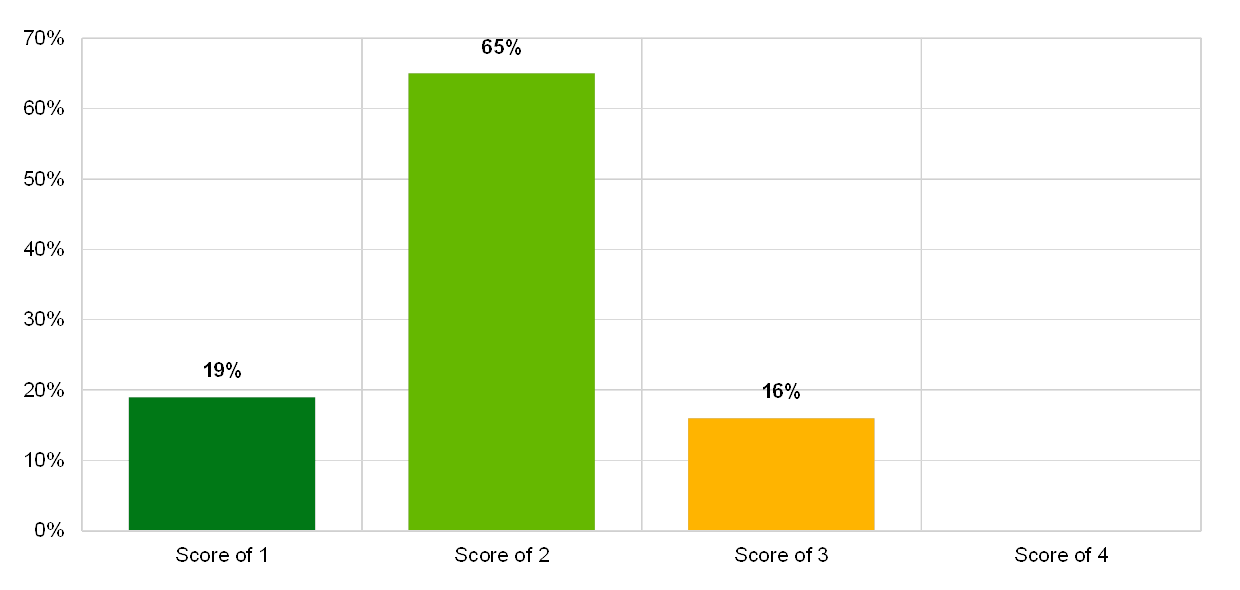
Chart 36
Institutions’ self-assessment scores for testing and continuous improvements in the IT risk control category “continuity management”
(reference year 2018; y-axis: percentage of institutions)
2.3 IT change risk
2.3.1 General description
The definition of IT change risk in the ITRQ is directly derived from the EBA Guidelines (EBA/GL/2017/05): “the risk arising from the inability of the institution to manage ICT system changes in a timely and controlled manner, in particular for large and complex change programmes […]”.[23]
In practice, IT change risk refers to the complexity of IT architecture which is no longer sufficiently aligned with the needs of the business and which falls short of actual risk management requirements. It also refers to the uncontrolled release of software/IT systems/hardware (new versions or patches) in production, the inadequacy of IT solution life cycles for designing, building and maintaining IT systems (software, hardware or data), and inadequate patch management (of business software and IT systems) which leads to outdated or vulnerable IT systems.
The institutions’ IT environments may have a direct impact on their IT change risk level. In particular, major organisational changes, such as mergers, acquisitions and carve-outs which lead to merging or splitting the IT landscape, as well as the number of critical projects with significant IT undertakings, have a large impact on the risk level.
2.3.2 Methodology
Within the ITRQ, the overall assessment of risk levels for IT change risk is based on the frequency of changes to critical IT systems (from low to high frequency). Five indicators were used for the assessment: the complexity of the IT architecture, the number of critical IT environments, the number of changes in critical IT environments, the number of changes that have caused issues in the production environment and the number of findings related to IT change risk that have not been addressed for more than one year.
The effectiveness of the risk control framework for identifying, understanding, measuring and mitigating IT change risk was self-assessed through two sets of questions related to:
- Change and release management (in the IT operation management): refers to processes which aim at implementing, deploying or migrating changes into a production environment. These may be software deployments that result from IT projects and that are developed or acquired via the IT solutions lifecycle, or the implementation in a production environment of any IT components which are part of the IT systems, such as hardware, technical software, IT security component rules, configuration parameters, patches, bug fixes, etc.
- Project management framework, governance and IT solutions life cycle, also in software acquisition, software development and project management, referring to overall processes such as the design and maintenance of IT solutions, including the alignment of IT projects with the institution’s strategy.
The ECB Banking Supervision focuses on critical systems, which means IT systems and services that fulfil at least one of the following conditions:
- Supports the core business operations and distribution channels (e.g. automated teller machines (ATMs), internet and mobile banking).
- Supports essential governance processes and corporate functions, including risk management and treasury management systems.
- Falls under special legal or regulatory obligations (if any) that impose heightened availability, resilience, confidentiality or security requirements. These can include data protection measures, maximum period of unavailability and maximum data loss.
- Processes or stores sensitive data (e.g. customer data) to which unauthorised access could significantly impact the institution’s soundness and continuity of business, reputation or financial results.
- Provides baseline functionalities that are vital for the adequate functioning of the institutions (e.g. telecom and connectivity services, IT and cyber security services).
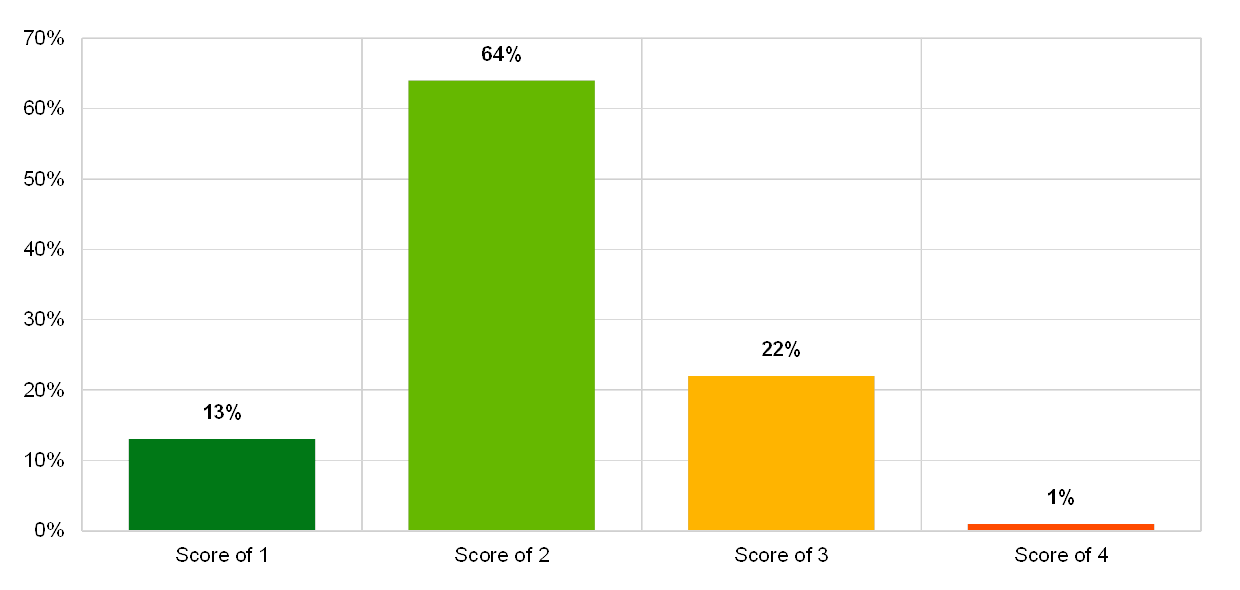
2.3.3 Main results and observations
An analysis was performed based on information related to the number of IT systems and number of IT changes, as reported in the ITRQ.
Chart 37
Institutions’ overall self-assessment scores for the IT risk level category “IT change risk”
(reference year 2018; y-axis: percentage of institutions)
In general, the largest institutions reported the highest numbers of implemented changes to their critical IT systems.
Chart 38
Relative number of changes in critical IT environments across business models
(reference year 2018; y-axis: number of changes as a percentage of total changes in critical IT environments)
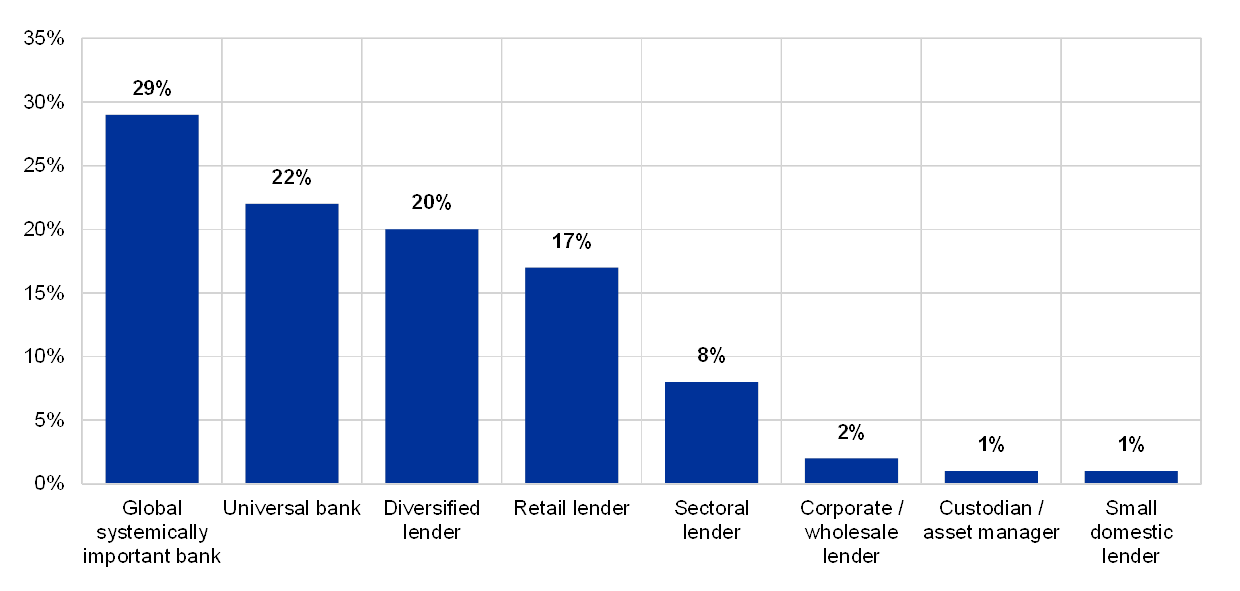
Chart 39
Changes to critical IT systems across business models
(reference year 2018; y-axis: total changes to critical IT environments)
Almost all institutions self-assessed their risk control for software acquisition, software development and project management with the score “2”.
Chart 40
Institutions’ self-assessment scores for the IT risk control category “software acquisition, software development and project management”
(reference year 2018; y-axis: percentage of institutions)
The majority of the institutions considered the risk controls of their project management framework and governance to be generally effective and consistent across the organisation, and risks to be mitigated.
Chart 41
Percentage institutions which consider their project governance and oversight processes to be implemented effectively
Project governance and oversight processes are implemented to effectively support the management and monitoring of IT projects
(reference year 2018)
* of institutions.
Chart 42
Percentage of institutions which consider their projects to be consistent with their strategy
The institution’s projects are consistent with its strategy
(reference year 2018)
* of institutions.
Chart 43
Percentage of institutions with an overarching function to manage dependencies
Dependencies between projects are identified, analysed, evaluated and managed by an overarching function
(reference year 2018)
Fewer institutions had the same assessment for IT solutions life cycle risk controls. Most of the related controls were reported as implemented by the majority of institutions. However, the following areas of controls were reported as not fully implemented:
- Project-independent quality assurance;
- Dependencies between projects that are managed by an overarching function;
- IT solutions life cycle standards, methodologies and safeguards applied to end-user computing;
- IT security controls implemented in all phases of the IT solutions life cycle.
Chart 44
Institutions’ self-assessment scores for the IT risk control category “IT solutions life cycle”
(reference year 2018; y-axis: percentage of institutions)
The majority of the institutions self-assessed their risk controls for change and release management as generally operating effectively and consistently across the organisation, and considered their risks to be mitigated. Controls related to change and release management are still to be implemented by a significant number of institutions, among which are:
- Setting up a release management team;
- Segregation of duties applied through the different phases of the change process;
- Prioritisation, scheduling and approval of every change by a dedicated management level and/or committee;
- Authorisation of IT security control changes by relevant IT/IT security managers;
- Establishing emergency change management procedures.
Chart 45
Institutions’ self-assessment scores for the IT risk control category “change and release management”
(reference year 2018; y-axis: percentage of institutions)
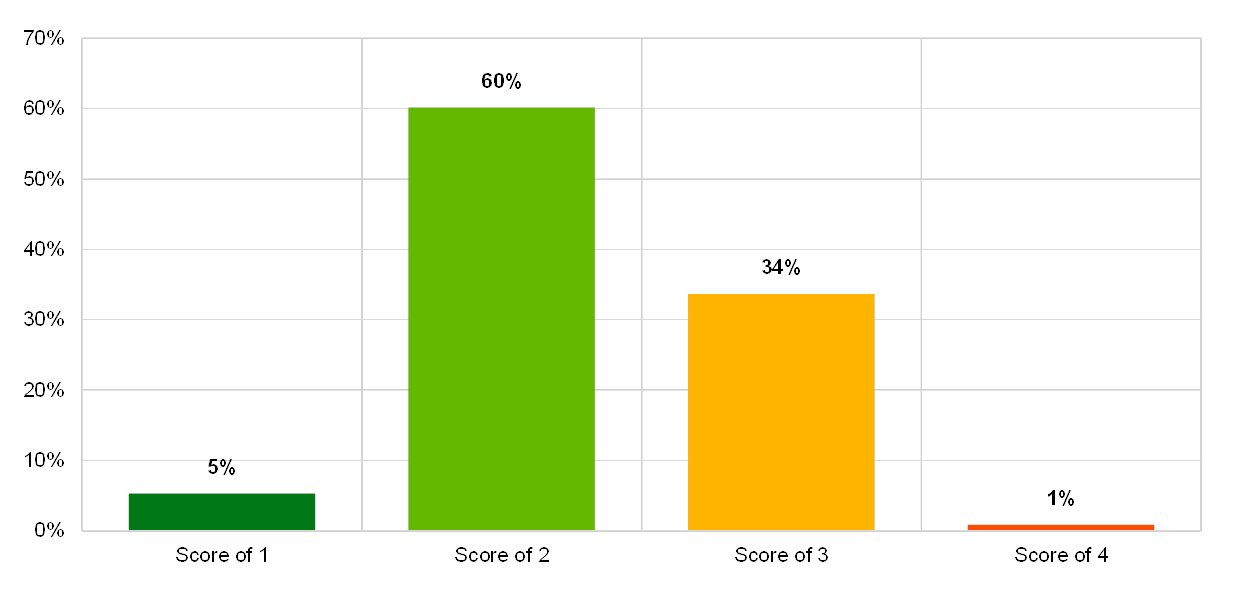
Chart 46
Percentage of institutions that rely on EOL systems by IT architecture complexity
Is the bank reliant on EOL systems supporting critical activities?
(reference year 2018; y-axis: percentage of institutions)
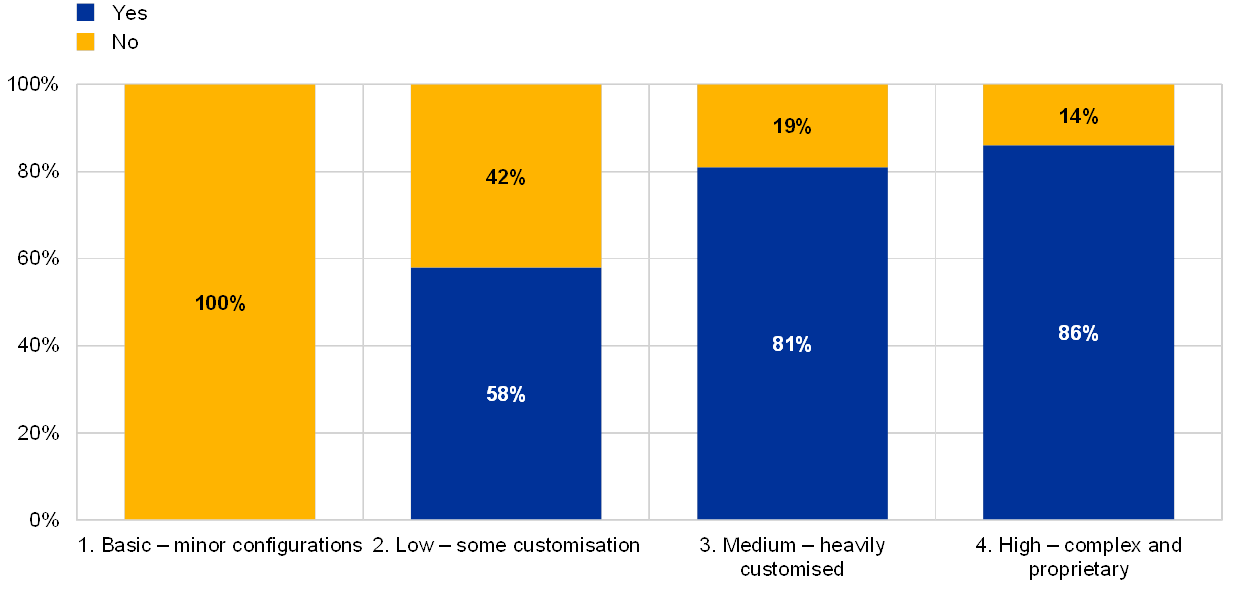
Chart 47
Percentage of institutions which have both implemented material changes and rely on EOL systems
(reference year 2018)
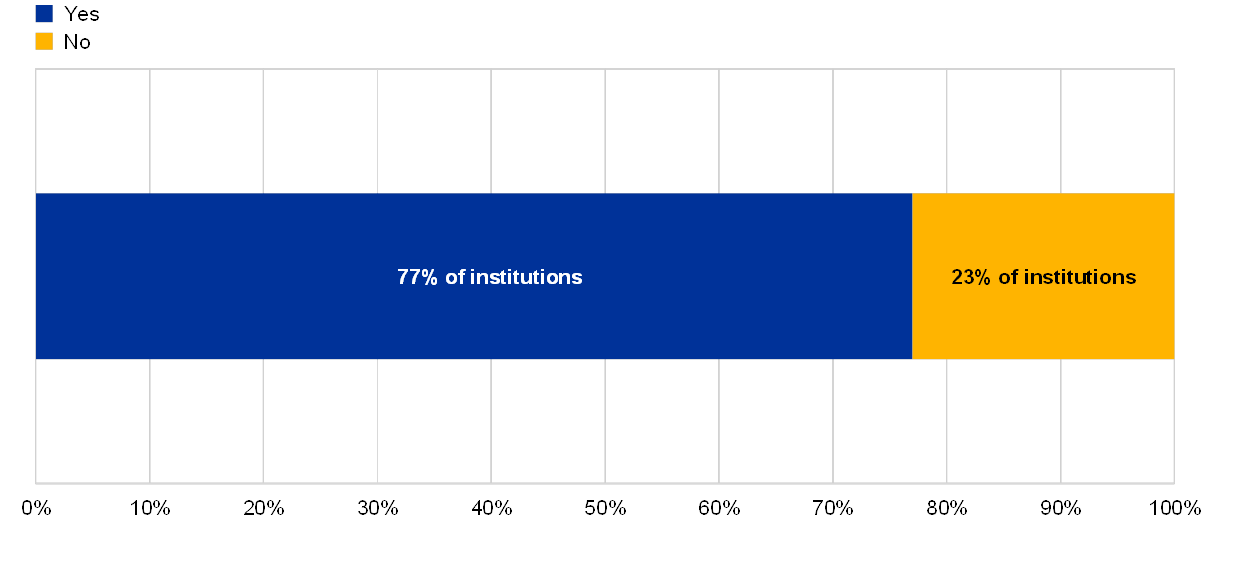
Chart 48
Number of changes to critical IT environments per institution
(y-axis: logarithmic; reference year 2018)

Chart 49
Number of changes that led to issues per institution in the production environment
(y-axis: logarithmic; reference year 2018)
2.4 IT outsourcing risk
2.4.1 General description
IT outsourcing risk is defined, according to the EBA Guidelines (EBA/GL/2017/05), as: “the risk that engaging a third party, or another Group entity (intra-group outsourcing), to provide ICT systems or related services adversely impacts the institution’s performance and risk management […]”.[24]
This includes the risk of non-availability of critical outsourced IT services, loss or corruption of critical/sensitive data entrusted to the service provider, and major service degradation/failure due to the insufficient preparedness or control processes of the outsourced service provider. In addition, ineffective outsourcing governance could result in a lack of appropriate skills and capabilities to fully identify, assess, mitigate and monitor the IT risks and could therefore limit an institution’s operational capabilities. Another aspect of IT outsourcing risk is the IT security of the third party service providers’ IT systems, with a possible direct impact on the outsourced services or critical/confidential data handled by the service provider.
2.4.2 Methodology
The ITRQ assesses IT outsourcing risk levels and risk control maturity but also collects general data about IT outsourcing, such as the reference year expenses for external and intragroup outsourcing and cloud services, as well as an IT outsourcing budget forecast.
The self-assessment for IT outsourcing risk levels focuses on assessing the relevance of outsourced IT services for critical activities in IT operations, IT development and IT security. This includes reliance on a single external service provider, based on the total value of all outsourced services, and also the total amount of monetary losses caused by the unavailability or poor quality of outsourced services. Furthermore, the self-assessment gathers data about the number of critical findings related to IT outsourcing risks that have not been addressed for more than one year. One question is dedicated to the amount of material services delivered by cloud service providers.
The effectiveness of outsourcing risk controls is assessed by looking at indicators which take into account (i) the existence of outsourcing policies, (ii) the existence of outsourcing risk assessments and consideration of chain outsourcing, (iii) information provided to and decisions made by the management body and senior management, (iv) requirements for contractual agreements with the service provider, (v) design of monitoring processes, including human and technical resources, (vi) maintenance of an outsourcing inventory.
IT outsourcing is an area of specific focus because it usually represents a major part of an institution’s overall outsourcing activities. Outsourcing requires a number of effective measures to be implemented by the institutions in order to manage related risks and ensure that, by outsourcing, the institution does not transfer responsibility for the adequacy of a function’s management. Institutions have to ensure continuous compliance with all regulatory and other requirements via their providers as also outlined in the EBA Guidelines on outsourcing arrangements[25].
Additionally, consideration is given to the risk associated with chain outsourcing, for which strong controls would be desirable. They should follow a defined process comprising the identification, assessment and monitoring of any risk related to third party providers that deliver services to an institution’s outsourcing providers.
2.4.3 Main results and observations
IT outsourcing continues to be relevant for the institutions. They reflected on the risks associated with IT outsourcing and increased their risk levels, reporting that a medium to large portion of key services is outsourced.
Chart 50
Institutions’ self-assessments scores for risk level “IT outsourcing” and risk control “IT organisation and outsourcing”
(reference years 2017 and 2018)
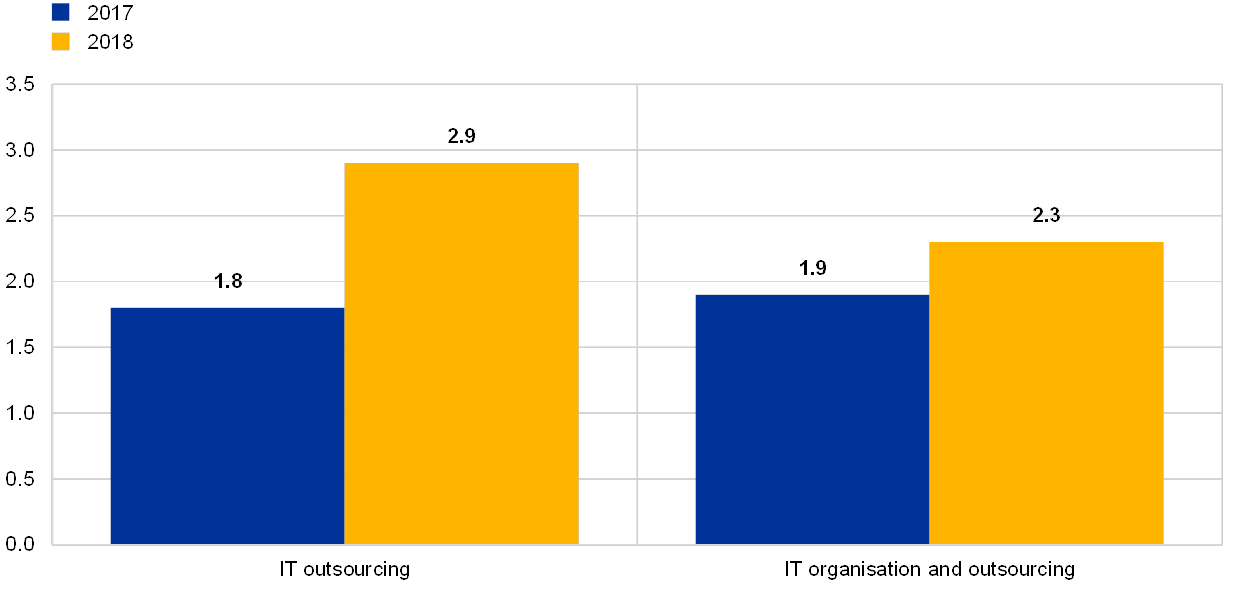
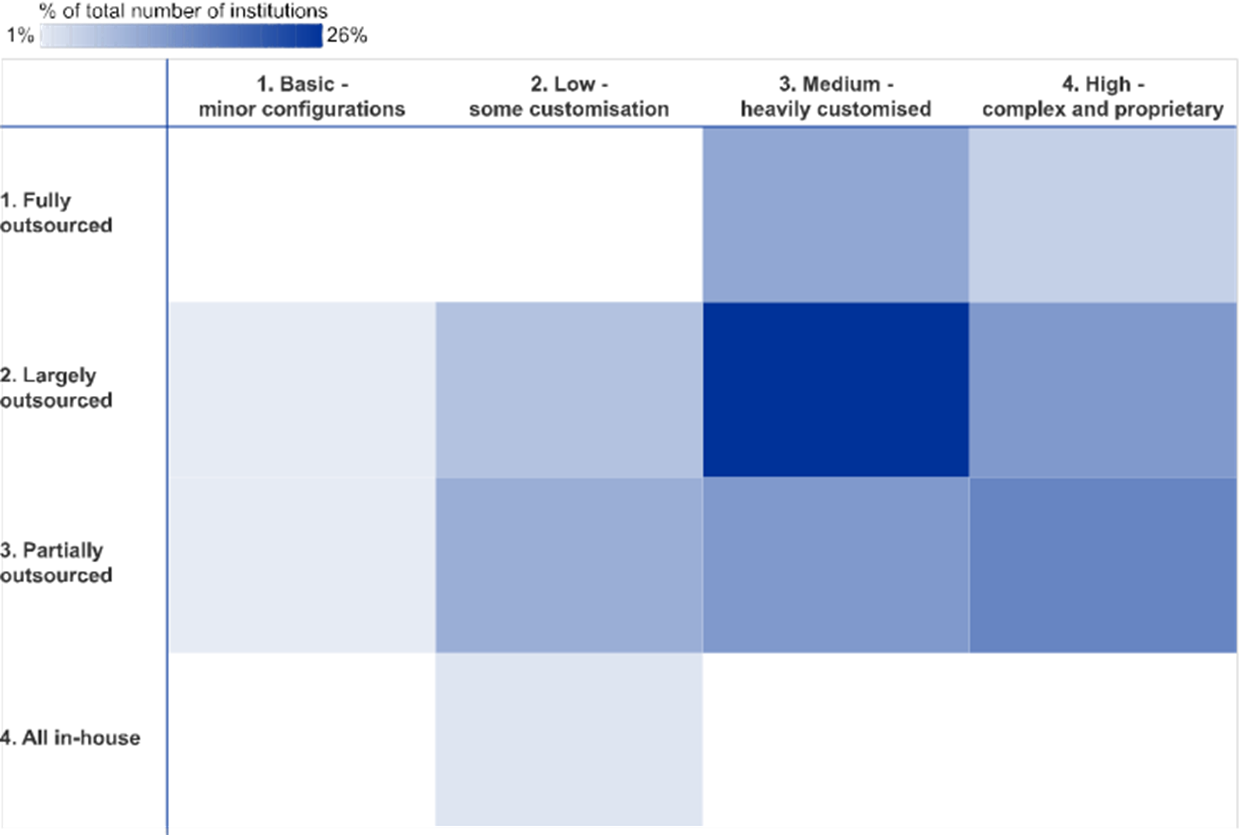
Chart 51
Relationship between IT outsourcing and IT architecture complexity
(reference year 2018; y-axis: percentage of total number of institutions)
Institutions’ IT outsourcing expenses have increased by 10% year-on-year. The largest portion of outsourcing expenses (60%) is related to costs for external providers, while cloud computing constituted 3% of overall IT outsourcing expenses.
Chart 52
Total amount of IT outsourcing expenses by category
(reference years 2017 and 2018)
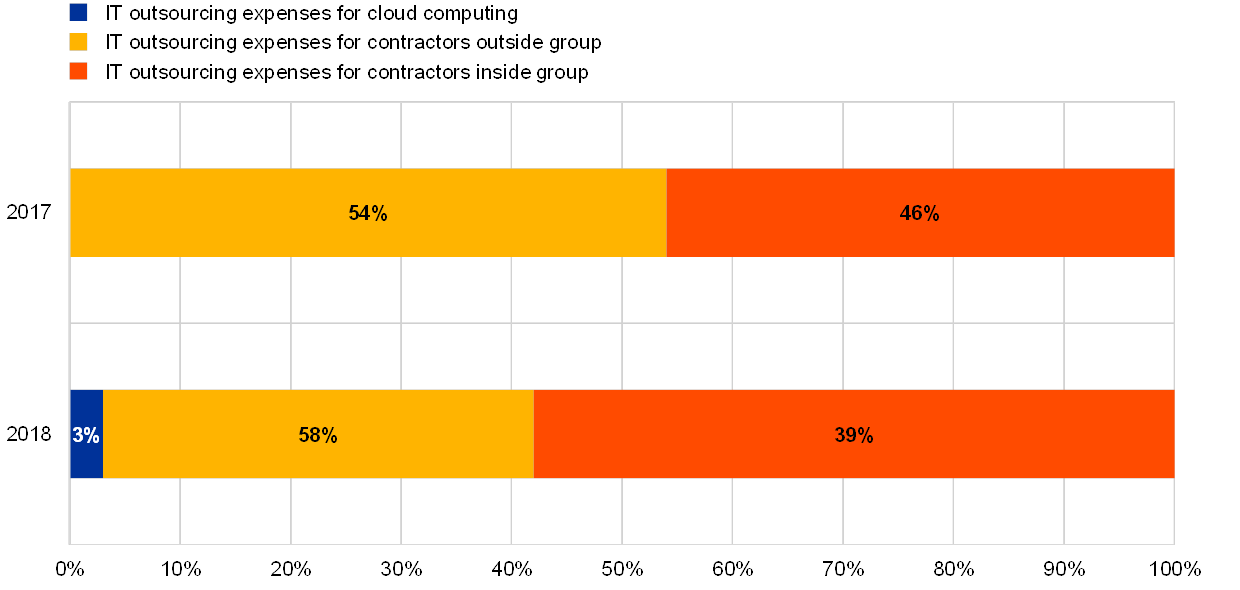
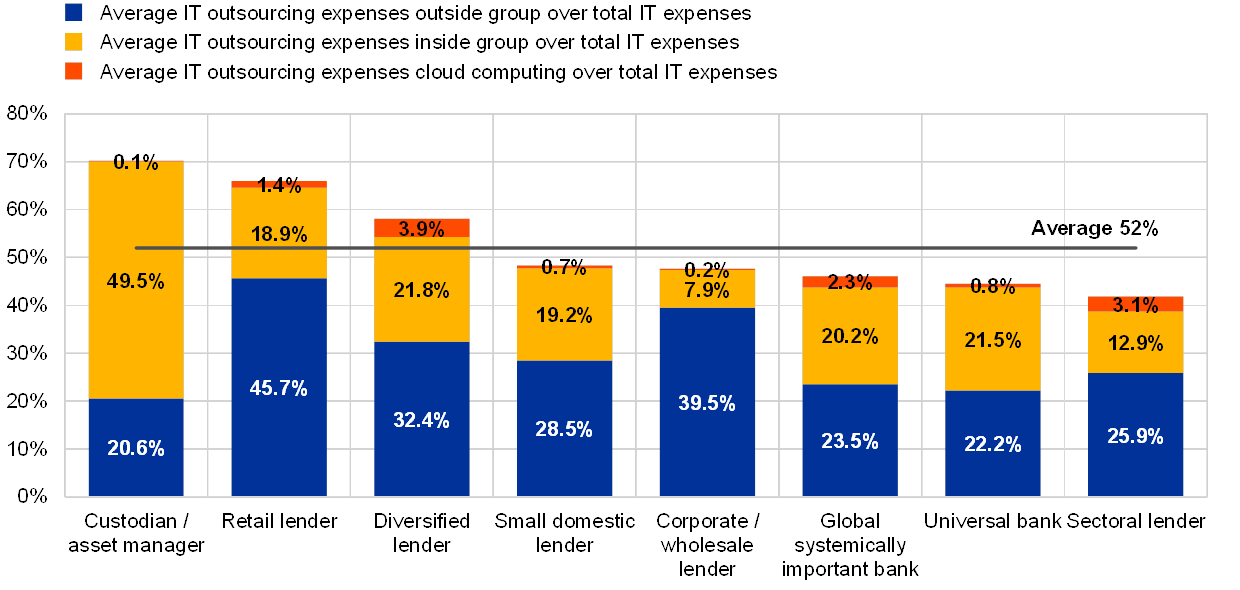
Chart 53
IT outsourcing expenses as a percentage of total IT expenses across business models
(reference year 2018; outlier institutions excluded)
Several institutions continue to show a high reliance on a single external provider, with almost 50% of the institutions reported to have spent at least half of their total IT outsourcing contract value on just one external provider[26].
Chart 54
Percentage of total outsourcing contract value provided by a single external provider per institution
(reference year 2018)

Although the relevance of IT outsourcing is increasing, the outcomes of the ITRQ show that there are still deficiencies with regard to IT outsourcing governance.
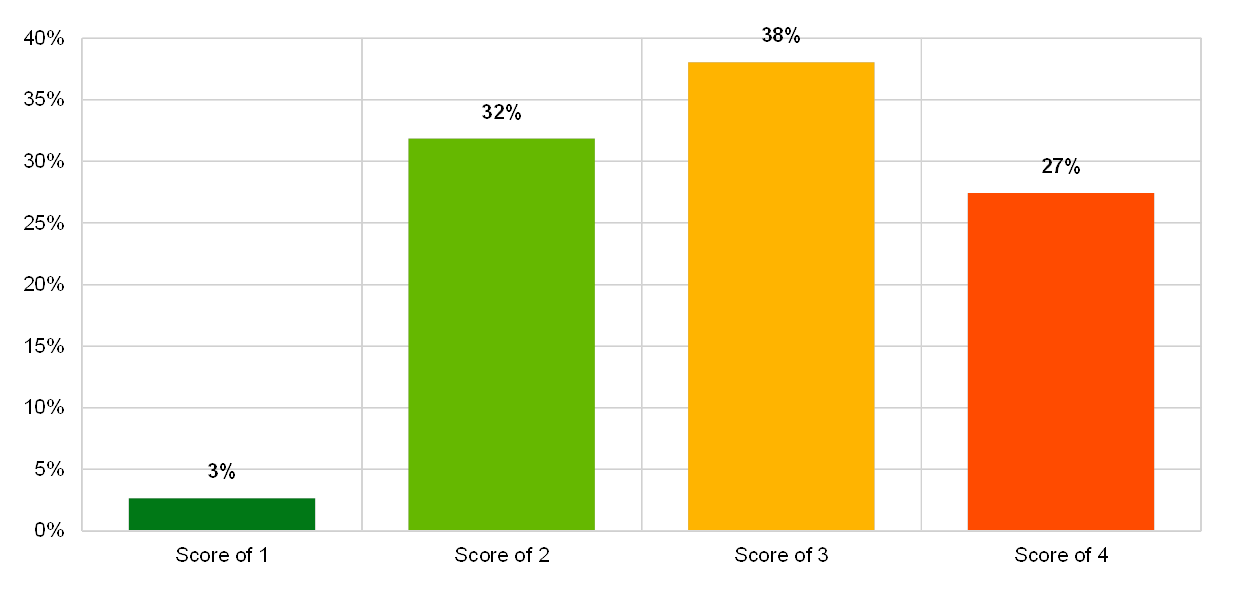
Chart 55
Institutions’ self-assessment scores for the IT risk level category “IT outsourcing”
(reference year 2018; y-axis: percentage of institutions)
Some of the institutions with largely outsourced IT systems reported that they do not have an up-to-date asset inventory[27] and experience limitations with regard to the human and technical resources involved in the outsourcing process.
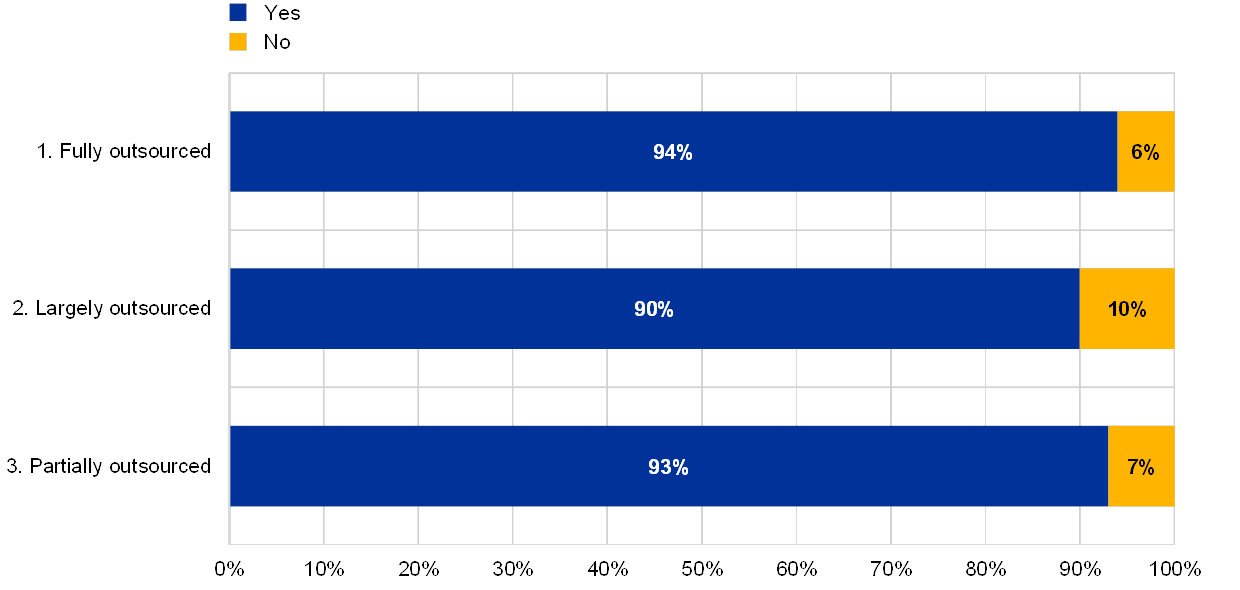
Chart 56
Percentage of institutions which maintain and update inventory of outsourced services by extent of IT outsourcing
The institution maintains an up-to-date inventory of outsourced services
(reference year 2018; eight institutions with no IT outsourcing excluded)
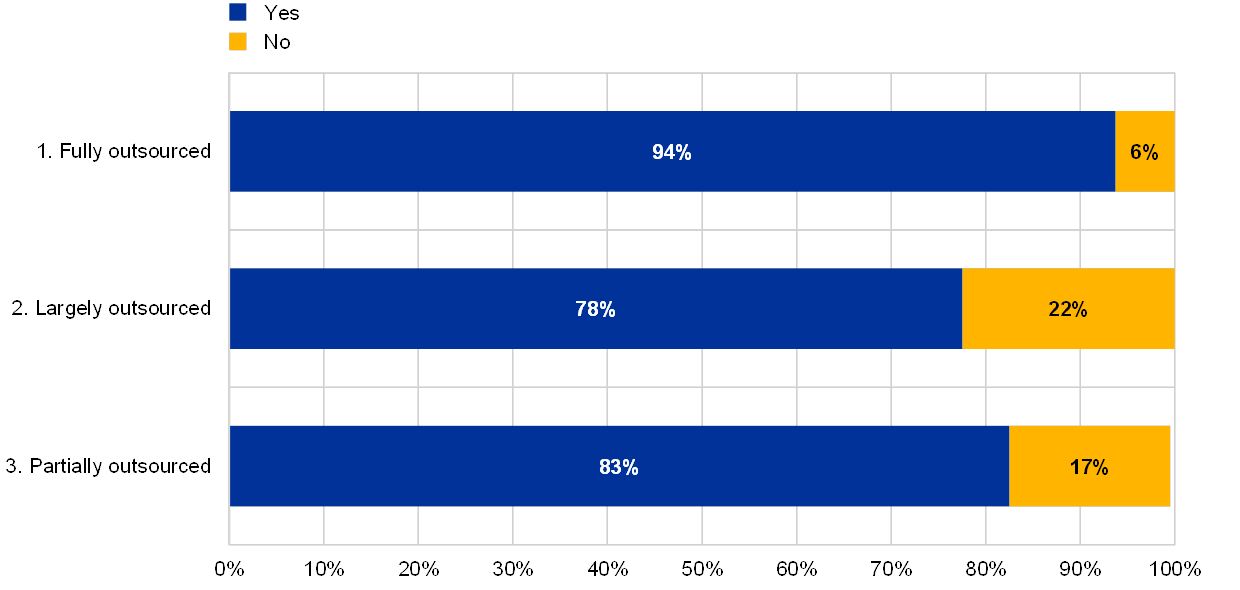
Chart 57
Percentage of institutions with outsourcing policies defying roles and responsibilities by extent of IT outsourcing
Outsourcing policies define roles and responsibilities
(reference year 2018; eight institutions with no IT outsourcing excluded)
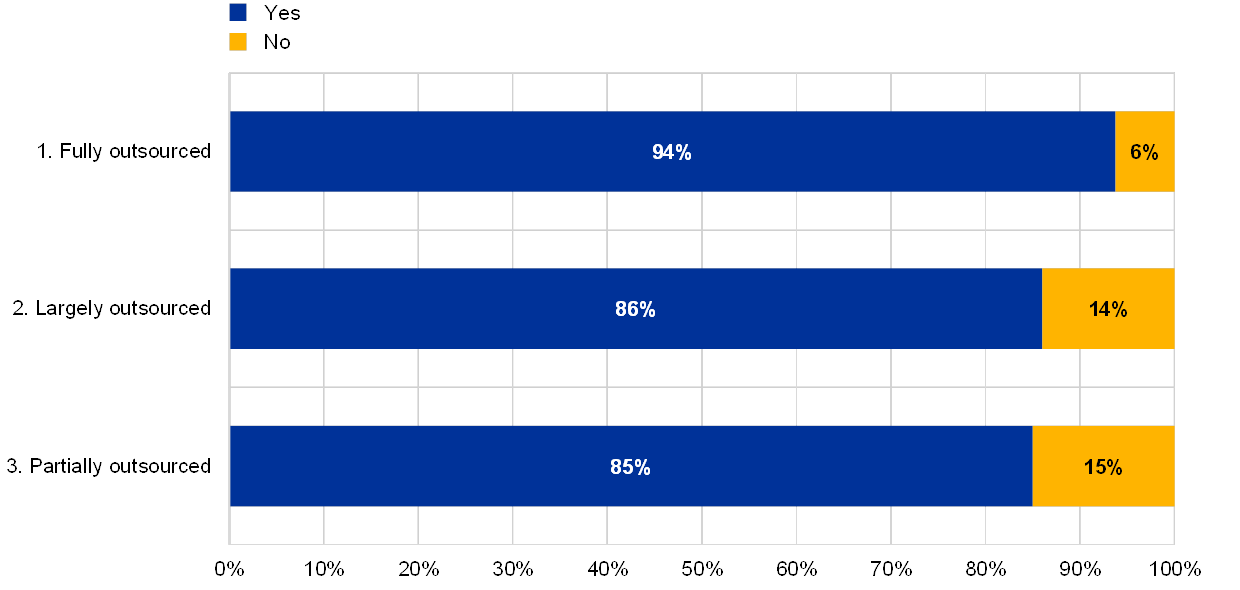
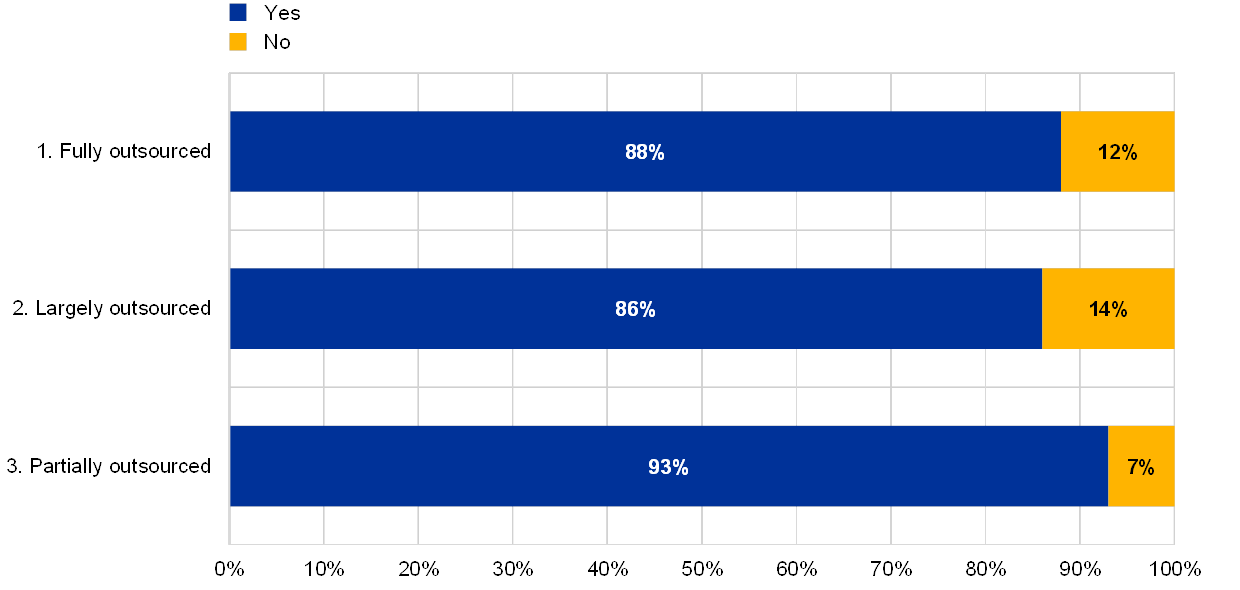
Chart 58
Percentage of institutions with adequate outsourcing human and technical resources by extent of IT outsourcing
Outsourcing human and technical resources are adequate
(reference year 2018; eight institutions with no IT outsourcing excluded)
Institutions with the greatest reliance on a single external provider reported a below-average number of IT audits and IT audit employees.
Chart 59
Percentage of institutions which have contracts with the service provider for all outsourced work by extent of IT outsourcing
For each outsourced service, there is a contract between the institution and the service provider
(reference year 2018; eight institutions with no IT outsourcing excluded)
2.5 IT data integrity risk
2.5.1 General description
The EBA Guidelines (EBA/GL/2017/05) identified IT data integrity risk as a material IT risk to be subject to a close review by competent authorities. IT data integrity risk is the risk that data stored and processed by IT systems are incomplete, inaccurate or inconsistent across different systems. This could be, for example, as a result of weak or absent IT controls during the different phases of the IT data life cycle (e.g. designing the data architecture, building data models and/or data dictionaries, verifying data inputs, and controlling data extractions, transfers and processing, including rendered data outputs), preventing an institution from providing services and producing risk management and financial information in a correct and timely manner.[28]
2.5.2 Methodology
The institutions were asked to assess their risk levels for IT data integrity based on four indicators: (i) the number of end-user computing (EUC) solutions that support critical activities, (ii) the number of invalid data modification incidents on critical IT systems, (iii) the number of findings related to IT data integrity risk which have not been addressed for more than one year and (iv) known cases of incorrectly submitted data in their supervisory reporting due to IT issues.
EUC consists of IT systems usually developed or managed by the business function’s end users outside the IT organisation. They often lack proper quality assurance and testing, which can lead to inadequate data quality. In addition, as soon as patterns of incorrectly submitted data occur in an institution’s supervisory reporting, or if a number of invalid data modification incidents and findings have not been addressed for more than one year, a higher level of IT data integrity risk could be indicated.
The effectiveness of the risk control framework for identifying, understanding, measuring and mitigating IT data integrity risk is self-assessed in two areas: data quality management and data architecture models. Data quality management refers to processes for defining roles and responsibilities for managing the integrity of the data in IT systems (e.g. data architects, data officers, data custodians and data owners/stewards) in order to provide guidance on which data is critical from a data integrity perspective. Data quality management should be subject to specific IT controls (e.g. automated input validation controls, data transfer controls and reconciliations) in the different phases of the IT data life cycle, in order to resolve identified IT data integrity issues and properly manage EUC solutions. The term “data architecture models” refers to the management of data architecture, models, flows or dictionaries that are validated with relevant business and IT stakeholders to support the necessary data consistency across IT systems and remain aligned with business and risk management needs. This also closely relates to expectations published by the ECB Banking Supervision in its letter on Supervisory expectations on risk data aggregation capabilities and risk reporting practices.
2.5.3 Main results and observations
In the year-on-year comparison, it was noted that the total number of EUC solutions supporting critical activities has increased by about 24% and that most institutions (77%) reported having at least one EUC solution supporting critical activities.
Chart 60
Total number of EUC solutions supporting critical activities
(reference years 2017 and 2018)
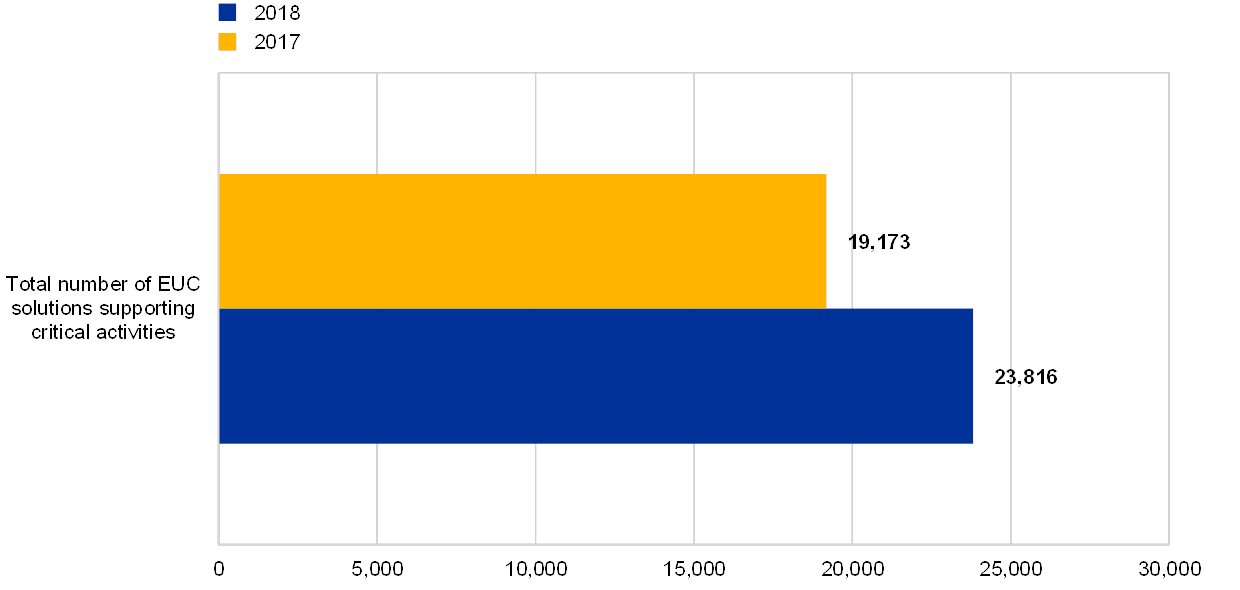
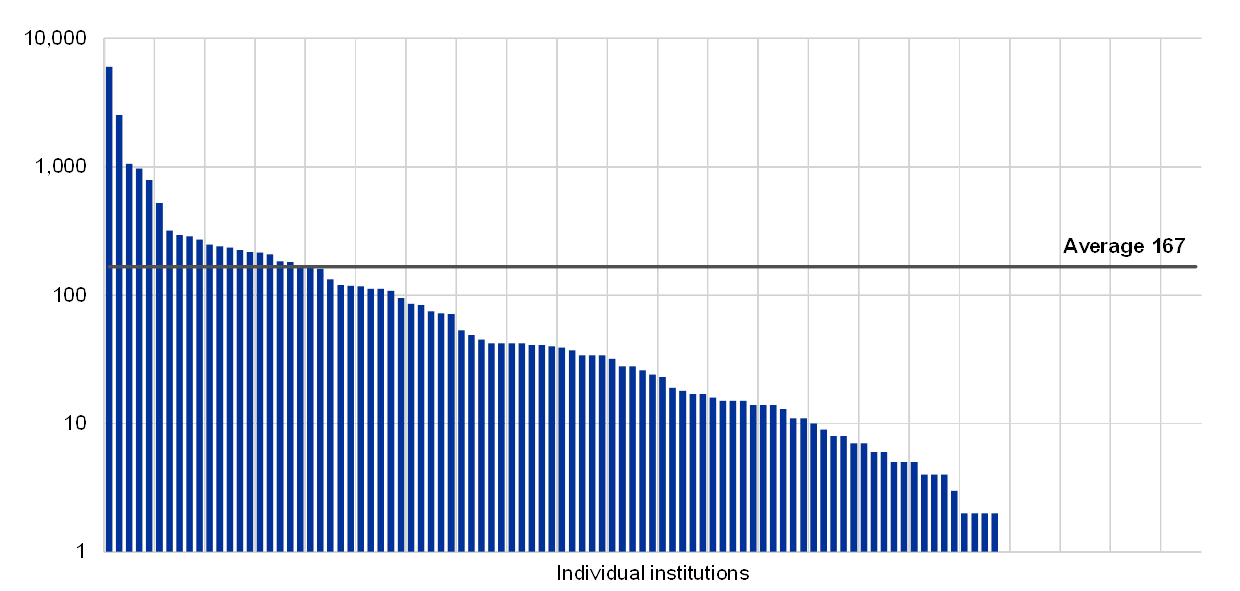
Chart 61
Number of EUC solutions supporting a critical activity per institution
(reference year 2018; institutions without EUC solutions excluded; y-axis: logarithmic; number of EUC solutions)
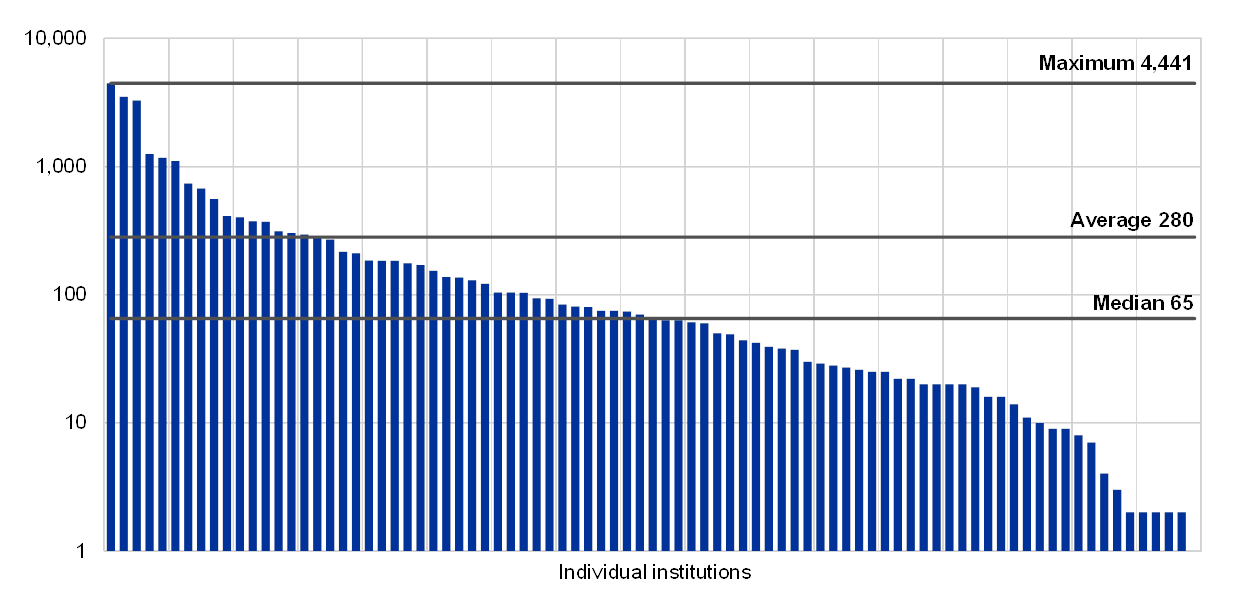
Individual institutions
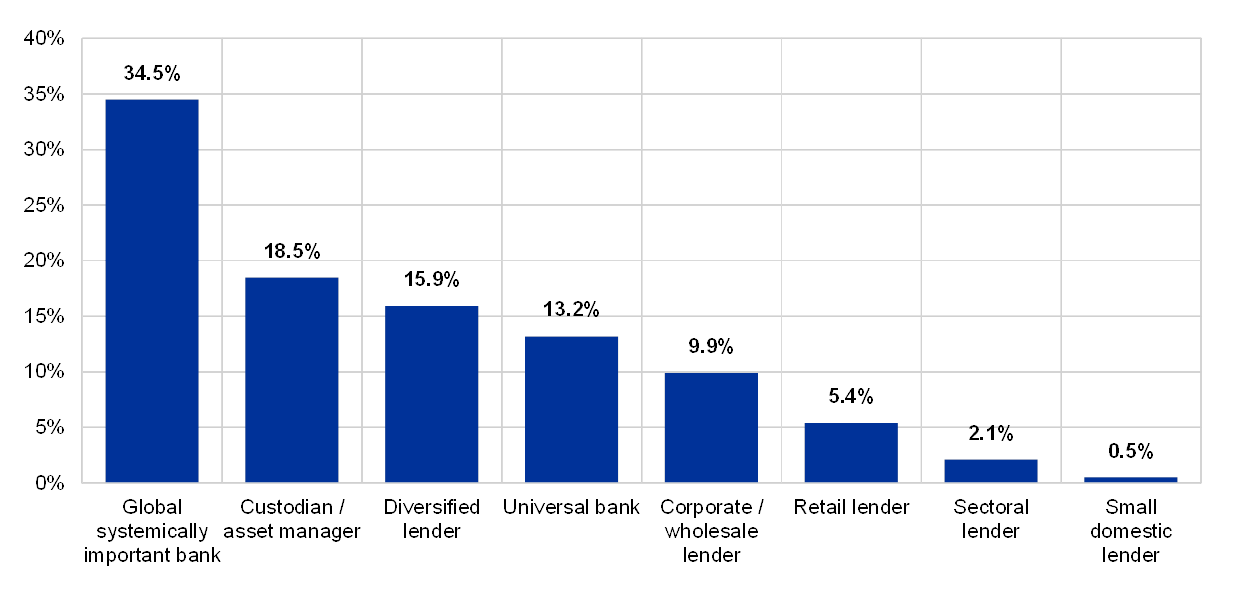
Chart 62
Distribution of percentage of EUC solutions supporting critical activities across business models
(reference year 2018; y-axis: percentage of EUC solutions supporting critical activities)
Most institutions mentioned in their statements that there is a lack of governance for their EUC solutions.
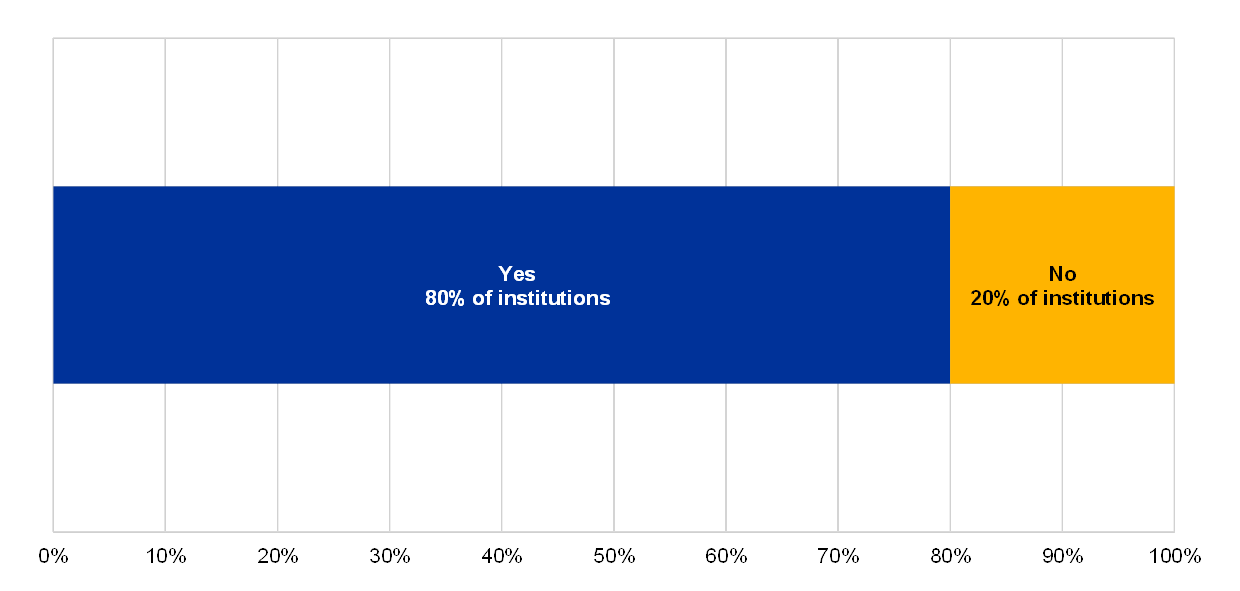
Chart 63
Percentage of institutions with a formalised management policy for EUC
A formalised management policy for EUC is in place
(reference year 2018; institutions without EUC solutions excluded)

Chart 64
Percentage of institutions for which data quality management procedures also apply to EUC
Data quality management procedures also apply to EUC
(reference year 2018; institutions without EUC solutions excluded)
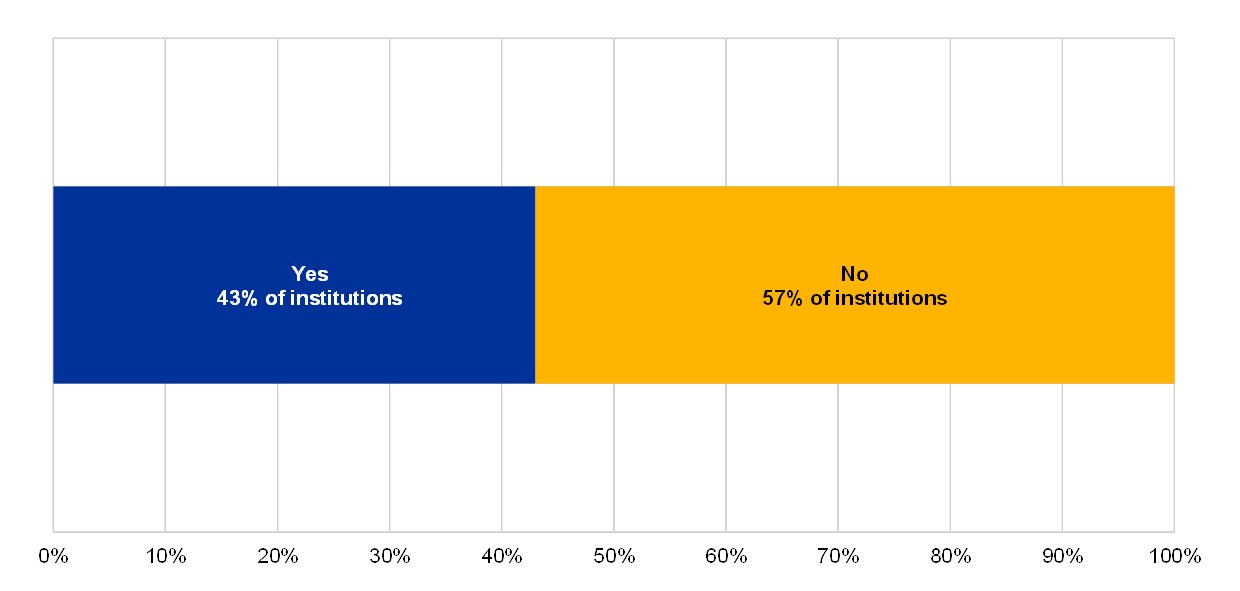
Chart 65
Percentage of institutions for which IT solutions life cycle standards also apply to EUC
IT solutions life cycle standards also apply to EUC
(reference year 2018; institutions without EUC solutions excluded)
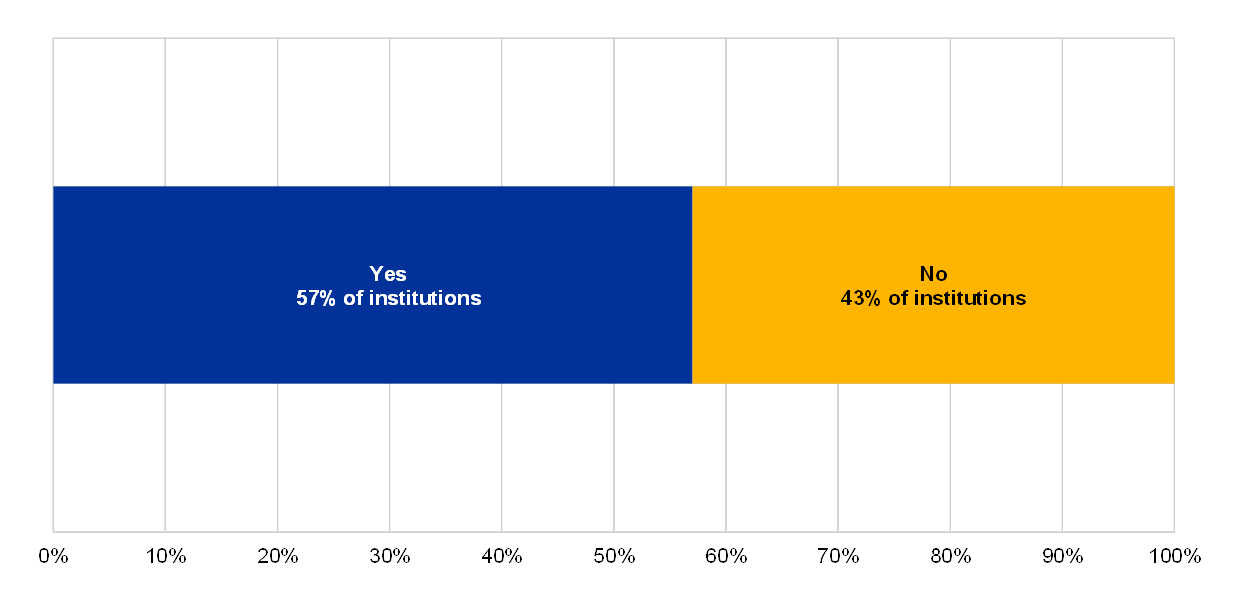
Chart 66
Percentage of institutions for which protection against data leaks is properly implemented, managed and monitored with at least 1 EUC
Protection against data leaks is implemented, properly managed and continuously monitored
(reference year 2018)
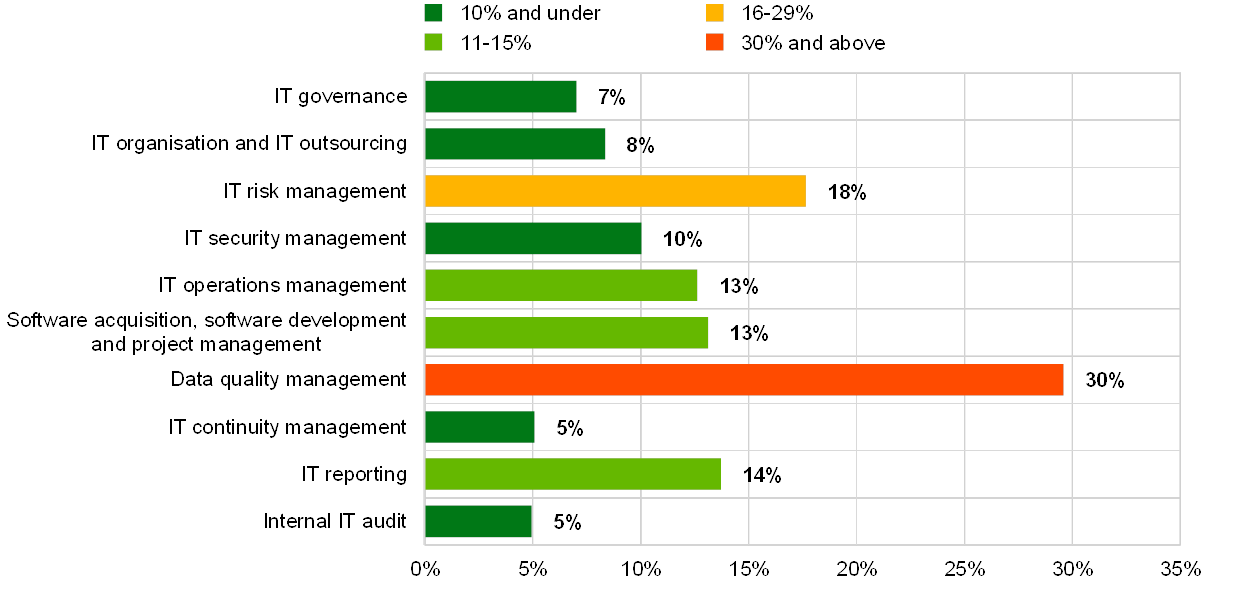
It was also observed that institutions with a lower risk control maturity often report that IT data quality management implementations are in progress and/or in some cases have just started. Several institutions reported cases of incorrectly submitted data to the supervisors. Several institutions indicated a lack of human and technical resources to support an adequate level of data quality, and also that they did not have defined and documented data architecture, models and dictionaries, and had not validated them with relevant business and IT stakeholders.
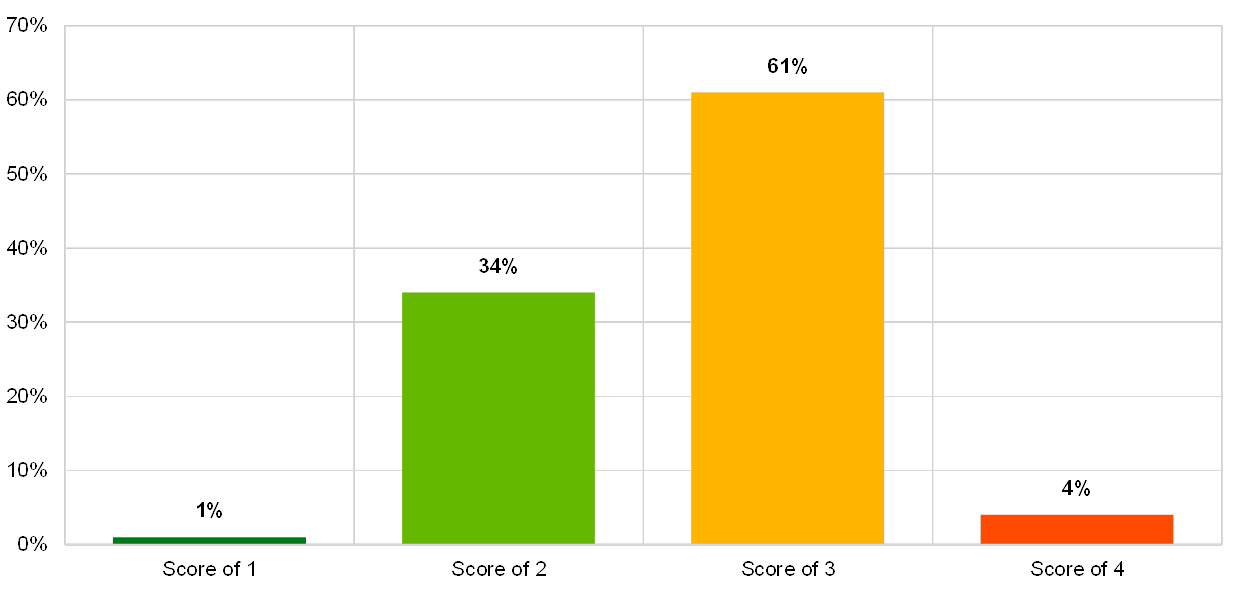
Chart 67
Percentage of inadequate risk controls in place for each risk control category
(reference year 2018; percentage of “No” answers over total answers)
2.6 IT internal audit
2.6.1 General description
The EBA Guidelines on ICT risk assessment[29] include internal audit and refer to “… internal audit functions to provide assurance that the risks associated with ICT strategy implementation have been identified, assessed and effectively mitigated and that the governance framework in place to implement the ICT strategy is effective…”. The EBA Guidelines on ICT risk assessment should be read in conjunction with other EBA Guidelines, especially those on internal governance, which require institutions to implement an internal audit function[30]: “The independent internal audit function, as the third line of defence, conducts risk-based and general audits and reviews the internal governance arrangements, processes and mechanisms to ascertain that they are sound and effective, implemented and consistently applied…”[31].
Internal governance is commonly implemented by setting up a three LoD model. The aim of this part of the ITRQ is to receive information on the quality of the internal audit function itself, as well as the audit work performed within the institutions.
2.6.2 Methodology
The ITRQ collects general information on the IT audit work performed by institutions, including an overview of the number of IT audits and the percentage of IT areas not assessed during the last three years, as well as about the audit universe coverage in general. The audit universe within the institutions is of high importance, and it is desirable that it is comprehensively, covering the full range of activities including IT risk. A well-defined audit universe can be considered as the starting point for internal audits if they are to achieve sufficient quality, depth and frequency and an independent and robust three LoD model.
The ITRQ also collects information on the number of new critical IT findings identified during the year, the number of closed critical IT findings, and the number of outstanding critical IT findings which have been open for more than one year. This information provides an indication of IT audit focus areas and trends over time. Nevertheless, analysing the number of audits on a stand-alone basis does not provide an indication of the quality and comprehensiveness of the respective audits. The coverage of IT functions in the audit plans provides an indication of the capacity available to independently assess (critical) IT areas, but a lack of competent or insufficient number of qualified IT auditors may lead to situations in which the audits cannot be of the required frequency, quality and depth.
Trends in the number of findings can provide useful insights, particularly into the handling of audit findings by the organisation over a longer period, taking into account that resolving IT findings may require multi-year projects.
The level of involvement of the management body and senior management in the internal audit process, the audit quality and the reporting to the management body are also self-assessed by the institutions. They need to be adequately involved in the internal risk control framework of the institutions. Therefore, they need to be informed of the (critical) IT internal audit findings, as well as of any action plans and programmes to address the audit findings.
2.6.3 Main results and observations
Institutions self-assessed their risk control environment for IT internal audit as generally sufficient. This was the best score among all risk control categories.
Chart 68
Institutions’ self-assessment scores for the IT risk control category “internal IT audit”
(reference year 2018; y-axis: percentage of institutions)
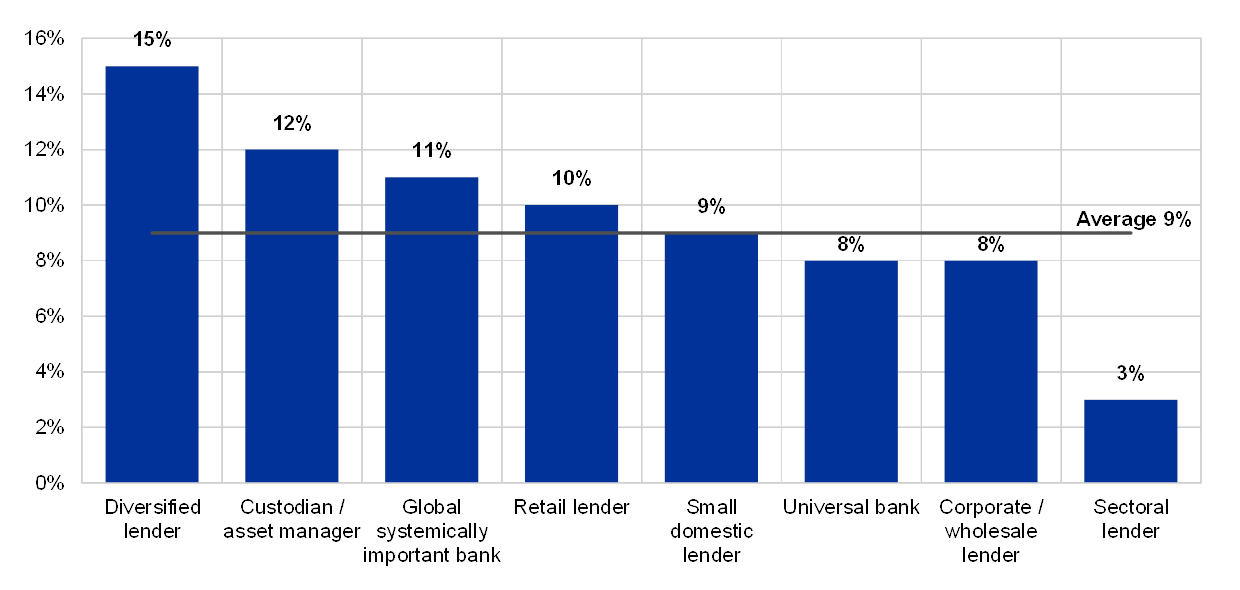
The coverage of IT functions by internal audits within the last three years is above 90%.
Chart 69
Average percentages of IT functions not assessed by internal audit in the last 3 years across business models
(reference year 2018; y-axis: average percentage of IT functions not assessed in the last 3 years))
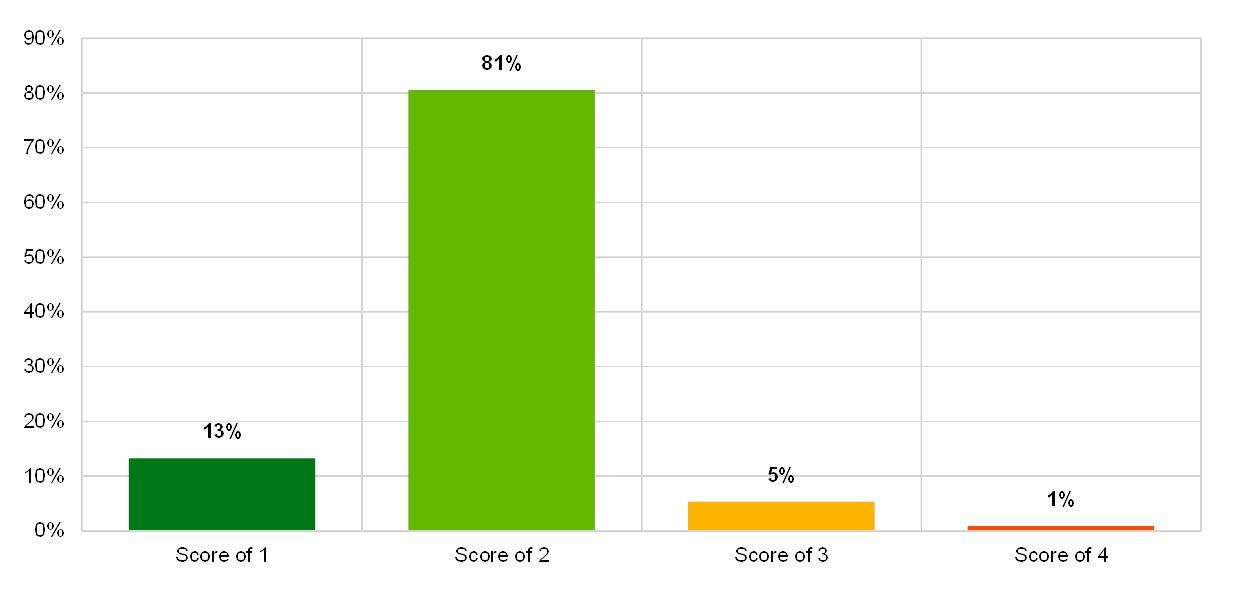
This year’s analysis shows that there were numerous critical findings open for more than one year. The majority of these findings were related to IT security risk, while the second and third most findings were recorded in IT data integrity risk and IT availability risk.
Chart 70
Distribution of critical IT findings not addressed for more than 1 year across IT risk level categories
(reference years 2017 and 2018)
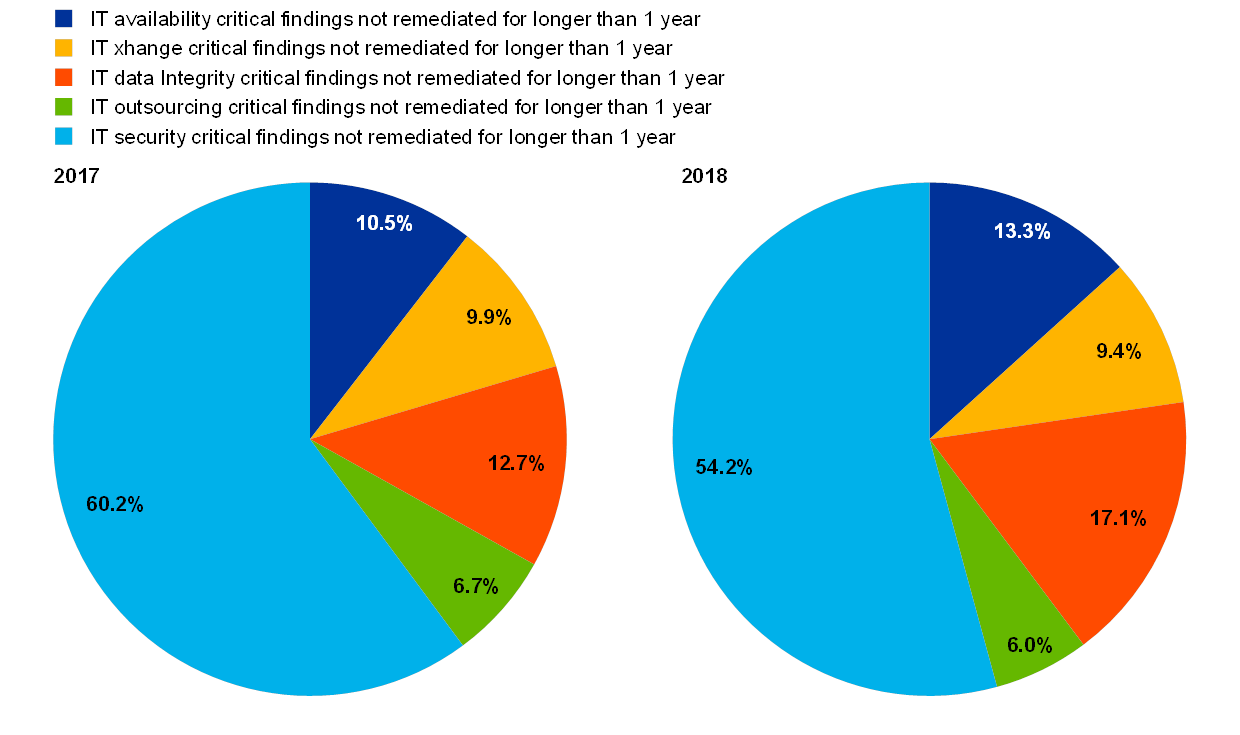
Chart 71
Number of outstanding critical IT findings for institutions which do/do not maintain an updated inventory of information assets
The institution maintains an updated inventory of its information assets, including IT systems and applications
(reference year 2018)

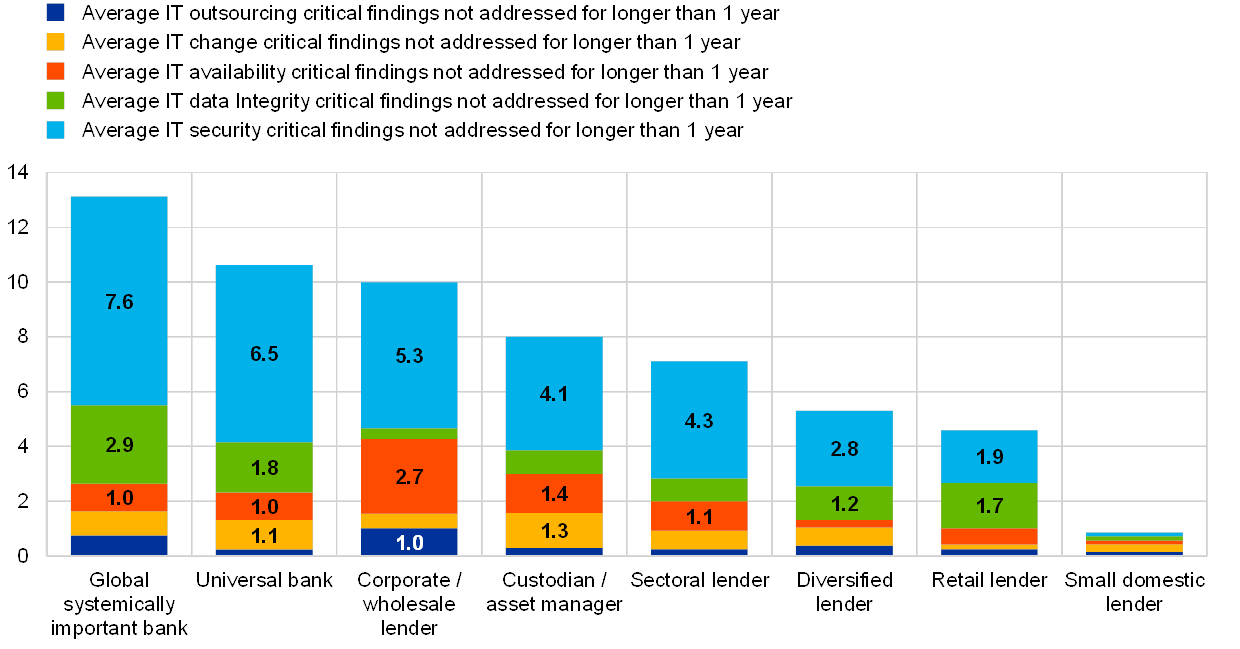
Chart 72
Number of critical IT findings not addressed for more than 1 year, averages across business models
(reference year 2018; y-axis: average number of findings not mitigated for longer than 1 year)
© European Central Bank, 2020
Postal address 60640 Frankfurt am Main, Germany
Telephone +49 69 1344 0
Website www.bankingsupervision.europa.eu
All rights reserved. Reproduction for educational and non-commercial purposes is permitted provided that the source is acknowledged.
For specific terminology please refer to the ECB glossary (available in English only).
PDF ISBN 978-92-899-4354-3, doi:10.2866/1415, QB-02-20-299-EN-N
- EBA/GL/2017/05. These Guidelines are addressed to competent authorities and are intended to promote common procedures and methodologies for the assessment of the Information and Communication Technology (ICT) risk under the supervisory review and evaluation process (SREP), referred to in Article 97 of Directive 2013/36/EU. In particular, these Guidelines drawn up pursuant to Article 107(3) of Directive 2013/36/EU in order to supplement and further specify criteria for the assessment of ICT risk as part of operational risk set out in the EBA Guidelines on common procedures and methodologies for the supervisory review and evaluation process (SREP) (EBA/GL/2014/13).The ECB complies with the Guidelines from the date of notification within the limit of, and without prejudice to, national provisions implementing Directive 2013/36/EU.
- As defined in Article 97 of the CRD IV (Directive 2013/36/EU).
- Throughout the document the terms ICT and IT are used in an interchangeable way. ICT refers to requirements set out by the EBA, whereas the acronym IT is widely used by the industry and by the ECB Banking Supervision.
- EBA/GL/2019/02 EBA Guidelines on outsourcing arrangements, overall entry into force September 2019. This is without prejudice of national regulation.
- Institution should: “complete the documentation of all existing outsourcing arrangements, other than for outsourcing arrangements to cloud service providers, in line with these guidelines following the first renewal date of each existing outsourcing arrangement, but by no later than 31 December 2021”.
- EBA/GL/2017/11 EBA Guidelines on internal governance, Article 204 and 205, the standards established by the Institute of Internal Auditors.
- EBA/GL/2017/05
- As defined in Article 97 of the CRD IV (Directive 2013/36/EU).
- The decision was adopted by the Supervisory Board under Article 26(8) of Council Regulation (EU) No 1024/2013, pursuant to the powers conferred in accordance with Article 10(1)(a) of Regulation (EU) No 1024/2013 and Article 141(1) of Regulation (EU) No 468/2014 of the European Central Bank to require supervised entities to report significant cyber incidents to the ECB.
- In four countries (Cyprus, Greece, Italy and Portugal) indirect reporting takes place via the NCA.
- Reference year 2017 refers to data as of 31 December 2017.
- Reference year 2018 refers to data as of 31 December 2018.
- All scores use the same scale, with “1” being the best mark and “4” the worst mark.
- Please also refer to ECB Banking Supervision letter published on Supervisory expectations on risk data aggregation capabilities and risk reporting practices
- EBA/GL/2019/02 EBA Guidelines on outsourcing arrangements, overall entry into force September 2019. This is without prejudice of national regulation
- EBA/GL/2019/02 EBA Guidelines on outsourcing arrangements, overall entry into force September 2019. This is without prejudice of national regulation.
- Institution should: “complete the documentation of all existing outsourcing arrangements, other than for outsourcing arrangements to cloud service providers, in line with these guidelines following the first renewal date of each existing outsourcing arrangement, but by no later than 31 December 2021”.
- In line with the EBA/GL/2017/11 EBA Guidelines on internal governance, Article 204 and 205 of the same, the standards established by the Institute of Internal Auditors.
- EBA/GL/2019/04.
- Guidelines on ICT Risk Assessment under the Supervisory Review and Evaluation process (SREP) 11/09/2017, p.14.
- Guidelines on ICT Risk Assessment under the Supervisory Review and Evaluation process (SREP) 11/09/2017, Annex – ICT Risk Taxonomy, pp.26-28.
- EBA Guidelines on ICT Risk Assessment under the Supervisory Review and Evaluation process (SREP), p.11.
- EBA Guidelines on ICT Risk Assessment under the Supervisory Review and Evaluation process (SREP), p. 11.
- Guidelines on ICT Risk Assessment under the Supervisory Review and Evaluation process (SREP), p.11.
- EBA/GL/2019/02.
- It is acknowledged that some institutions only have a small outsourcing budget when compared to their overall IT budget.
- Asset inventory is in this context “inventory of all IT assets/configuration items (software and hardware including outsourced assets)” and should not be interpreted as the outsourcing register.
- Guidelines on ICT Risk Assessment under the Supervisory Review and Evaluation process (SREP) page.11.
- EBA/GL/2017/05, p. 17.
- EBA/GL/2017/11, c.f. Guidelines on internal governance under Directive 2013/36/EU, p. 53.
- EBA/GL/2017/11, c.f. Guidelines on internal governance under Directive 2013/36/EU, p. 11.