- PRESS RELEASE
ECB publishes supervisory banking statistics for the fourth quarter of 2020
12 April 2021
- ECB publishes aggregated statistics on cost of risk and on loans subject to COVID-19-related measures for first time
- Aggregate total capital ratio of significant institutions increased to 19.51% in fourth quarter of 2020 (from 19.04% in third quarter and 18.60% one year earlier)
- Aggregate non-performing loans ratio fell further to 2.63%
- Profitability of significant institutions decreased, with aggregated return on equity at 1.53% (down from 5.16% one year earlier)
- Liquidity coverage ratio improved further to 171.78%, up significantly from 145.93% one year earlier
Capital adequacy
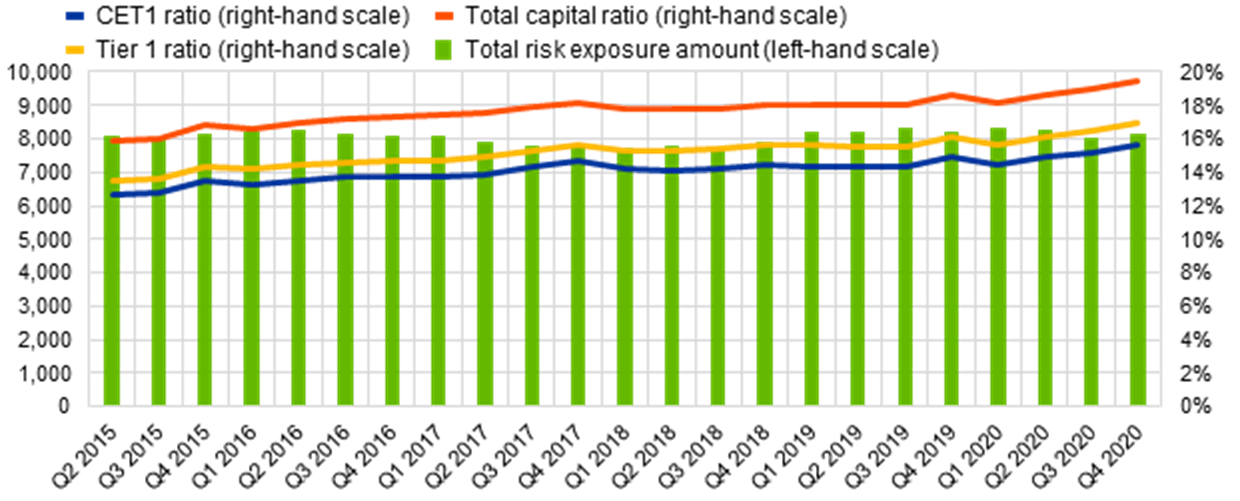
Following a drop in the first quarter of 2020, the aggregate capital ratios for significant institutions, (i.e. banks that are supervised directly by the ECB) increased steadily throughout the remainder of 2020. The aggregate Common Equity Tier 1 (CET1) ratio stood at 15.62% in the fourth quarter of 2020, the aggregate tier 1 ratio stood at 16.95%, and the aggregate total capital ratio stood at 19.51% (up from 14.94%, 16.13% and 18.60% respectively in the fourth quarter of 2019). Aggregate CET1 ratios at country level ranged from 12.91% in Spain to 29.14% in Estonia. Across business model categories as applied in the Single Supervisory Mechanism, global systemically important banks (G-SIBs) reported the lowest aggregate CET1 ratio (14.46%) and development/promotional lenders reported the highest (32.09%).
Chart 1
Total capital ratio and its components by reference period
(EUR billions; percentages)
Source: ECB.
Chart 2
Capital ratios by country for the fourth quarter of 2020
(percentages)
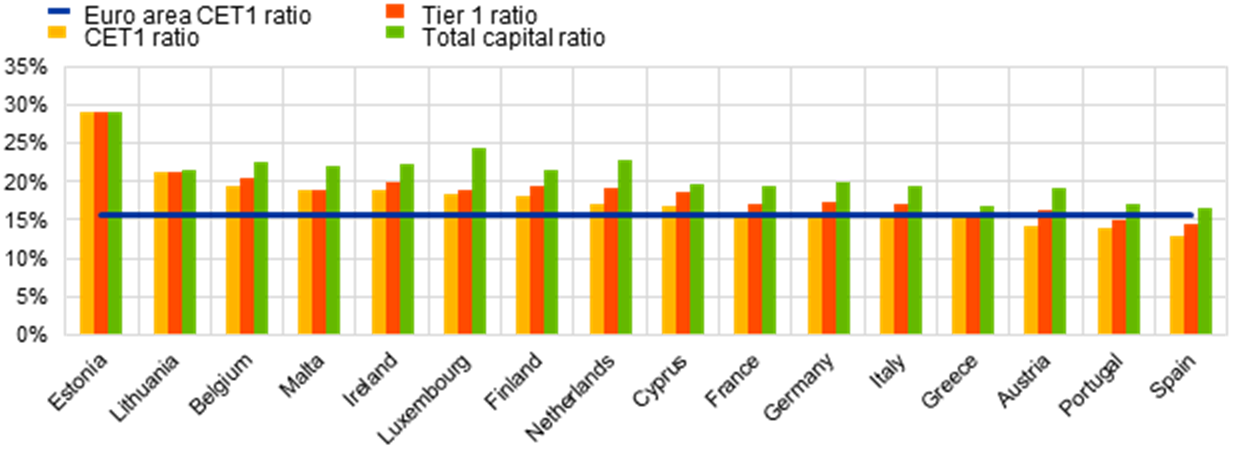
Source: ECB.
Note: Some countries participating in European banking supervision are not included in this chart, either for confidentiality reasons or because there are no significant institutions at the highest level of consolidation in that country.
Chart 3
Capital ratios by business model for the fourth quarter of 2020
(percentages)
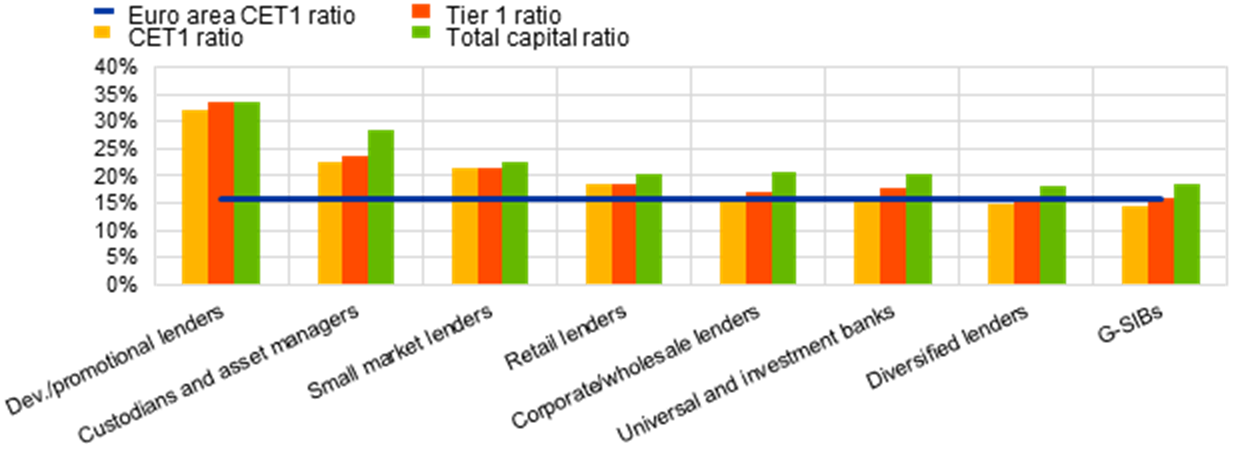
Source: ECB.
Note: “Dev./promotional lenders” refers to development and promotional lenders; “retail lenders” refers to retail and consumer credit lenders.
Asset quality
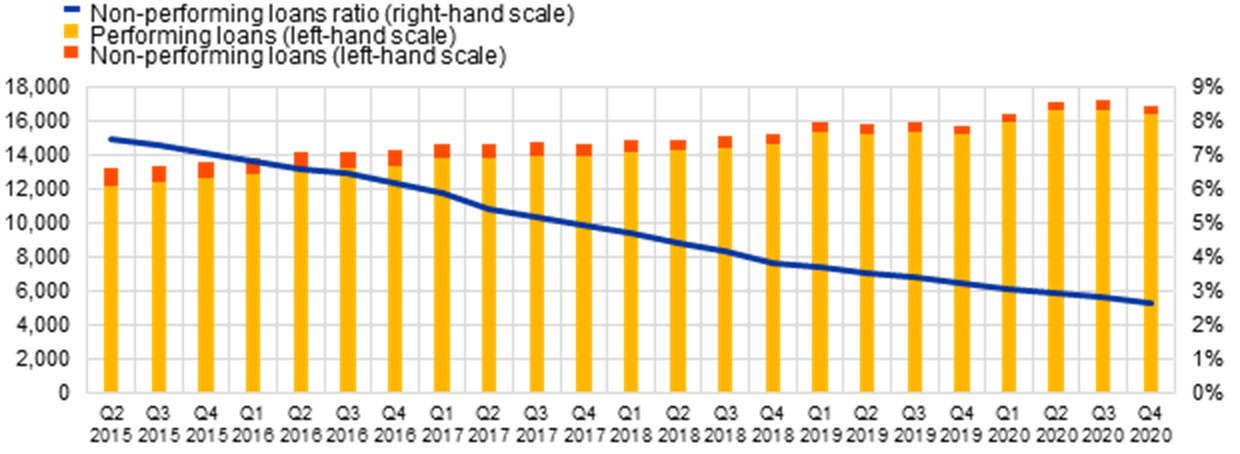
The aggregate non-performing loans (NPL) ratio fell to 2.63% in the fourth quarter of 2020. The stock of NPLs declined by 12.4% in one year, falling from €506 billion in the fourth quarter of 2019 (last reporting date before the outbreak of the pandemic) to €444 billion in the fourth quarter of 2020. At country level, the average NPL ratio ranged from 0.78% in Luxembourg to 25.54% in Greece. Across business model categories, custodians and asset managers reported the lowest aggregate NPL ratio (0.35%) and diversified lenders reported the highest (5.74%).
Chart 4
Non-performing loans by reference period
(EUR billions; percentages)
Source: ECB.
Chart 5
Non-performing loans ratios by country for the fourth quarter of 2020
(percentages)
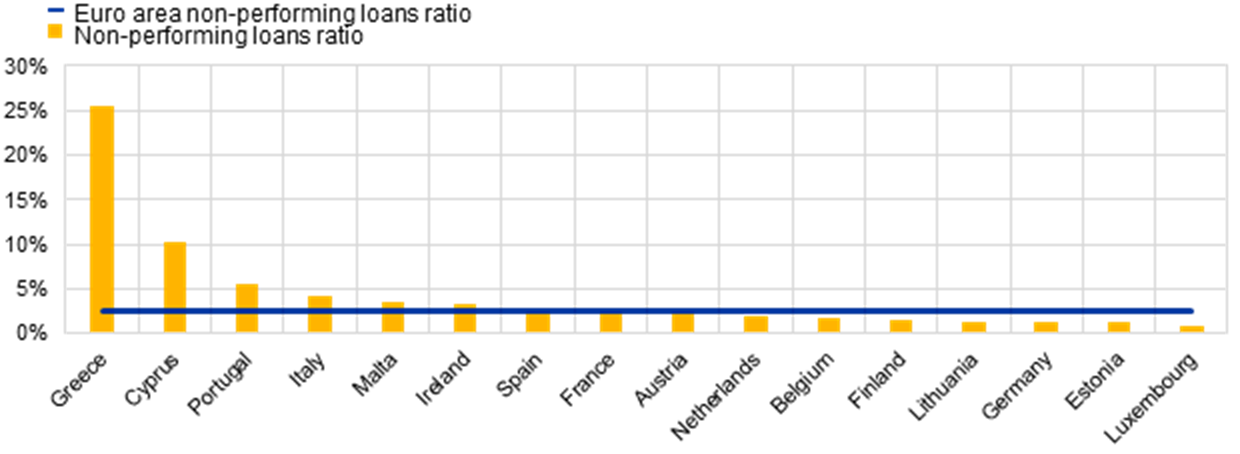
Source: ECB.
Note: Some countries participating in European banking supervision are not included in this chart, either for confidentiality reasons or because there are no significant institutions at the highest level of consolidation in that country.
Chart 6
Non-performing loans ratios by business model for the fourth quarter of 2020
(percentages)
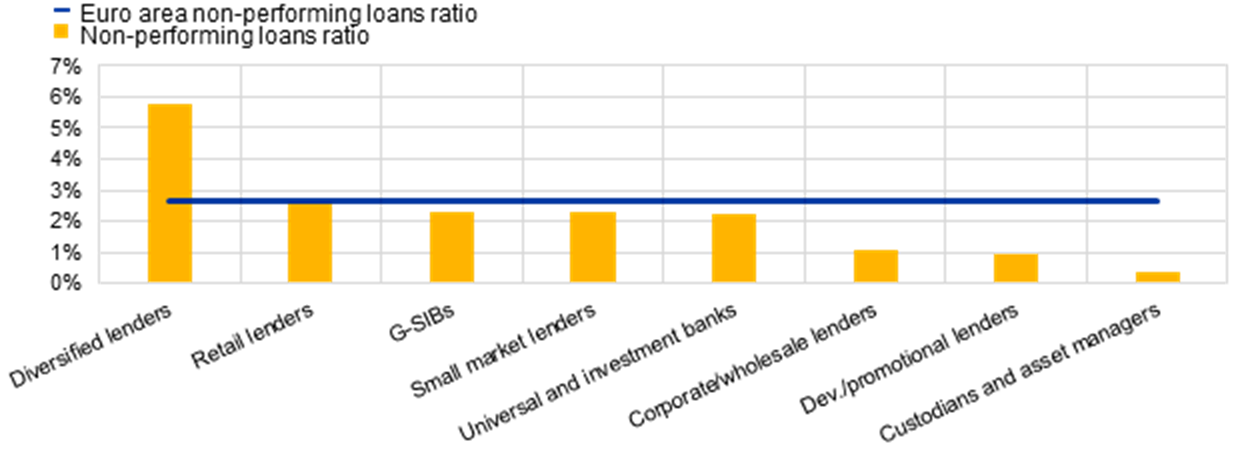
Source: ECB.
Note: “Dev./promotional lenders” refers to development and promotional lenders; “retail lenders” refers to retail and consumer credit lenders.
Return on equity
The annualised return on equity (RoE) stood at an aggregate level of 1.53% in the fourth quarter of 2020 − down from 5.16% a year earlier. This development was driven by a decrease in aggregate net profits, mainly attributable to a significant increase in impairments and provisions and a fall in operating income.
Chart 7
Return on equity and composition of net profit and loss by reference period
(EUR billions; percentages)
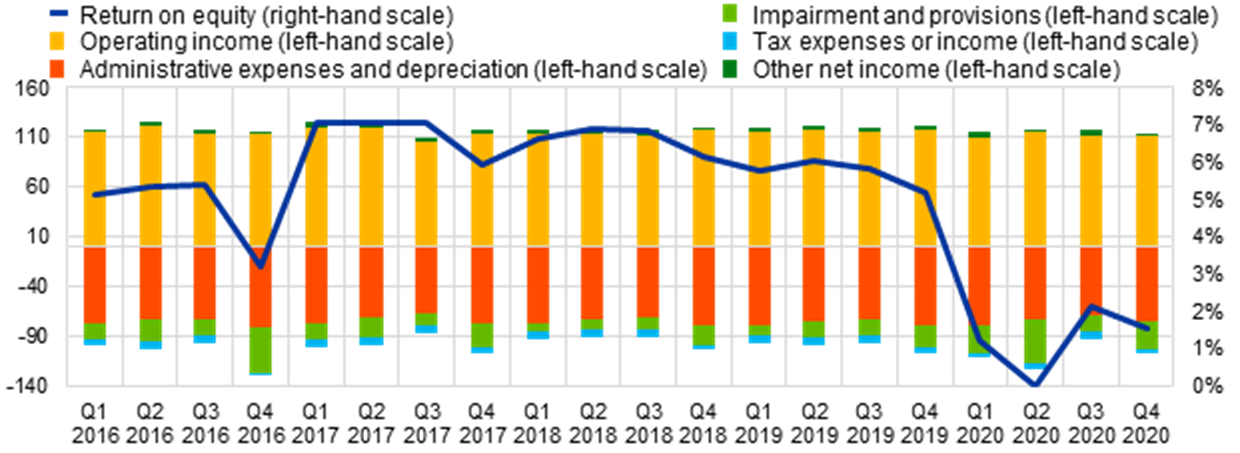
Source: ECB.
Liquidity
The aggregate liquidity coverage ratio rose continuously in 2020, standing at 171.78% in the fourth quarter of the year (up from 145.93% in the fourth quarter of 2019). The upward trend compared with a year previously was driven mainly by a significant increase in the aggregate liquidity buffer, in particular during the first three quarters of 2020.
Chart 8
Liquidity coverage ratio by reference period
(EUR billions; percentages)
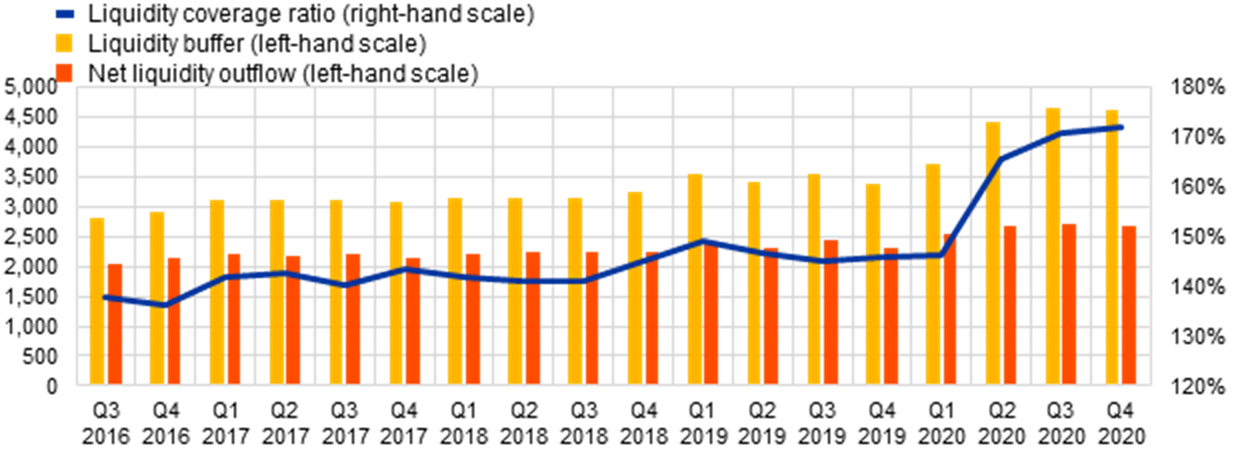
Source: ECB.
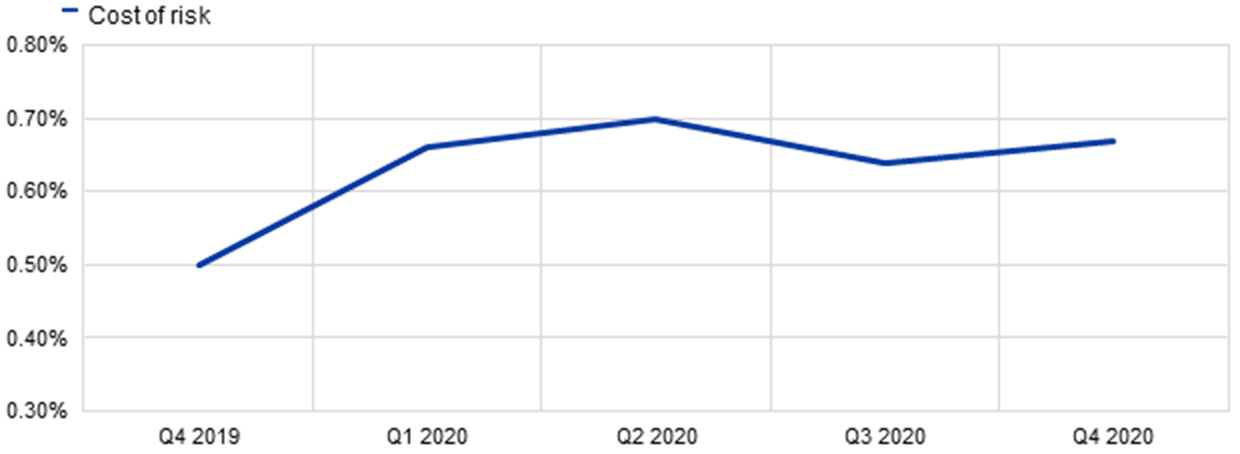
Cost of risk
With this data release, the ECB is publishing statistics on cost of risk for the first time. Cost of risk is the ratio of the adjustments in allowances for estimated loan losses during the relevant period (annualised) divided by the total amount of loans and advances subject to impairment. The aggregate cost of risk for significant institutions increased during 2020, reaching 0.67% in the fourth quarter, up from 0.50% a year earlier.
Chart 9
Cost of risk by reference period
(percentages)
Source: ECB.
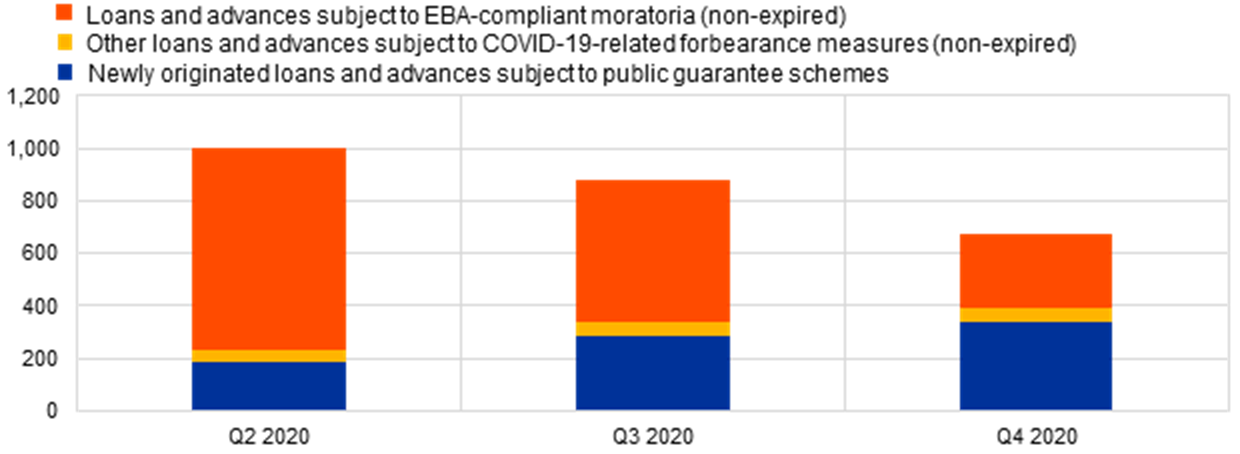
Loans and advances subject to COVID-19-related measures
In response to the outbreak of the coronavirus (COVID-19) pandemic, data on loans and advances subject to COVID-19-related measures have been collected on the basis of reporting standards developed by the European Banking Authority. In the fourth quarter of 2020 non-expired loans and advances subject to EBA-compliant moratoria decreased to €282 billion, from €766 billion in the second quarter of 2020. In the same period newly originated loans and advances subject to public guarantee schemes increased to €340 billion (from €183 billion in the second quarter). Other loans and advances subject to COVID-19-related forbearance measures (non-expired) remained broadly stable and stood at €50 billion at the end of 2020.
Chart 10
Loans and advances subject to COVID-19-related measures by reference period
(EUR billions)
Source: ECB.
Factors affecting changes
Supervisory banking statistics are calculated by aggregating the data that are reported by banks which report COREP (capital adequacy information) and FINREP (financial information) at the relevant point in time. Consequently, changes in the amounts shown from one quarter to another can be influenced by the following factors:
- changes in the sample of reporting institutions;
- mergers and acquisitions;
- reclassifications (e.g. portfolio shifts as a result of certain assets being reclassified from one accounting portfolio to another).
For media queries, please contact Philippe Rispal, tel.: +49 69 1344 5482.
Notes
- The complete set of Supervisory banking statistics with additional quantitative risk indicators is available on the ECB’s banking supervision website.
Európska centrálna banka
Generálne riaditeľstvo pre komunikáciu
- Sonnemannstrasse 20
- 60314 Frankfurt nad Mohanom, Nemecko
- +49 69 1344 7455
- media@ecb.europa.eu
Šírenie je dovolené len s uvedením zdroja.
Kontakty pre médiá