Aggregated results of SREP 2023
1 Introduction
The 2023 Supervisory Review and Evaluation Process (SREP) for banks supervised by the ECB took place during a period of uncertainty about both the economic outlook and the dynamics in financial markets. The banking sector continues to show strength. It has maintained robust capital and liquidity positions against the backdrop of an uncertain economic environment, Russia’s war against Ukraine, high inflation leading to fast-paced interest rate hikes, and market turmoil following the bank failures in the United States and Switzerland. Euro area banks remained resilient to spill-over effects from these events thanks to both the existence of a diversified deposit base and levels of unrealised losses that were only a fraction of those of some banks in the United States.
The overall SREP score remained stable at 2.6, but with changes compared to the previous cycle for several banks. In line with the EBA Guidelines on SREP, the overall SREP score, which ranges from 1 to 4, reflects the supervisor’s overall assessment of the viability of the institution: higher scores reflect higher risks to the viability of the institution stemming from one or more features of its risk profile.
The overall capital requirements and guidance increased slightly to 15.5% of risk-weighted assets (RWA) on average, from 15.1% in the 2022 SREP cycle. This was driven by changes in risk profiles and in the non-performing exposure (NPE) shortfall, as well as several Member States reintroducing or increasing countercyclical capital buffers (CCyB). The P2R in total capital increased slightly and stands at 2.25% compared with 2.15% last year. For six banks, a Pillar 2 requirement concerning the leverage ratio (P2R-LR) add-on was applied and eight banks received a leveraged finance (LF) add-on. Pillar 2 Guidance for the risk of excessive leverage was set for seven banks.
Qualitative measures are a key component of the supervisory toolkit and were issued primarily to address deficiencies in the areas of internal governance, credit risk and capital adequacy. Measures related to liquidity risk and interest rate risk in the banking book (IRRBB) increased considerably, triggered by the changing macro-financial landscape. ECB Banking Supervision stepped up its efforts to address long outstanding findings and overdue measures.
ECB Banking Supervision observed significant improvements in the euro area banking sector. Most notably, profitability returned to levels not seen in more than a decade. Benefiting from boosted interest income and net interest margins, aggregate return on equity was 7.7% in 2022 compared with 6.7% in 2021. It further improved in the first half of 2023, reaching 10.0%. The cost/income ratio decreased slightly as income outpaced growth in operating expenses.
In addition, asset quality stabilised, with the ratio of non-performing loans (NPLs) decreasing from 2.4% in the second quarter of 2022 to 2.3% in the second quarter of 2023. While a slight increase of NPL is observed quarter-on-quarter in 2023, these figures are testimony to banks being better equipped overall also as a result of the supervisory scrutiny of credit controls and past experience of NPL resolution.
Finally, the results of the 2023 EU-wide stress test show that the banking sector would be able to withstand a severe economic downturn, as captured in the harshest adverse stress test scenario applied since the start of European banking supervision.
In the current SREP cycle, supervisors continued to view banks’ situation with caution, in particular concerning the sustainability of the surge in profitability. Sources of core revenues other than interest income increased only moderately. At the same time disruptions in the macroeconomic environment had the potential to affect lending volumes, operational costs, and impairments.
Supervisors also remained prudent about credit risk stemming from exposures towards vulnerable sectors such as real estate, which showed signs of deterioration. ECB Banking Supervision took practical steps to tackle concerns about commercial real estate (CRE) and residential real estate (RRE). The focus was on loan origination, as well as IFRS 9, in areas such as overlays, quantification practices and their governance.
Similarly, and despite the progress made by significant institutions over the last few years, internal governance and risk management remained an area of attention for ECB Banking Supervision. The main findings were linked to the effectiveness of management bodies, internal control functions and IT systems, as well as risk data aggregation and reporting.
Going forward, apart from near-term risks linked to the macro-financial landscape, banks are encountering medium-term threats and opportunities including the digitalisation of finance. Banks need to continue their efforts to stabilise profitability on a higher level and to enhance the sustainability of their business models. The prevailing geopolitical climate and banks' growing dependence on IT critical third-party providers are a concern, given the notable rise in operational and IT/cyber risks. This underscores the need for banks to address structural inadequacies in their outsourcing set-ups, as well as to enhance their IT security and cyber resilience frameworks. Furthermore, ECB Banking Supervision has stepped up measures to ensure banks adequately identify, assess, and manage climate-related and environmental (C&E) risks, while transparently disclosing the risks they are exposed to.
This report summarises the outcome of the 2023 SREP cycle. Chapter 2 covers the assignment of SREP scores to banks’ overall risk profiles and their main elements. Chapter 3 sets out the determination of the Pillar 2 capital requirement (P2R) and guidance (P2G) and Chapter 4 discusses qualitative measures. Chapter 5 contains a detailed analysis of selected elements identified as supervisory priorities for 2023-2025.
Details on the SREP can be found in the SREP methodology.
2 Evolution of scores
2.1 Key messages
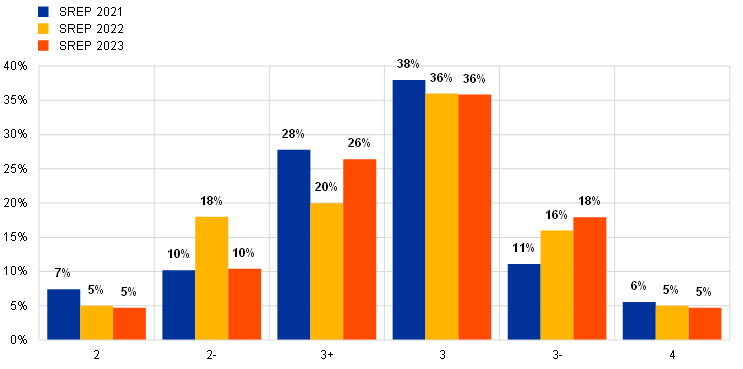
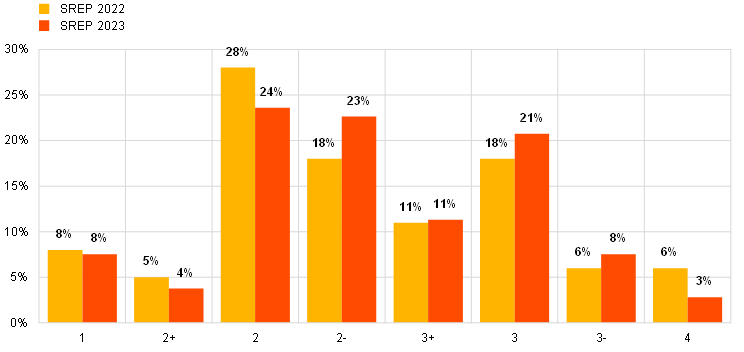
The average overall SREP score for 2023 remained stable at 2.6, but the distribution across buckets changed slightly (Chart 1). The share of banks with scores of 2-, 3 and 3- increased, while the share of banks with scores of 2+, 2 and 4 decreased. Supervisors continued to exercise caution in their assessments, amid the ongoing effects of the Russian war in Ukraine, persisting high inflation leading to a more restrictive monetary policy, and the crisis at certain banks in the United States and Switzerland.
Chart 1
(percentages)
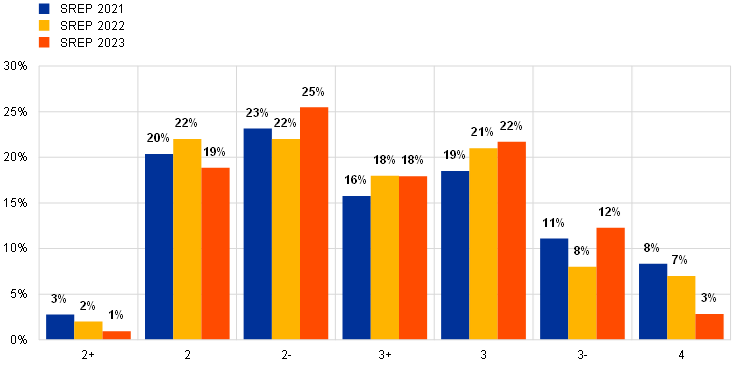
Source: ECB (SREP Database).
Notes: 2021 SREP values based on 108 decisions; 2022 SREP values based on 101 decisions; 2023 SREP values based on 106 decisions. There are no banks with an overall SREP score of 1 in either 2021, 2022 or 2023. Rounding differences may apply to data throughout the document. All data shown throughout the document relate to significant institutions directly supervised by the ECB.
In 2023 71% of institutions received the same overall SREP score as in 2022, while 14% saw their scores worsen and 15% improve (Chart 2).
Chart 2
Changes to banks’ overall SREP scores in 2023 relative to 2022
(percentages)
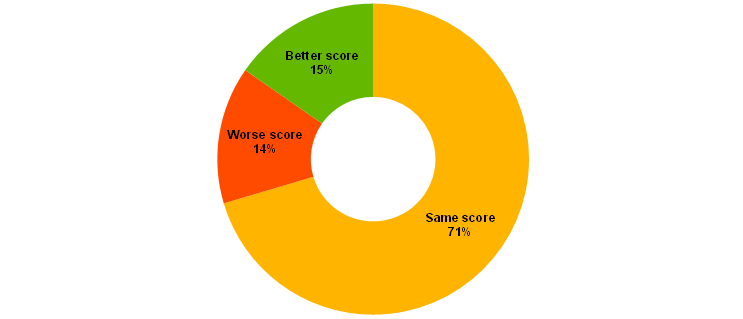
Source: ECB (SREP Database).
Note: This chart is based on a sub-sample of banks that were assessed in both the 2022 and 2023 SREP cycles, meaning that the coverage differs slightly from that of the data in Chart 1.
Table 1 shows the migration of the overall SREP score with qualifiers compared to last year. While there is broad stability in the overall SREP scores year on year, the underlying composition of risk-specific scores has changed. This reflects the detailed supervisory assessment of banks’ improvement or deterioration in many areas. Looking back over a longer time horizon the overall SREP scores show a higher degree of variability than is observed for 2022-23.
Table 1
Transition matrix for the overall SREP score
(percentages)
2023 | ||||||||
|---|---|---|---|---|---|---|---|---|
2+ | 2 | 2- | 3+ | 3 | 3- | 4 | ||
2+ | 50.0% | 50.0% | 0.0% | 0.0% | 0.0% | 0.0% | 0.0% | |
2 | 0.0% | 77.3% | 22.7% | 0.0% | 0.0% | 0.0% | 0.0% | |
2- | 0.0% | 9.1% | 81.8% | 9.1% | 0.0% | 0.0% | 0.0% | |
2022 | 3+ | 0.0% | 0.0% | 18.8% | 56.3% | 25.0% | 0.0% | 0.0% |
3 | 0.0% | 0.0% | 0.0% | 23.8% | 66.7% | 9.5% | 0.0% | |
3- | 0.0% | 0.0% | 0.0% | 0.0% | 12.5% | 87.5% | 0.0% | |
4 | 0.0% | 0.0% | 0.0% | 0.0% | 0.0% | 57.1% | 42.9% | |
Source: ECB (SREP Database).
Note: This table is based on a sub-sample of banks that were assessed in both the 2022 and 2023 SREP cycles, meaning that the coverage differs slightly from that of the data in Chart 1.
2.2 Breakdown by business model
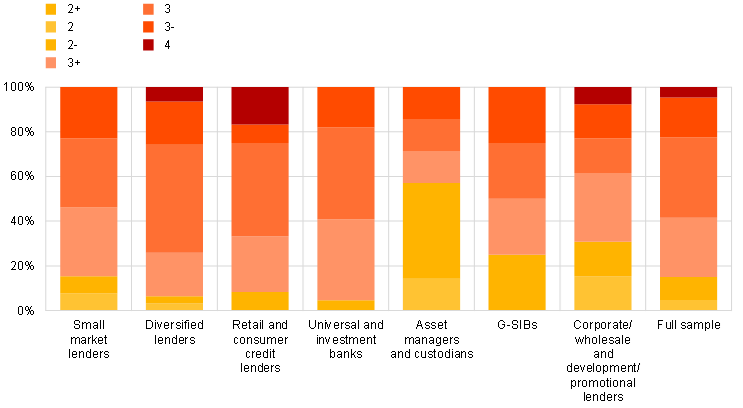
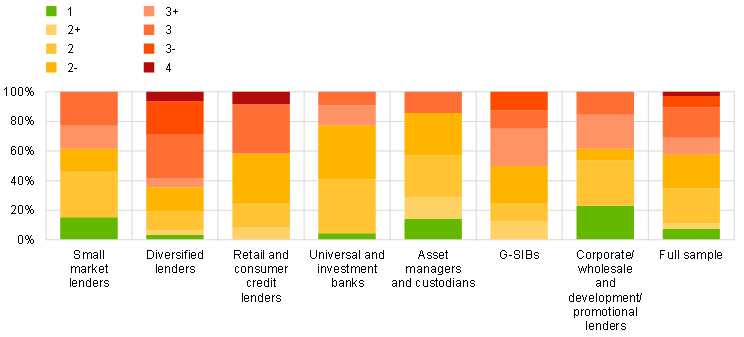
Chart 3 shows the distribution of overall SREP scores in 2023 for different business models. Similarly, to last year, the overall SREP scores lie in the range of 2 to 3-. A number of developments were also observed.
- A majority of asset managers and custodians, as well as a smaller number of small market lenders and corporate/wholesale and development/promotional lenders, have a score of up to 2-, in line with last year. This is underpinned by two factors. First, they have limited involvement in traditional loan lending compared with other business models. Second, their business model is the most profitable one compared with banks under European banking supervision.
- More than half of retail and consumer credit lenders as well as more than half of diversified lenders continued to retain a score 3+ or worse. For the retail and consumer credit lenders, this is rooted in weaknesses in management bodies and risk culture, together with deficiencies in their internal control functions.
- All the institutions obtaining a score of 4 belong to the same business model categories: retail and consumer credit lenders, and diversified lenders. Compared with last year, however, fewer diversified lenders have a score of 4. Their scores are partially driven by their asset quality, which is still vulnerable to macroeconomic conditions, despite the continuous reduction in NPLs.
- More details on the distribution of the overall capital requirements and guidance by business model are available in Chapter 3. The distribution of scores with qualifier by risk can be found in Chapter 5, which also includes the supervisory expectations and the key vulnerabilities to be addressed.
Chart 3
Breakdown of overall SREP scores by business model
(percentages)

Source: ECB (SREP Database).
Notes: 2023 SREP values based on 106 decisions. Corporate/wholesale lenders and development/promotional lenders have been grouped together in this chart to preserve statistical confidentiality.
3 Capital requirements and guidance
3.1 Key messages
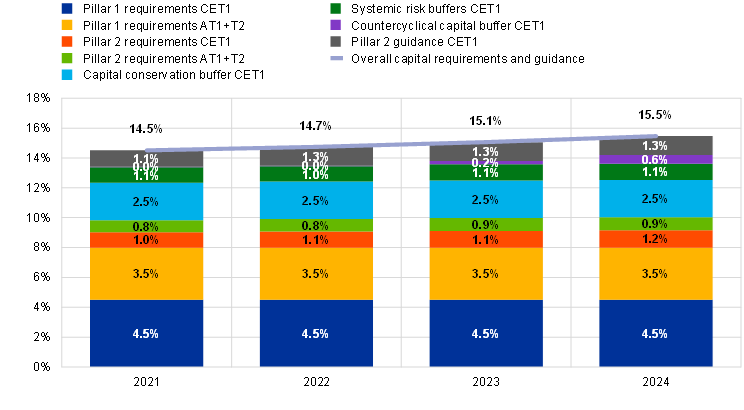
Based on the 2023 SREP, the aggregate capital requirements applicable for 2024 increased slightly at 15.5% of RWA, compared with 15.1% in 2023 (Chart 6). This is largely driven by the dynamics of macroprudential buffers.
The total capital P2R remains on average largely in line with the requirements set out in previous years, at around 2.1% of RWA. This figure includes NPE and LF add-ons (Section 3.2). The median P2R in total capital increased slightly and stands at 2.25% compared with 2.15% last year, while the interquartile range narrowed.
Chart 4
Distribution of total capital P2Rs
(percentages of RWA)
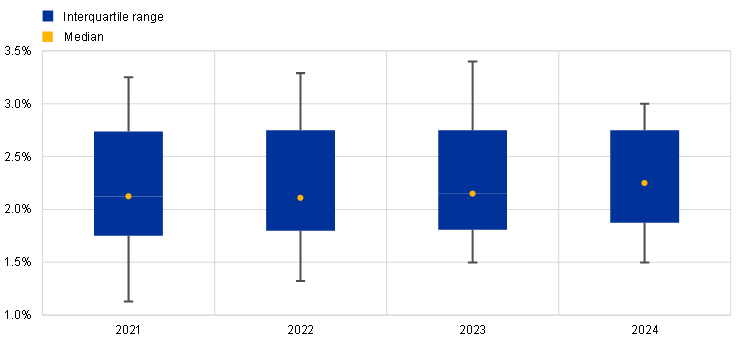
Sources: ECB Supervisory Banking Statistics and SREP Database.
Notes: The sample selection follows the Supervisory Banking Statistics (SBS) methodological note for 2021 (Q1 2021 SBS sample based on 114 entities), 2022 (Q1 2022 SBS sample based on 112 entities) and 2023 (Q1 2023 SBS sample based on 111 entities). For 2024, the sample is based on 107 entities with applicable P2Rs in January 2024. The chart shows P2Rs according to the year of applicability (i.e., 2024 data include P2Rs decided on in the 2023 SREP cycle and applicable in 2024).
P2Rs for Common Equity Tier 1 (CET1) capital increased slightly with an average of 1.2% (compared with 1.1% in 2022), and a median of 1.27% compared with 1.21% last year. The CET1 P2R interquartile range of 2024 is the smallest observed in recent years, between 1.07% and 1.55% (Chart 5).
Chart 5
(percentages of RWA)
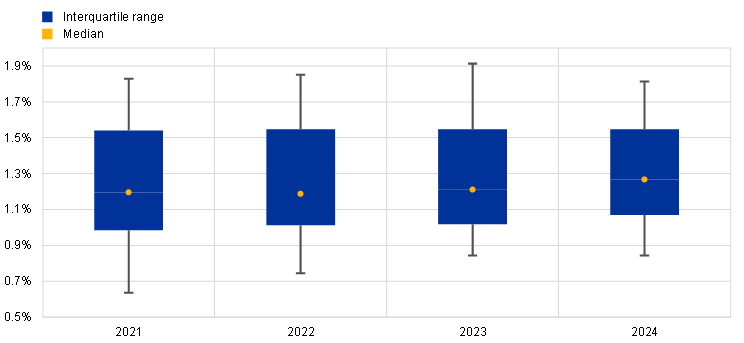
Sources: ECB Supervisory Banking Statistics and SREP Database.
Notes: The sample selection follows the Supervisory Banking Statistics (SBS) methodological note for 2021 (Q1 2021 SBS sample based on 114 entities), 2022 (Q1 2022 SBS sample based on 112 entities) and 2023 (Q1 2023 SBS sample based on 111 entities). For 2024, the sample is based on 107 entities with applicable P2Rs in January 2024. The chart shows P2Rs according to the year of applicability (i.e. 2024 includes P2Rs decided on in the 2023 SREP cycle and applicable in 2024).
Chart 6 shows the evolution over time of overall capital requirements and guidance. In 2022 and 2023 several national competent authorities announced that they would either introduce or increase the CCyB and systemic risk buffers applicable as of 2023 and 2024. The change in the overall capital requirements and guidance was mainly driven by a rise in the aggregate CCyB from 0.22% as of the first quarter of 2023 to 0.58%, estimated for the first quarter of 2024.
Chart 6
Evolution of overall capital requirements and P2G – the total capital stack
(percentages of RWA)
Source: ECB Supervisory Banking Statistics and SREP Database.
Notes: The sample selection follows the Supervisory Banking Statistics (SBS) methodological note 2021 (Q1 2021 SBS sample based on 114 entities), 2022 (Q1 2022 SBS sample based on 112 entities) and 2023 (Q1 2023 SBS sample based on 111 entities). For 2024, the sample is based on 107 entities with applicable P2Rs in January 2024. The chart shows RWA-weighted data as at Q2 2023. “Overall capital requirements” means Pillar 1 minimum requirements + Pillar 2 requirements + combined buffer requirement [capital conservation buffer + systemic buffers (G-SII, O-SII, systemic risk buffer) + CCyB]. The reference period for the combined buffer requirement is Q1 in each year. For Q1 2024 the buffers are estimated based on announced rates applicable at this date. P2G is added on top of overall capital requirements. Under the Capital Requirements Directive V (CRD V), P2R capital should have the same composition as Pillar 1, i.e. at least 56.25% should be CET1 and at least 75% Tier 1. By way of derogation from the first sub-paragraph of the CRD V, the competent authority may require the institution to meet its additional own funds requirement with a higher portion of Tier 1 capital or Common Equity Tier 1 capital, where necessary and having regard to the specific circumstances of the institution.
The EU-wide stress test coordinated by the European Banking Authority, complemented by the Single Supervisory Mechanism (SSM)-wide capital stress test was performed in 2023. Despite the overall P2G being on average stable at 1.3%, individual requirements changed in line with the relevant bank-specific stress test depletions. This was to provide coverage for unforeseen events. The final results of the 2023 stress test of euro area banks were published on 28 July 2023.
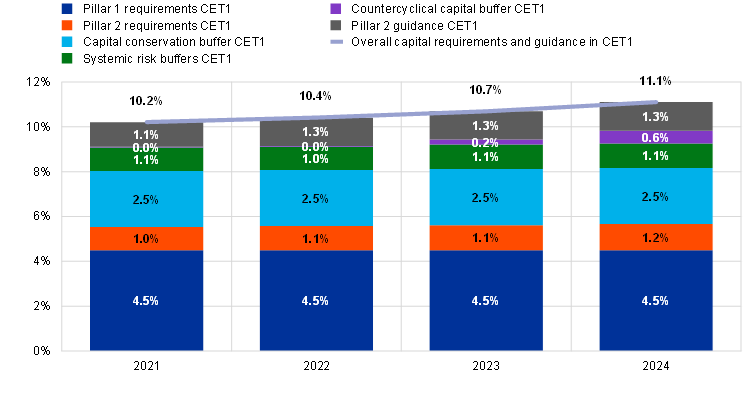
Chart 7 shows the overall capital requirements and P2G to be met with CET1 capital[1]. The average increased slightly to 11.1%, compared with 10.7% in 2023. This brings capital requirements and P2G closer to the pre-pandemic level of 11.3% that was applicable in 2020.
Chart 7
Evolution of overall capital requirements and P2G in CET1
(percentages of RWA)
Sources: ECB Supervisory Banking Statistics and SREP Database.
Notes: The sample selection follows the Supervisory Banking Statistics (SBS) methodological note 2021 (Q1 2021 SBS sample based on 114 entities), 2022 (Q1 2022 SBS sample based on 112 entities) and 2023 (Q1 2023 SBS sample based on 111 entities). For 2024, the sample is based on 107 entities with applicable P2Rs in January 2024. The chart shows RWA-weighted data as at Q2 2023. “Overall capital requirements” means Pillar 1 minimum requirements + Pillar 2 requirements + combined buffer requirement [capital conservation buffer + systemic buffers (G-SII, O-SII, systemic risk buffer) + CCyB]. The reference date for the combined buffer requirement is Q1 in each year. For Q1 2024 the buffers are estimated based on announced rates applicable at this date. P2G is added on top of overall capital requirements. Under the CRD V, P2R capital should have the same composition as Pillar 1, i.e. at least 56.25% should be CET1 and at least 75% Tier 1.
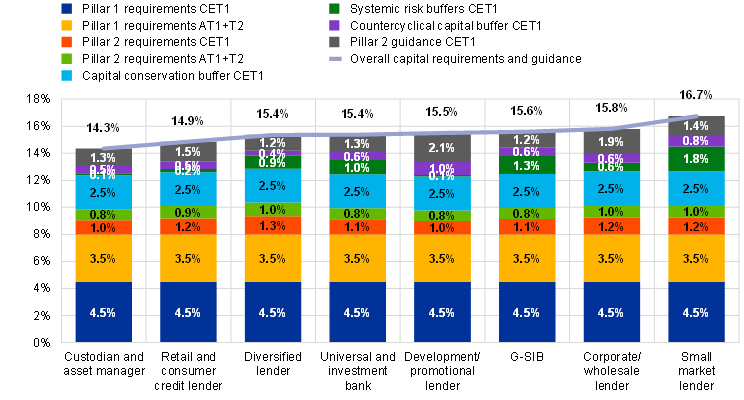
Chart 8 shows the breakdown of average capital requirements and guidance for each business model applicable in 2024, with estimated values for the combined buffer requirement for the first quarter of 2024. The overall capital requirements and guidance are set at the highest level for small market lenders, corporate and wholesale lenders, G-SIBs, and development and promotional lenders. In terms of P2Rs, requirements are set at a comparatively high level for diversified lenders, followed by small market lenders and corporate and wholesale lenders, and then retail and consumer credit lenders. The differences in quantitative requirements reflect diverse risk profiles and the possibility that, in some cases, risk may already be addressed effectively by qualitative requirements.
Chart 8
Overall capital requirements and guidance by business model
(percentages of RWA)
Sources: ECB Supervisory Banking Statistics and SREP Database.
Notes: The sample is based on 107 entities with applicable P2Rs in January 2024. The chart shows RWA-weighted data as at Q2 2023. “Overall capital requirements” means Pillar 1 minimum requirements + Pillar 2 requirements + combined buffer requirement [capital conservation buffer + systemic buffers (G-SII, O-SII, systemic risk buffer) + CCyB]. The reference period for the combined buffer requirement is Q1 in each year. For Q1 2024 the buffers are estimated based on announced rates applicable at this date. P2G is added on top of overall capital requirements. Under the CRD V, P2R capital should have the same composition as Pillar 1, i.e. at least 56.25% should be CET1 and at least 75% Tier 1.
As regards leverage-based own funds requirements, in six cases a P2R-LR (on average 10 basis points) was assigned and in another seven cases a P2G-LR add-on (on average 37 basis points) was designated. In line with the backstop nature of the leverage-based capital stack, these add-ons had only a limited impact on the relevant banks. This is because for most banks total leverage-based own funds requirements in nominal terms are lower than risk-based own funds requirements. Overall, the risk of excessive leverage is considered to be low.
3.2 NPE Pillar 2 requirement add-on
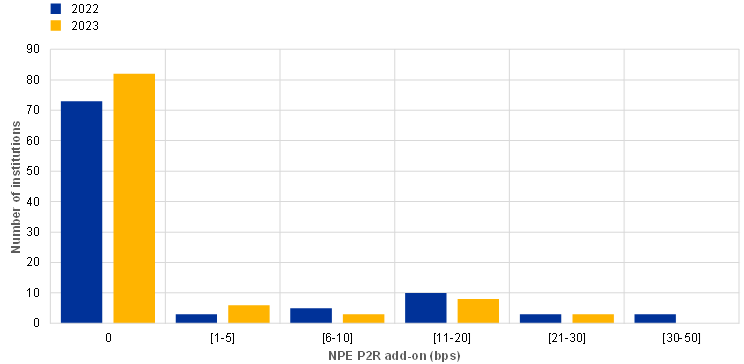
The 2023 SREP cycle resulted in NPE P2R add-ons for 20 significant institutions[2]. In these cases, a shortfall was identified relative to the ECB’s coverage expectations, as the cover for risks arising from aged NPEs was assessed to be inadequate.
Chart 9
NPE shortfall add-ons
(total, basis points)
Source: ECB internal calculations.
The relevant institutions have been encouraged to close these provisioning gaps by posting the maximum level of provisions permitted under the relevant accounting standards. If the accounting treatment does not match the prudential provisioning expectations, institutions also have the option of adjusting their CET1 capital on their own initiative.
Many institutions took action to further reduce the shortfall in the course of 2023, which helped push the aggregate shortfall in NPE provisions down from 12.5 basis points to 5.9 basis points over the year. This compares with a final aggregate shortfall of 7 basis points in the previous SREP cycle.
The institutions can ask for their P2R add-ons linked to NPE coverage shortfalls to be updated at three quarterly time windows if they reduce their NPE coverage shortfall during the year. They can reduce the shortfall by means of further NPE disposals, increases in provisions, or voluntary deductions from their CET1 capital. The add-ons imposed on three institutions in 2022 were reduced in 2023.
For a few significant institutions with persistent and material shortfalls arising from older NPEs, the P2R add-on was imposed fully in the form of CET1.
4 Qualitative measures
4.1 Key messages
Qualitative measures were issued for 103 of the significant institutions in the 2023 SREP cycle, to address supervisory findings.
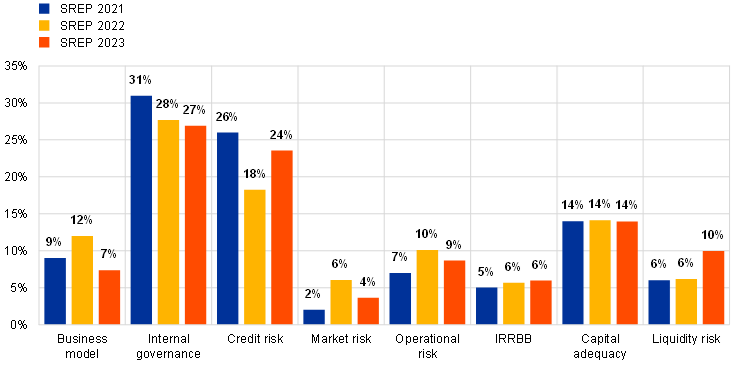
Most new SREP measures address deficiencies in internal governance (27%), credit risk (24%) and capital adequacy (14%).
- Measures to mitigate deficiencies in internal governance and risk management have been imposed on 74% of significant institutions – the highest percentage across all types of measures (Chart 10) in line with the SSM supervisory priorities for 2023-2025. Overall, similarly to last year, the deficiencies identified mainly relate to the management body, risk management framework, internal audit function, compliance function, and risk data aggregation and reporting. These areas have also been flagged as areas for scrutiny in the SSM supervisory priorities for 2024-26.
- Measures related to credit and liquidity risk increased their share in the total number of measures issued in 2023. In absolute terms, there has also been an increase in the number of measures addressing liquidity risk and IRRBB in 2023. Finally, measures relating to capital adequacy and the Internal Capital Adequacy Assessment Process (ICAAP), as well as to profitability, marginally decreased compared with the previous year.
Chart 10
(percentages)
Source: ECB (SREP Database).
Notes: 2021 SREP values based on 108 decisions; 2022 SREP values based on 101 decisions; 2023 SREP values based on 106 decisions. This chart does not include weaknesses addressed by supervisory actions outside of the SREP cycles.
4.2 Distribution of qualitative measures
Chart 11 shows a breakdown by business model of qualitative measures issued in the 2023 SREP cycle. As in the previous year, diversified lenders had the highest number of SREP measures, both in absolute terms – as it is the largest business model category – and in relative terms, averaging around nine per bank. Asset managers and custodians, development and promotional lenders, and corporate and wholesale lenders had the lowest number of qualitative measures in relative terms, averaging fewer than six per bank.
Chart 11
Breakdown of qualitative measures by business model
(percentages)

Source: ECB (SREP Database).
Notes: 2023 SREP values based on 106 decisions. This chart does not include weaknesses addressed by supervisory actions outside of the 2023 SREP cycle. Corporate/wholesale lenders and development/promotional lenders have been grouped together in this chart to preserve statistical confidentiality.
For banks with an overall SREP score of 4, an average of 16 qualitative measures were issued while for banks with a score of 3, the average was ten (Chart 12). Among banks with a score of 4, operational risk measures were the most common type. For further information on qualitative measures, please refer to Chapter 5.
Chart 12
Average number of qualitative measures by overall SREP score
(totals)
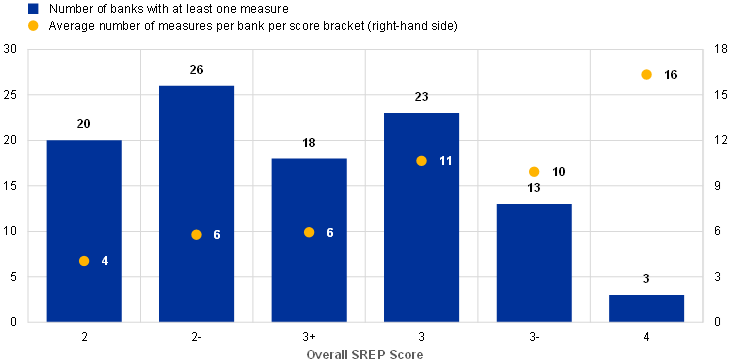
Source: ECB (SREP Database).
Notes: 2023 SREP values based on 106 decisions. There are no banks with an overall SREP score of 1. This chart does not include weaknesses addressed by supervisory actions outside of the 2023 SREP cycle.
5 Detailed analysis
5.1 Element 1: Business model
5.1.1 Key messages
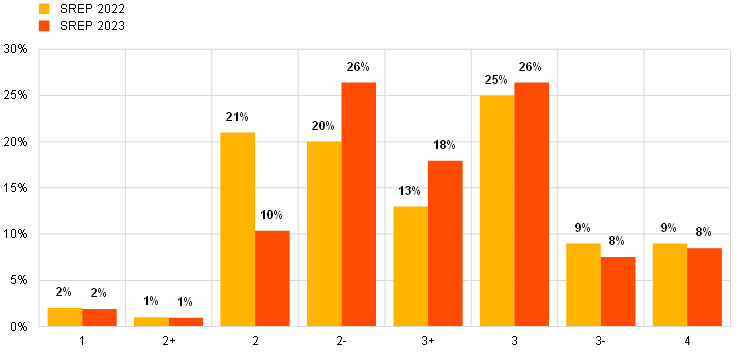
Banks' profits burgeoned at the start of 2022, with further increases in 2023, after a decade of constrained profitability due to the ultra-low interest rate environment. Nonetheless, supervisors continue to exercise caution when assessing the sustainability of business models. The recent improvement led to 25% of scores increasing in the SREP 2023 cycle, outweighing the 15% of scores that deteriorated (Chart 13).
In 2022 the aggregate return on equity (ROE) of banks directly supervised by the ECB rose by one percentage point with respect to 2021 to 7.7%. In contrast with 2021, when a reduction in loan loss provisions was the main factor behind improving profitability, the increase in 2022 was largely driven by higher core revenues. Rising interest margins helped to boost profitability – especially in countries with large volumes of variable-rate lending – as banks slowly adjusted their deposit rates. Net fee and commission income (NFCI) also increased, but by far less than in 2021. Expenses continued to rise, but at a slower pace than inflation. Earnings results from the first half of 2023 show a continuation of this trend. Profitability improved further on the back of higher net interest income (NII), despite lower NFCI and higher costs.
Supervisory measures in the SREP 2023 cycle addressed the main shortcomings: the need for improvements in banks’ strategies (change or plan updates, governance, and implementation); profitability monitoring and forecasting; and the need to impose additional reporting requirements.
Chart 13
Element 1: Business model SREP scores
(percentages)
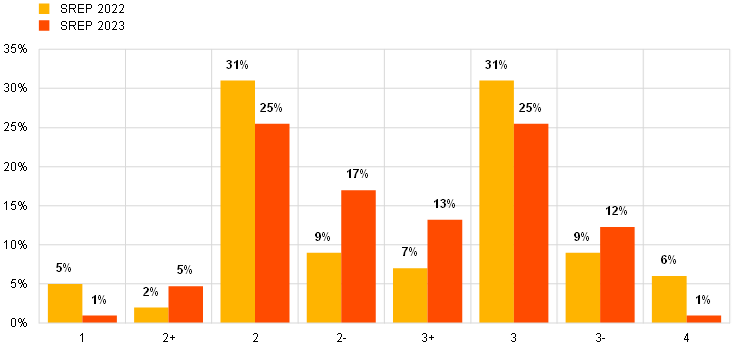
Source: ECB (SREP Database).
Note: 2021 SREP values based on 108 decisions; 2022 SREP values based on 101 decisions; 2023 SREP values based on 106 decisions. Qualifiers were introduced in SREP 2022.
5.1.2 Breakdown by business model
Chart 14 shows the distribution of business model SREP scores across significant institutions with different types of business model.
Chart 14
Breakdown of business model SREP scores by business model
(percentages)
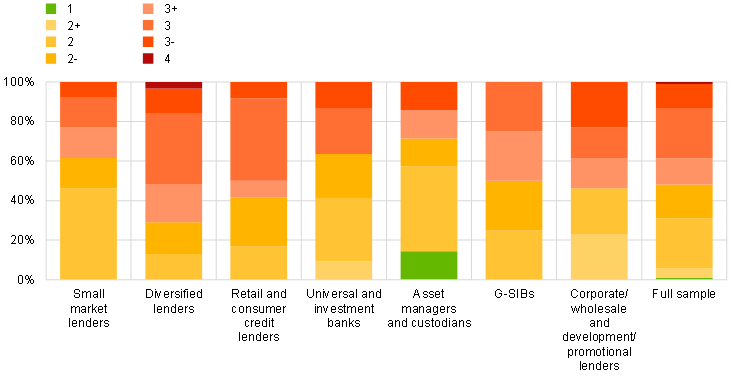
Source: ECB (SREP Database).
Notes: 2023 SREP values based on 106 decisions. Corporate/wholesale lenders and development/promotional lenders have been grouped together in this chart to preserve statistical confidentiality.
The sustainability of banks’ business models continues to face the same headwinds: strategic execution risks; inflationary pressures coupled with macroeconomic uncertainties and forward-looking assumptions for pass-through rates; and opportunities and threats arising from digitalisation and climate change (Section 5.5.3). The key developments specific to the individual peer groups in the SREP 2023 cycle were as follows.
- For G-SIBs, SREP scores for business model risk in 2023 remained stable on average compared with 2022, though there were some positive and negative changes for individual banks. Improvements were noted in the areas of overall profitability, income generation, and decreased cost bases, which were supported by strategic transformation efforts.
- Universal banks benefited from the favourable NII environment, while NFCI lost steam. Some deteriorations were noted, driven by concerns about the evolution of profitability due to potential increases in funding costs and the cost of risk in specific portfolios.
- Diversified lenders saw a major improvement, with 13 banks achieving higher scores and 15 banks scoring the same as in 2022. The score changes were backed by a significant boost in profitability on the back of both higher NII and cost-cutting measures implemented through restructuring and business transformation efforts.
- Investment banks experienced a deterioration in profitability and revenue generation capacity, driven by downward trends in equity and capital markets. Though some banks achievement an improvement, their cost bases generally remained excessively high, affected by revenue and cost-sharing arrangements with parent entities. Other areas in need of improvement were strategic governance and steering, financial planning, and forecasting.
- Corporate/wholesale lenders experienced another difficult year in terms of income generation capacity and cost efficiency. Most banks were unable to benefit fully from the increase in interest rates, due to deficiencies in asset and liability management and competitive, low margin business.
- Promotional/development lenders remain the peer group with the strongest business model score. This is based largely on their low risk profile and simple business model. Nevertheless, some downgrades in the business model scores did take place, caused by idiosyncratic events with a potential impact on future sustainability.
- Retail and consumer credit lenders remained one of the weakest peer groups in terms of income generation and overall profitability, affected by some large one-offs and the increase in the cost base in the SREP 2023 cycle. Their high product and geographical concentration risks leave them vulnerable to the local macroeconomic environment, while adequate financial projections and profitability forecasting are imperative if they are to improve in future.
- Small market lenders were one of the strongest performing groups among institutions directly supervised by the ECB in terms of business model scores. The profitability of this peer group continued to increase, boosted by NII and large volumes of variable interest rate lending. However, headwinds persisted, including intensifying local competition and deficiencies in strategy, loan pricing and profitability forecasting.
- Asset managers and custodians also continued to be one of the most profitable business models among banks under direct supervision by the ECB. However, overall, banks were hurt by downward trends in markets, which impacted asset valuations and client activity, thus decreasing commission income.
5.1.3 Focus on business model profitability and structural factors in 2023
ROE continued to grow in 2022 for most business models, a trend that has intensified so far in 2023 (Chart 15). Year-on-year NII increased by 14%, driven by both margin and volume effects. In the fourth quarter of 2022 margins jumped, while positive contributions from volumes slowed down. Margin expansion naturally tended to be higher in those countries with a larger share of loans at variable interest rates, with complementary factors such as banks’ hedging practices also playing a role. NFCI also saw an increase in 2022, though at a much slower pace than in 2021 (3% in 2022 compared with 14% the year before). Comparing the first half of 2023 to the same period in 2022, the rise in NII further intensified, while NFCI showed a decline. In terms of net trading income, although the first half of 2022 saw a boost in revenues thanks to market volatility, it decreased in the second half of the year, falling to the three-year average.
Expenses continued to rise, albeit at lower rate than inflation, with staff expenses potentially exerting pressure going forward. Impairments of financial assets were higher in 2022, affected by one-offs related to exposures in Russia as well as the general economic context. Data from the second quarter of 2023 suggest aggregate profitability is still growing, with a 10% % ROE compared with 7.7% in 2022, and NII as a continuous driver for the record high levels.
Chart 15
Return on equity and cost of equity by business model
(percentages)
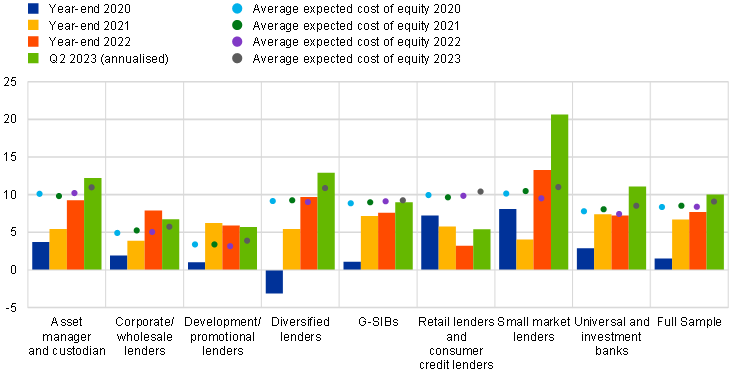
Sources: ECB Supervisory Banking Statistics and internal calculations.
Notes: Weighted average. Sample selection follows the Supervisory Banking Statistics (SBS) methodological note. Cost of equity as self-reported by significant institutions. Due to data availability constraints, the sample for cost of equity comprises a lower number of entities than the sample for return on equity. Average expected cost of equity 2023 based on 93 entities. ECB estimates (based on established methodologies) indicate a cost of equity which is three to four percentage points higher than banks’ self-reported cost of equity.
As shown in Chart 16, the cost/income ratio decreased slightly as income continued to grow faster than operating expenses on the back of positive NII developments. While operating expenses had increased by 4% year on year in 2022, this was less than half of the inflation footprint in the euro area, showing the banks’ resilience to inflationary pressures so far. In 2022 staff expenses and depreciation increased less than other administrative expenses. Banks continued to step up their efforts to cut costs, while the cost/income ratio remained structurally high (61.2% on aggregate for 2022 and 57.3% for the second quarter of 2023). This was partly due to restructuring, business transformation and transactional one-offs. In the second quarter of 2023 only custodians and asset managers, diversified lenders and small market lenders continued to show considerable cost/income ratio improvements, which were driven by both the revenue and cost sides. Development/promotional lenders saw an increase in their cost/income ratio. This was fuelled by rises in both administrative and staff expenses, and in one case by additional investments due to launching a cost efficiency programme. Structural cost inefficiencies negatively impacted retail and consumer credit lenders, with their cost/income ratios significantly outpacing the average among banks directly supervised by the ECB. While cost efficiency has improved since 2016 for both the best and the worst performing banks, the cost/income ratio of the weakest banks is still 22 percentage points higher than that of the strongest (see Box 4 “3.2. Profits boosted by higher interest rates, as banking sector faces uneven prospects”, in the Financial Stability Review). Alongside facilitating digital transformation and dedicated solutions for weaker banks, addressing structural inefficiencies remains a priority for ECB Banking Supervision.
Chart 16
Cost/income ratio by business model
(percentages)
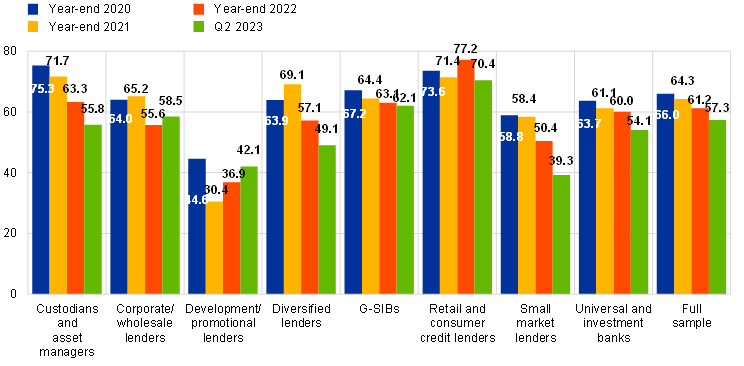
Source: ECB Supervisory Banking Statistics and internal calculations.
Notes: Weighted average. Sample selection follows the Supervisory Banking Statistics (SBS) methodological note.
5.1.4 Focus on digitalisation
This evolving field of expertise is crucial for business model sustainability. In order to build relevant knowledge, ECB Banking Supervision conducted the first data collection on digital transformation and fintech for among all banks supervised by the ECB. It is based on banks’ self-assessments combined with market intelligence.
Based on this project, ECB Banking Supervision identified several focal points. These gave shape a framework for supervisors to apply when looking into digital strategies, while remaining business model and technology neutral.
Furthermore, supervisors have initiated a cycle of detailed assessments aimed at enhancing their knowledge of banks’ digital transformation and further developing initial supervisory expectations. The outcome of this work will help supervisors to assess several aspects: the steering, execution and monitoring capabilities incorporated into banks’ digital strategies; banks’ use of digital technologies; and the risk management framework to support digital transformation. Finally, in due course ECB Banking Supervision plans to publish a guide to supervisory expectations concerning banks’ digital transformation.
5.1.5 Analysis of banks with weak business models
During the SREP 2023 cycle supervisors focused on understanding the root causes of business model weaknesses and coming up with tailor-made supervisory measures. In doing so, they also drew on the successes of these banks’ peers. It was noted that most recurring structural weaknesses are found in the areas of poor strategic planning and insufficient diversification, which are exacerbated by shortcomings in internal governance. The business model analysis for weak banks found a need for closer alignment between the SREP assessment, supervisory planning and the strategy for supervisory measures. The follow-up to this will be a multi-pronged approach in the next SREP cycle.
5.1.6 Supervisory expectations
In this SREP cycle supervisors continued to focus on tackling the long-standing issues affecting the robustness of business models: strategic issues, structural inefficiencies, and the lack of sustainability of revenues. The largest group of qualitative measures (Chart 17) relates to the need for: changes or updates to banks’ strategies (21%); improvements in strategic governance and its implementation (12%) and those related to the profitability and monitoring framework.
Chart 17
Detailed breakdown of business model-related measures
(percentages)
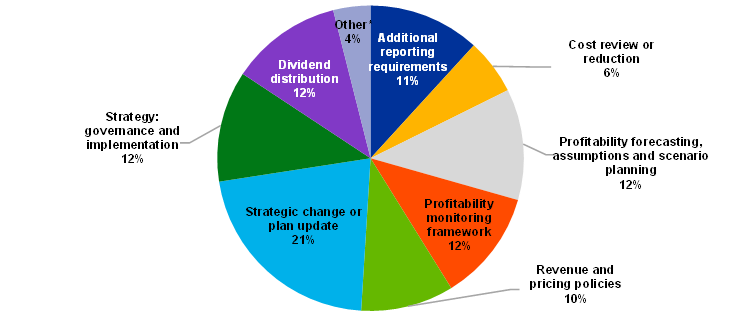
Source: ECB (SREP Database).
Notes: 2023 SREP values based on 106 decisions. This chart does not include weaknesses addressed by supervisory actions outside of the 2023 SREP cycle.
5.2 Element 2: Internal governance and risk management
5.2.1 Key messages
Despite the progress made by significant institutions over the past few years, internal governance and risk management remain areas of concern for ECB Banking Supervision. The main 2023 SREP findings on internal governance and risk management can be grouped together as follows:
- concerns about the effectiveness of management bodies, also due to their composition (including diversity and the composition of board committees), succession planning, collective suitability, and the effectiveness of the oversight role, as manifested by the absence of a strong challenge culture and/or weak decision-making.
- management bodies paying insufficient attention to internal control functions (risk management, compliance, and internal audit functions), thus hampering their operational functionality, as indicated by inadequate resources being allocated to those functions (in both qualitative and quantitative terms).
- persisting fragmented and non-harmonised IT landscapes, with low capacity for aggregating data at group level, and slow progress on the remediation programmes drawn up over recent years, which is continuing to hamper banks’ ability to swiftly produce accurate non-standard reports.
As shown in Chart 18, these issues are reflected in the internal governance and risk management scores. No bank had a score of 1 or 2+ in 2023, whereas 80% of banks had a score between 3+ and 3- and the number of banks with a score of 4 remained stable.
Chart 18
Element 2: Internal governance SREP scores
(percentages)
Source: ECB (SREP Database).
Notes: 2021 SREP values based on 108 decisions; 2022 SREP values based on 101 decisions; 2023 SREP values based on 106 decisions. There are no banks with an internal governance score of 1.
5.2.2 Breakdown by business model
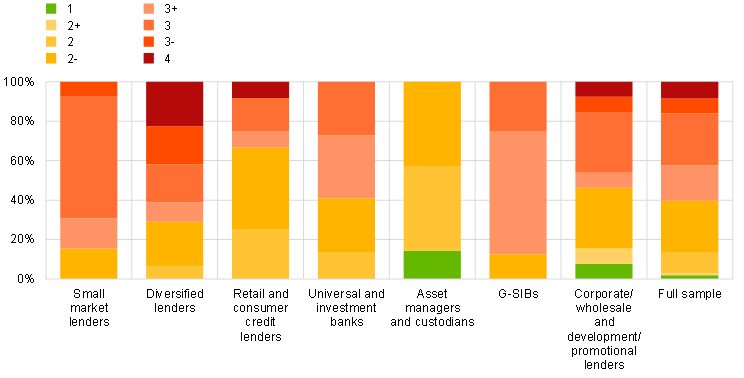
As shown in Chart 19, the distribution of internal governance and risk management scores varies across significant institutions with different business models.
There is a high concentration in scores of 3 across all business models, except for custodians and asset managers. These scores are mainly driven by significant weaknesses relating to risk data aggregation and reporting, the management body, compliance, and the risk management function. In many cases these areas saw either no improvement or further deterioration relative to last year’s SREP.
Five institutions had a score of 4 – three had already been scored with a 4 in last year’s SREP. The five belong to the business models of diversified lenders, retail and consumer credit lenders, and corporate/wholesale lenders. Severe weaknesses in their management bodies and risk culture were the primary drivers of the assigned scores, together with additional deficiencies in the internal control functions.
Chart 19
Breakdown of internal governance SREP scores by business model
(percentages)
Source: ECB (SREP Database).
Notes: 2023 SREP values based on 106 decisions. Corporate/wholesale lenders and development/promotional lenders have been grouped together in this chart to preserve statistical confidentiality.
5.2.3 Focus on risk data aggregation and reporting
In the 2023 SREP cycle, ECB Banking Supervision has highlighted the following concerns about significant institutions’ risk data aggregation and reporting (RDAR).
- Oversight by management bodies may be limited, mainly due to a lack of IT expertise among banks’ board members and the reduced incentive where sizeable investments may be required.
- Fragmented and non-harmonised IT infrastructure combined with limited automatisation negatively affect banks’ RDAR capabilities and limit their ability to produce accurate reports on time.
- Governance frameworks may not be comprehensive or effective (e.g. limited scope of application in terms of material legal entities, risk categories, business lines and financial and supervisory reporting processes) and validation by the bank’s internal control functions may be ineffective.
- Some banks do not have adequate data architecture and policies/procedures in place and documented at the group level.
- Despite increased supervisory scrutiny in recent years, significant institutions' progress on risk data capabilities to date has generally been insufficient. The 2023 SREP cycle confirmed this, with RDAR remaining the worst-rated sub-category of internal governance. The result was driven mainly by increased on-site supervisory activity in this area, combined with slow progress on bank’s remediation programmes. In this regard, the SSM is placing increasing emphasis on a structured escalation of supervisory interventions, including sanctions, where banks fail to adhere to set requirements, or their progress is lagging set timelines. In addition, ECB Banking Supervision is in the process of publishing a Guide on effective risk data aggregation and risk reporting[3], in order to specify and consolidate supervisory expectations in this field.
5.2.4 Focus on the effectiveness of management bodies
Data collections relating to governance were performed in 2022 and 2023. Data collections involve all significant institutions under European banking supervision and serve as input for the SREP assessment, enabling peer comparisons. With regard to management body effectiveness, the ECB observed some minor progress on the formal independence and experience of board members. However, the ECB still considers this progress as insufficient. Additionally, the ECB noticed a slight improvement in banks’ succession planning. Still, many banks lack a formalised succession planning policy and process. Despite some enhancement in diversity following supervisory actions, the actual representation of the under-represented gender on banks’ boards is still low.
In 2022-23 the ECB conducted the first batch of qualitative, sample-based targeted analysis on board effectiveness and diversity, which is to be followed by a second batch in 2023-24. The analysis revealed that there continue to be some long-term structural deficiencies in management bodies’ oversight role, mostly related to insufficient capacity to challenge and concerns about collective suitability and diversity. The analysis provided additional evidence on the insufficient oversight of board committees (e.g. audit, remuneration and nomination committees). The main root causes identified relate to overall board dynamics (such as dominance phenomena, composition, insufficient checks and balances) as well as governance arrangements (functioning of the committees, unclear allocation of tasks, deficiencies in members’ suitability, diversity and succession planning policies and processes). The lessons learnt from this targeted analysis will be used to adopt a more focused approach, to enhance the supervisory toolkit and, finally, to update the “2016 SSM supervisory statement on governance and risk appetite”.
5.2.5 Other key supervisory concerns and actions
Supervisors conducted a benchmarking of banks’ internal audit functions, based on a sample of around 20 institutions. The results of this benchmarking were used as input into the respective SREP assessments for this year. Overall, while most banks have appropriate reporting lines in place to ensure the internal audit function (IAF) is independent from the rest of their business lines and units, there is still room for improvement. Additionally, although IAFs have developed risk-based methodologies for the control framework, there are gaps in risk coverage.
Supervisors have expressed moderate to substantial concerns about IAF resources, particularly a lack of sufficient staff expertise, annual staff turnover and inadequate rotation processes. In terms of stature and effectiveness, supervisors generally view IAF positively but note several areas requiring ongoing supervisory attention.
A stocktake on risk culture and remuneration is planned for 2024, also following up on the outcome of the 2021 risk culture and risk incentives stocktake. The purpose of the stocktake is threefold. First, it is to establish benchmarks on how the risk perspective is reflected in banks’ remuneration frameworks. Second, it will assess how the remuneration systems promote sound risk management and alignment with long-term interests. Third, it will broadly identify interactions between risk culture and remuneration.
5.2.6 Supervisory expectations
In the 2023 SREP cycle, the largest group of qualitative measures related to internal governance and risk management focuses on the need to improve the management body (29%), followed by measures relating to the risk management function (14%), internal audit (14%), the compliance function (10%) and RDAR (10%).
Chart 20
Breakdown of qualitative measures relating to internal governance and risk management
(percentages)
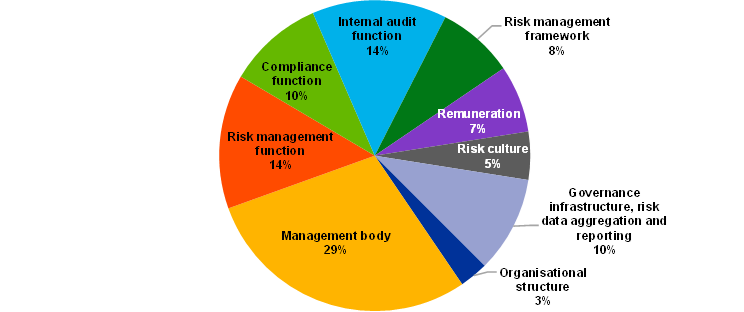
Source: ECB (SREP Database).
Notes: 2023 SREP values based on 106 decisions. This chart does not include weaknesses addressed by supervisory actions outside of the 2023 SREP cycle. One qualitative measure can be allocated to several sub-categories.
The proportion of qualitative measures relating to management bodies remained elevated in 2023, in line with the SSM supervisory priorities for 2023-25. Almost one-third of the significant institutions received at least one measure in this area.
By contrast, the number of measures addressing RDAR remained limited in 2023, despite this being the worst-rated sub-category of internal governance. This can be attributed to the increased number of measures in this area issued through on-site supervisory activity since 2021. These measures have been communicated to the institutions using other instruments (i.e. follow-up letters or dedicated ECB supervisory decisions).
5.3 Element 3 – Block 1: Credit risk
5.3.1 Key messages
While asset quality further improved, average credit risk scores remain unchanged. Supervisors remain cautious given the uncertain macroeconomic outlook and exposures to vulnerable sectors: NPLs and forborne exposures declined further, while the share of stage 2 loans[4] over total loans and advances has been coming down from its peak in 2022. However, the pace of decline in NPLs has slowed. The provision coverage of stage 2 loans remains below pre-pandemic levels, while early arrears[5] show the first signs of a portfolio deterioration in the first half of 2023.
Additionally, credit risk scores continue to reflect supervisory concerns about risk control, risk management frameworks and related practices. The 2023 SREP assessments reflected improvements observed in relation to the letters sent to CEOs in 2020 (“Dear CEO letters”). However, credit risk scores are still underpinned by both persisting deficiencies and new ones: for example, 11% of the credit risk related SREP qualitative measures refer to loan classification and provisioning (Section 5.3.5).
In parallel with the 2023 SREP cycle, ECB Banking Supervision continued to take extensive supervisory action on CRE, such as targeted review follow-up and on-site inspections. Supervisors also carried out deep dives on RRE. Here the focus was on loan origination practices, as well as IFRS 9 in areas such as overlay quantification practices and their governance. Moreover, LF portfolios and their potential implications for asset quality have continuously been an area of focus: in 2022 the ECB issued a letter on leveraged transactions. It set out detailed expectations on the set-up of institutions’ internal risk appetite frameworks and high levels of risk-taking. Subsequently, supervisors investigated banks’ progress on implementing these expectations. This year, the analysis was extended and most banks have received a set of recommendations to address gaps relative to the ECB’s supervisory expectations. Supervisors are continuing to monitor progress on addressing the weaknesses. Several banks were considered to have made insufficient progress in this regard. For these banks, a dedicated LF capital add-on was applied, which had been introduced for the first time as part of the 2022 SREP. However, in one case, where sufficient improvement had been achieved, the add-on was removed. In most cases, this add-on covers risks currently being addressed by Joint Supervisory Teams (JSTs) and by banks through follow-up measures.
Finally, 2023 saw the conclusion of the targeted review of governance and high-level management of counterparty credit risk, with a focus on over-the-counter derivatives with non-banking counterparties.
The outcomes of these supervisory activities have been factored into the 2023 SREP and have informed the credit risk scores.
Chart 21
Element 3: Credit risk SREP scores
(percentages)
Source: ECB (SREP Database).
Note: 2022 SREP values based on 101 decisions; 2023 SREP values based on 106 decisions. Qualifiers were introduced in SREP 2022.
5.3.2 Breakdown by business model
Significant differences remain between business models in terms of credit risk scores (Chart 22).
- Diversified lenders have the most banks (16%) scoring 4 and the highest average risk score at 3.02. Despite their scores improving through the continuous reduction of NPLs, the asset quality of diversified lenders is still vulnerable to macroeconomic conditions. Risk management deficiencies also feed into the scores.
- G-SIBs mostly scored in the medium-to-high risk category (with 75% scoring 3+ or 3), reflecting the continuous supervisory attention devoted to credit risk management and the shortcomings identified that inform their scores.
- Asset managers and custodians, together with investment banks, are the groups with the lowest average credit risk scores at 1.99 and 2.43, respectively. These groups are less involved in granting traditional loans than other business models.
Chart 22
Breakdown of credit risk SREP scores by business model
(percentages)
Source: ECB (SREP Database).
Notes: 2023 SREP values based on 106 decisions. Corporate/wholesale lenders and development/promotional lenders have been grouped together in this chart to preserve statistical confidentiality.
5.3.3 Focus on exposures to vulnerable sectors
A particular focus was on those exposures particularly sensitive to interest rates, such as those in the CRE and RRE sectors, as well as LF.
Supervisors assessed the refinancing risk that pertains to CRE exposures with specific amortisation types, such as bullet loans, loans without recourse or loans with variable interest rates. In addition, the need for significant institutions to improve their capabilities concerning the monitoring and management of CRE portfolios was highlighted. By contrast, the targeted review of RRE conducted in 2022-23 mostly revealed gaps in strategy and portfolio resilience, loan origination and collateral valuation practices. Detailed bank by bank findings are being communicated and followed up on as part of ongoing supervisory engagement on this key topic.
Another area where supervisors carried out deep dives was LF portfolios. Supervisors assessed the set-up of institutions’ internal risk appetite frameworks and high levels of risk-taking for leveraged transactions.
5.3.4 Focus on credit risk management
After years of continued asset quality improvement, at the end of June 2023 the volume of NPLs held by significant institutions moderately increased at €344 billion. This amounts to an NPL ratio of 2.3% (excluding cash balances at central banks and other demand deposits) as shown in Chart 23.
Chart 23
NPLs held by significant institutions
(Volume in EUR billions, ratio as a percentage)
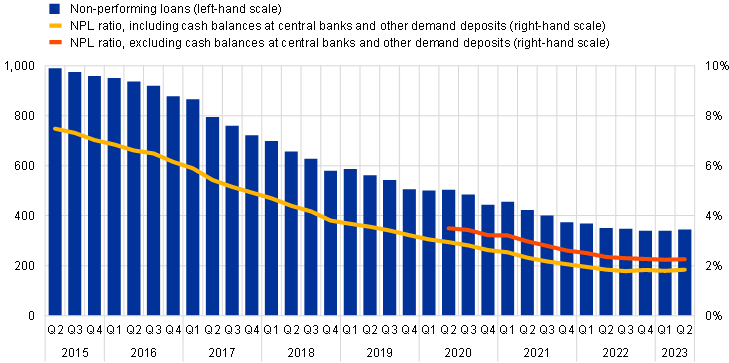
Source: ECB Supervisory Banking Statistics.
Notes: NPL ratio as weighted average. Sample selection follows the Supervisory Banking Statistics (SBS) methodological note.
Following the peak in the third quarter of 2022 (9.8%), the stage 2 loans and advances (subject to impairment review) have remained at an elevated level. Some 9.2% of total loans and advances were classified as stage 2 in the second quarter of 2023, compared with the pandemic level of 8.4% in the second quarter of 2020 (Chart 24). Provisions for stage 2 loans and advances stayed broadly flat on average, at 3.8% year on year. In addition, total forborne exposures continued to decrease gradually and dropped below pre-pandemic levels, reaching €302.5 billion in the second quarter of 2023, compared with €332 billion at the end of 2019.
Chart 24
Stage 2 ratio, stage 2 coverage and total forborne exposures
(percentages, EUR billions)
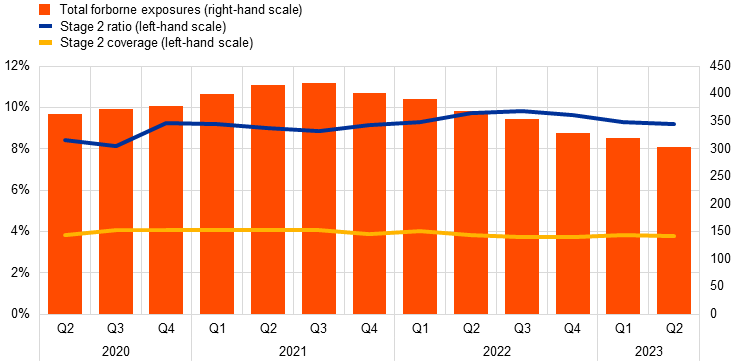
Source: ECB Supervisory Banking Statistics.
Notes: Weighted average. Sample selection follows the Supervisory Banking Statistics (SBS) methodological note. Stage 2 ratio and stage 2 coverage are available in the ECB Data Portal (EDP) as of Q2 2020.
Credit risk management frameworks continue to be a supervisory priority and were the focus of a range of targeted activities. ECB Banking Supervision followed up on areas raised in the “Dear CEO letters” by performing coordinated deep dives on forbearance and unlikely to pay identification, and mitigation of the corresponding risks. In addition, ECB Banking Supervision carried out a targeted review of IFRS 9 provisions. Further details are available in the supervision blog article “Overlays and in-model adjustments: identifying best practices for capturing novel risks”.
Deep dives on forbearance assessed the adequacy of forbearance processes from a prudential and risk management perspective. A particular focus was put on the risk management perspective and banks’ preparedness for dealing with an increase in distressed debtors and refinancing risk. The analyses was made available in the supervision newsletter and have revealed that banks need to improve three areas in particular: how they identify a client in financial difficulties, how they ensure that clients are granted the most appropriate measures, and how they monitor forbearance measures, both at individual and portfolio level.
The targeted review of IFRS 9 provisions was aimed at understanding whether and how banks use loan loss provisions to cover novel risks (e.g. energy supply, supply chains in general, environmental risks, inflation and geopolitical risks). ECB Banking Supervision observed that significant institutions do acknowledge the existence of novel risks and that most of them try to capture these risks with overlays. However, a significant minority of significant institutions are not yet capturing novel risks. And among those that do, not all quantify them robustly. For example, some significant institutions apply “umbrella overlays”. These tend to cover a broad spectrum of unrelated risks and/or multiple portfolios or borrower groups with different underlying credit risk characteristics. Another area of concern is the predominant use of overlays that do not distinguish between probability of default and loss given default. These “overlays at total expected credit loss level” lack risk sensitivity.
ECB Banking Supervision encourages significant institutions to design evidence-based approaches to capturing novel risks, by first quantifying them at a sectoral level and then identifying which groups of clients are affected by each novel risk.
The outcomes of the exercise were either communicated to significant institutions in dedicated operational action or incorporated into existing supervisory engagements, with remedial action mostly scheduled for assessment during 2023.
Furthermore, the SREP assessments reflected not only the outcomes of the targeted activities, but also the follow-up on previous exercises launched and deficiencies already identified. Banks’ continued efforts and progress on closing the gaps, as identified in the “Dear CEO letters” review, was noted. However, some issues persist and there is still a need for further improvements, despite the letters having been issued some time ago and the progress already observed. The various targeted reviews of banks’ ability to identify, assess and manage risks stemming from specific vulnerable sectors also informed the supervisors’ assessments of risk controls (Section 5.3.3).
5.3.5 Supervisory expectations
Supervisors addressed bank-specific concerns about credit risk by issuing a significant number of SREP qualitative measures, addressed to more than 70 banks (Chart 25). Some 48% of the qualitative measures pertain to strategic and operational plans concerning the level of NPEs, NPE coverage expectations and related reporting.
Focusing on the SSM supervisory priorities for 2023-25, 43% of the qualitative measures relate to shortcomings in the area of credit risk management frameworks (all categories listed below other than NPEs, internal models/ICAAP and other). Of the measures issued, 7% were intended to enhance banks' management of portfolios exposed to vulnerable sectors. These measures relate to the monitoring of specific vulnerable portfolios, such as interest-only mortgages, CRE or LF portfolios.
Chart 25
Breakdown of credit risk-related qualitative measures
(percentages)
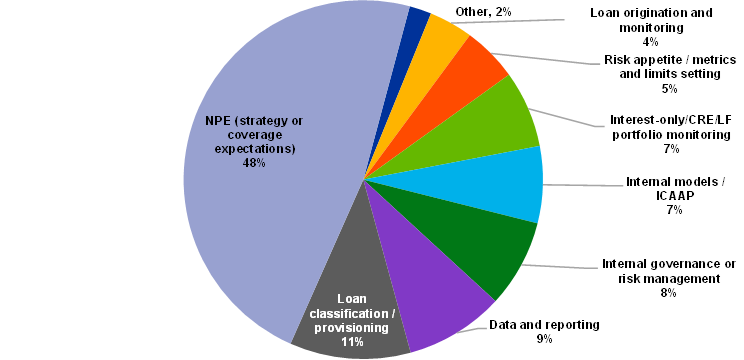
Source: ECB (SREP Database).
Notes: 2023 SREP values based on 106 decisions. This chart does not include any weaknesses which may already have been addressed by supervisory actions outside of the 2023 SREP cycle.
5.4 Element 3 – Capital adequacy and Element 3 - Block 2: ICAAP
5.4.1 Key messages
Capital adequacy scores have remained broadly the same, albeit with a few changes in their distribution relative to 2022. Some 91% of the significant institutions were assigned the same score as in the previous SREP assessment cycle, while 6% saw their score deteriorate and 3% received an improved score (Chart 26).
Chart 26
Element 3: Capital adequacy SREP scores
(percentages)
Source: ECB (SREP Database).
Note: 2022 SREP values based on 101 decisions; 2023 SREP values based on 106 decisions. Qualifiers were introduced in SREP 2022.
In the 2023 SREP cycle, supervisors focused on assessing progress in the institutions’ capital planning, looking at frameworks, processes, capacity, and quality against the background of political and macroeconomic uncertainties. These factors have a major impact on the reliability and timeliness of updates to banks’ capital projections, which underlines the importance of significant institutions having prudent, forward-looking capital plans at their disposal. Also, increased supervisory attention was devoted to the treatment and inclusion of unrealised losses in internal capital from the regulatory and economic perspective[6], building on, for example, the ECB’s 2018 ICAAP Guide.
Based on data for the first quarter of 2023, no institutions had capital levels below the required sum of overall capital requirements, buffers, and guidance.
Chart 27
Capital headroom for overall capital requirements and P2G in the second quarter of 2023
(percentages)
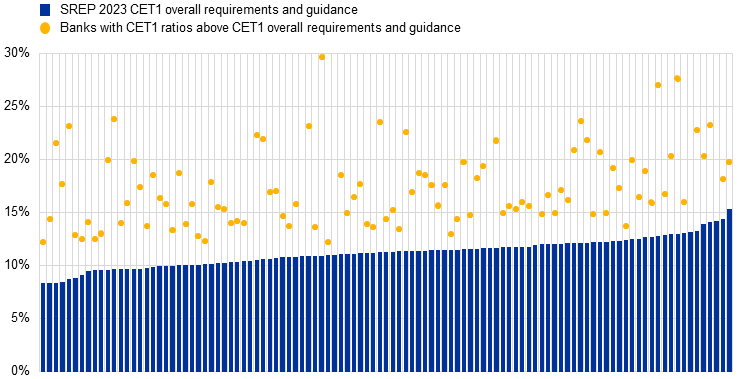
Sources: ECB Supervisory Banking Statistics and SREP Database.
Notes: Pillar 2 CET1 requirements as per the published list of P2Rs applicable as at Q1 2024 and Pillar 2 CET1 guidance as per the European Banking Authority (EBA) Stress Test 2023. CET1 ratios are as at Q2 2023 and capped at 30 percent. For systemic buffers (G-SII, O-SII and SyRB) and the CCyB, the levels shown are those anticipated for Q1 2024 and included in the 2023 CET1 requirements and guidance. Each blue line represents a significant institution’s overall capital requirements and guidance in CET1. For some banks, a fraction of CET1 headroom might be used to cover shortfalls in AT1/T2, and therefore the headroom may be lower, but still above overall requirements and guidance.
5.4.2 Breakdown by business model
As for the distribution of capital adequacy scores broken down by business model, there is a strong concentration of scores of 2 and 3 among G-SIBs, universal and investment banks, and retail and consumer credit lenders. The capital adequacy score 1 is less frequent, and mainly assigned to corporate/wholesale lenders and development/promotional lenders, followed by small market lenders and asset managers and custodians.
Chart 28
Breakdown of capital adequacy SREP scores by business model
(percentages)
Source: ECB (SREP Database).
Notes: 2023 SREP values based on 106 decisions. Corporate/wholesale lenders and development/promotional lenders have been grouped together in this chart to preserve statistical confidentiality.
5.4.3 Supervisory expectations
In several cases, ECB Banking Supervision expressed ongoing concerns about the reliability of banks’ capital planning frameworks and their ability to produce reliable capital projections under baseline and adverse scenarios as part of the overall ICAAP assessments. Consequently, 33% of ICAAP-related measures issued in the 2023 SREP cycle require institutions to improve capital planning. Moreover, 15% of the measures focus on the risk identification, aggregation, and measurement process, while 11% relate to dividend distribution policies. As set out in the ECB’s 2018 ICAAP Guide, institutions are expected to continuously improve both their ICAAP and relevant practices, as these constitute key factors in effective risk management.
Chart 29
Breakdown of capital adequacy-related qualitative measures
(percentages)
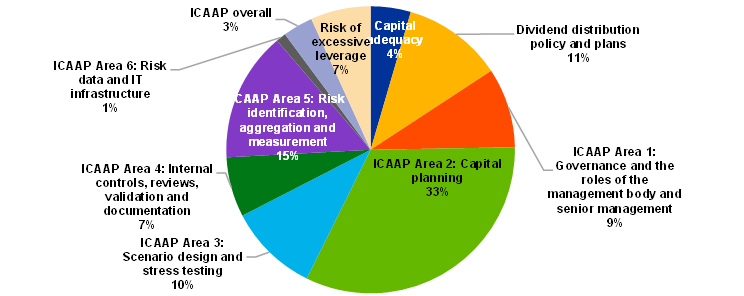
Source: ECB (SREP Database).
Notes: 2023 SREP values based on 106 decisions. This chart does not include weaknesses which may have already been addressed by supervisory actions outside of the 2023 SREP cycle.
5.5 Other risks
5.5.1 Liquidity and funding risk
The average of the liquidity and funding combined risk scores is stable, reflecting low to medium riskiness amid macroeconomic, inflationary, and geopolitical challenges. Despite such challenges, regulatory ratios remain resilient. Nevertheless, the focus on liquidity risk reflects the supervisory priorities, with the number of supervisory measures issued almost doubling compared with last year’s SREP cycle.
Supervisors assessed short-term liquidity risk as low-to-medium, i.e. broadly stable compared to last year. The liquidity coverage ratio of significant institutions has deteriorated from 164% in Q2 2022 to 158% in the same period of 2023, following the gradual shift in monetary policy. Supervisors have been particularly attentive to their banks’ resilience to the events of March 2023.
In March 2023 three medium-sized banks in the United States failed – Silicon Valley Bank, Signature Bank and later First Republic – and Credit Suisse in Switzerland had to be taken over. This led to broader market concerns over banks’ ability to adjust to a changing interest rate environment. Supervisors assessed the effects of the market turmoil. There was mainly a prompt reaction from their banks and adequate crisis management. They were also more alert to developments in uninsured deposits, sovereign bond holdings, unsecured bonds and reputational risk.
Funding sustainability risk deteriorated slightly though remaining low-to-medium, with supervisors assessing concerns about the proportionately high share of wholesale funding. Nevertheless, the average sustainable funding risk profile remained solid. The net stable funding ratio of significant institutions has deteriorated slightly from 127% to 126% between Q2 2022 and Q2 2023.
In line with the supervisory priorities for 2023-25, supervisors assessed the expected repayments of the third programme of targeted longer-term refinancing operations (TLTRO III). These repayments meant banks needed to diversify their funding sources by developing and executing sound and credible multi-year funding plans, incorporating challenges stemming from changing funding conditions.
Supervisors’ assessment consisted in a targeted review and a broader horizontal analysis of banks’ liquidity and funding plans.
First, the ECB conducted a targeted review focused on TLTRO III exit strategies across a sample of banks identified as the most vulnerable. The results showed that: (i) the sampled banks all had a TLTRO III exit strategy in place; (ii) none of them was likely to breach the liquidity coverage ratio or net stable funding ratio; and (iii) many banks in the sample held enough cash reserves to repay their TLTRO III borrowings in full. However, some banks needed to generate alternative resources to repay TLTRO III borrowing. The review also identified issues for closer monitoring: (i) some banks may be recommended to focus more strongly on alternative funding sources (market funding, deposits) to replace TLTRO III funding; (ii) some banks have a high proportion of non-high quality liquid assets (non-HQLA) collateral (i.e. additional credit claims) in the Eurosystem collateral pool; and (iii) some of banks’ assumptions on increases in deposits may be too optimistic. The JSTs have incorporated the recommendations from the targeted review into their 2023 SREP assessments, as appropriate.
Second, the targeted review described above was complemented by a broader horizontal analysis of banks’ liquidity and funding plans. The overall aim of this analysis was to identify weak practices and more vulnerable institutions. Its detailed objectives were threefold. It was designed to identify shortcomings in funding planning, identify any implications of a bank’s funding structure for the viability of its business model, as well as to assess a bank’s ability to generate immediate liquidity to withstand an unexpected crisis. This included evaluating the asset and liability management (ALM) framework and ensuring that the modelling of behavioural assumptions was in line with the current interest rate environment. The review encompassed three modules and focused, for the selected banks, on the assessment of: (i) the feasibility of funding plans; (ii) liquidity contingency planning and collateral capabilities; and (iii) ALM governance and strategy. The analysis of the liquidity/funding plans and collateral management is currently being finalised and the results are to be incorporated into the 2024 SREP. Meanwhile, the assessment of the ALM governance and strategy started in the fourth quarter of 2023.
Increased supervisory attention was also reflected in the mild deterioration of risk control scores this year. In fact, qualitative measures doubled, reflecting the particular attention paid to funding strategies (accounting for 66% of the measures), risk management concerns, and delays in closing measures. In addition, three quantitative measures were included for liquidity risk, which were of an idiosyncratic nature. Two of the measures require a minimum survival period, with the other requiring an additional currency-specific liquidity buffer. Finally, on-site inspections did not increase substantially in 2023. However, a significant number were requested for 2024 and beyond.
5.5.2 Operational risk
Operational risk continues to be the SREP element with the worst average scores.
While overall the banks remained resilient to operational risk, the two main deficiencies identified in the 2023 SREP cycle were: (i) the management of risks related to IT outsourcing and reliance on third-party service providers; and (ii) IT security and cyber risk management, including cyber hygiene measures and cyber resilience. The importance of operational risk and resilience will continue to grow. This is because of accelerated digitalisation, changes in consumer preferences, competition from fintech, and increased reliance on IT outsourcing, all in an environment of persistently stronger headwinds stemming from the current geopolitical situation.
The operational risk losses and loss events were primarily driven by: (i) execution, delivery, and process management; and (ii) conduct risk and external fraud. Outsourcing expenses continued to increase, particularly cloud expenses. This phenomenon was also coupled with a rising trend in the unavailability or poor quality of outsourced services, including those relating to critical activities. However, despite an ever more digitalised environment against an increasingly hostile background, the number of reported cyber incidents decreased in 2022. Nevertheless, banks’ cybersecurity resilience and reporting of cyber incidents still shows room for improvement and needs special attention from banks.
In monitoring further risks stemming from outsourcing as well as the related mitigation measures, supervisors performed a deep dive on some specific outsourcing arrangements. Supervisors set up the annual central data collection of the banks’ outsourcing registers, as required by the European Banking Authority (EBA) guideline on outsourcing arrangements (EBA/GL/2019/02). This involves all significant institutions and allows supervisors to obtain a complete view of the outsourcing arrangements in order to evaluate their criticality and any concentration.
Looking ahead, key challenges for banks are the increasing reputational and legal risks stemming from conduct cases and external fraud, accompanied by deficiencies in their operational resilience framework – namely IT outsourcing and IT security/cyber risks.
In 2024 the SSM thematic cyber resilience stress test is to be conducted, presenting banks with a common and severe but plausible cyber risk-related scenario that disrupts their critical services. The banks identify and report the impact and the consequences, as well as how they would recover from that scenario. The operational capacity of the institutions to cope with the scenario will be assessed, with the banks being split into two groups: one subject to an in-depth assessment and another subject to a lighter approach. The outcome of the exercise will take the form of bank-specific findings. The related supervisory recommendations are expected to be included in the 2024 SREP assessment.
5.5.3 Climate risk
Climate and environmental (C&E) risks are key for the economy and the financial sector. ECB Banking Supervision has stepped up its efforts to ensure that banks adequately identify, assess and manage C&E risks, while transparently disclosing the risks they are exposed to. C&E risks are being incorporated in the regular supervisory cycle and treated in the same way as any other material risk.
In the SREP 2023 climate risk was primarily assessed under Element 1 – business model and Element 2 – internal governance. Improvements were observed for some supervised institutions with respect to the business environment and strategy as assessed in the 2022 thematic review on C&E risks. However, for a few supervised institutions it became more evident that there was a pressing need to address supervisory expectations linked to the definition of their business strategy.
In terms of quantitative measures, C&E risks are seen as a factor in determining P2R levels for a larger number of banks than in the SREP 2022.
In terms of qualitative measures, in last year’s SREP cycle 30% of significant institutions received SREP measures as a result of the C&E thematic review and stress test. Around one-third of these measures have already been assessed as completed, showing some progress on C&E risk management practices.
In the 2023 SREP cycle, 12% of significant institutions received additional SREP measures, highlighting the need to remediate former deficiencies and address new findings. The new measures primarily tackled issues in the areas of governance and business models. Climate as well as environmental, social and governance (ESG) knowledge in the management board were recurring topics in the measures on internal governance, while strategic and operational plans were often at the centre of the measures related to business models.
Further efforts to address climate risk deficiencies have been undertaken outside of the SREP. ECB Banking Supervision has set banks staggered institution-specific deadlines for achieving full alignment with its expectations by the end of 2024.
In a first step, ECB Banking Supervision expected banks to adequately categorise C&E risks and to conduct a full assessment of their impact on the bank’s activities by March 2023 at the latest.
ECB Banking Supervision assessed banks’ documentation on the remediation of shortcomings for all deadlines falling due by or before March 2023, including qualitative requirements under the SREP. As a result of the assessment operational acts, SREP qualitative requirements and ad hoc Supervisory Board decisions were issued for banks with persisting severe weaknesses.
The same scrutiny and potential escalation will also apply for the upcoming implementation deadlines. At the latest by the end of 2023 the ECB expects banks to include C&E risks in their governance, strategy, and risk management. In a final step, by the end of 2024 banks are expected to meet all remaining supervisory expectations on C&E risks outlined in 2020, including full integration in the ICAAP and stress testing.
In addition, ECB Banking Supervision will continue to engage with the supervised institutions in the course of the SREP and further supervisory assessments, as well as ad hoc workshops and interactions.
6 Conclusions and outlook
The results of the 2023 SREP cycle are a credit to the resilience of the European banking sector, while also highlighting remaining vulnerabilities and emerging risks. ECB Banking Supervision will continue with its focused efforts to promote prudent behaviour and proactive risk management, ensuring that banks remain resilient and continue supporting the real economy during challenging times.
Overall, SREP scores, capital requirements and guidance have remained broadly stable over the past few years, with average capital requirements increasing slightly for 2024. Short-term liquidity risk is low-to-medium, broadly similar to last year. However, supervisory scrutiny has increased, with the number of supervisory measures issued almost doubling compared with last year’s SREP cycle for liquidity risk.
Over and above the outcome of the 2023 SREP cycle, this key annual supervisory process has matured sufficiently to allow reflection on how to make it fit for the challenges ahead. The aim is to ensure an agile approach that allows supervisors to act fast. To this end, in 2023 an Assessment of the European Central Bank’s Supervisory Review and Evaluation Process was conducted by an expert group. This assessment looked into the effectiveness and efficiency of the SREP. The expert group made recommendations to better integrate the SREP with other supervisory procedures and provide more flexibility to supervisors. In parallel, ECB Banking Supervision introduced a risk tolerance framework and initiatives such as the multi-year approach, to achieve more risk-based supervision, better tailored to banks’ specificities.
The 2023 SREP assessment also helped to identify the key potential vulnerabilities for the euro area banking sector and to inform the decision on the SSM supervisory priorities for 2024-26.
© European Central Bank, 2023
Postal address 60640 Frankfurt am Main, Germany
Telephone +49 69 1344 0
Website www.bankingsupervision.europa.eu
All rights reserved. Reproduction for educational and non-commercial purposes is permitted provided that the source is acknowledged.
For specific terminology please refer to the SSM glossary (available in English only).
HTML ISBN 978-92-899-6362-6, ISSN 2811-6887, doi:10.2866/02740, QB-CX-24-001-EN-Q
Per Article 104a of CRD V, P2Rs shall be held in the form of a minimum of 56.25% of CET1 capital. Institutions may be required to meet its additional own funds requirement with a higher portion of CET1 capital where necessary and having regard to the specific circumstances of the institution.
As of end November 2023
The ECB conducted a public consultation on the guide on effective risk data aggregation and risk reporting between July and October 2023.
This refers to stage 2 loans as defined in International Financial Reporting Standard No 9.
Arrears between 30 and 90 days past due.
In addition, an ad hoc data collection exercise by the ECB and EBA provided supervisors with information on unrealised losses at significant institutions.