- PRESS RELEASE
ECB publishes supervisory banking statistics for the first quarter of 2022
11 July 2022
- Aggregate Common Equity Tier 1 ratio decreased slightly to 14.98% in first quarter of 2022 (compared with 15.57% in previous quarter)
- Aggregated annualised return on equity down to 5.98% in first quarter of 2022 (compared with 6.71% for full year in 2021)
- Aggregate non-performing loans ratio fell further to 1.95% (down from 2.06% in previous quarter), while loans that show a significant increase in credit risk (stage 2 loans) continued to grow, standing at 9.28% (up from 9.14% in previous quarter)
Capital adequacy
The aggregate capital ratios of significant institutions (i.e. those banks that are supervised directly by the ECB) decreased slightly in the first quarter of 2022. The aggregate Common Equity Tier 1 (CET1) ratio stood at 14.98%, the aggregate Tier 1 ratio stood at 16.22% and the aggregate total capital ratio stood at 18.86%. Aggregate CET1 ratios at country level ranged from 12.39% in Greece to 26.44% in Estonia. Across Single Supervisory Mechanism business model categories, diversified lenders reported the lowest aggregate CET1 ratio (13.73%) and development/promotional lenders reported the highest (33.57%).
Chart 1
Capital ratios and their components by reference period
(EUR billions; percentages)
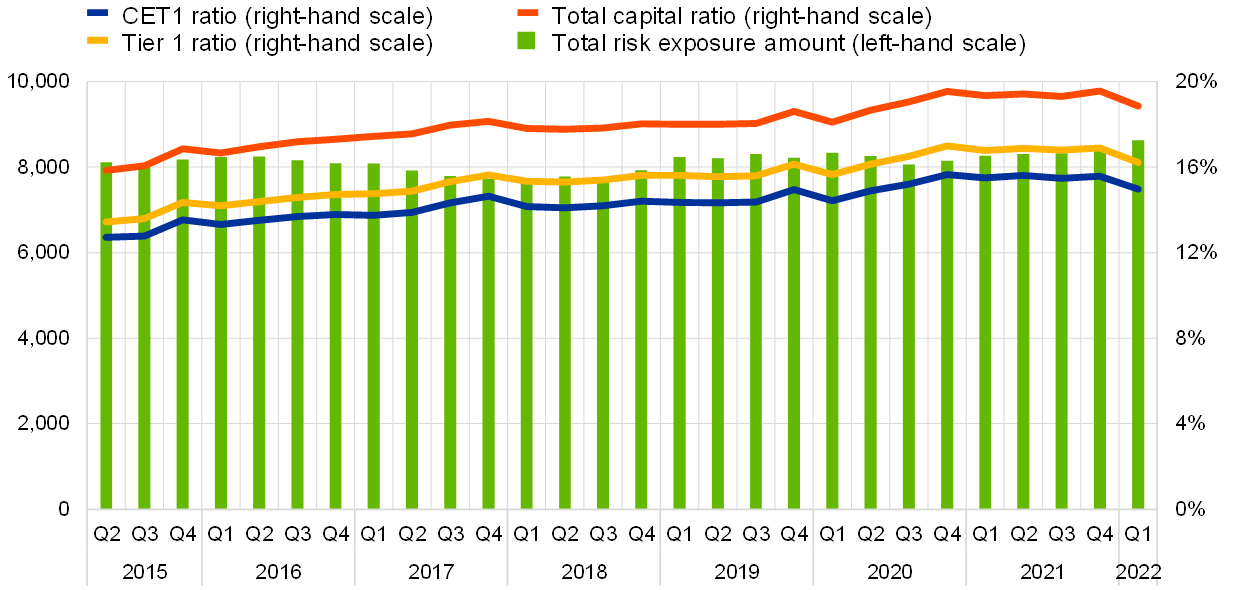
Source: ECB.
Chart 2
Capital ratios by country for the first quarter of 2022
(percentages)
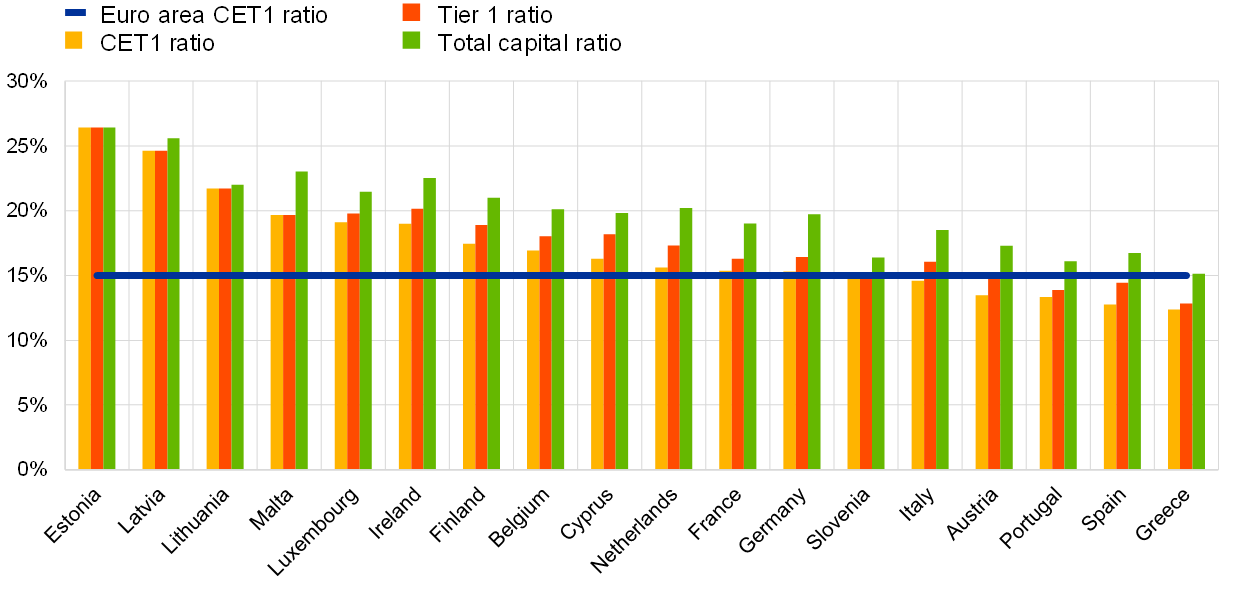
Source: ECB.
Note: Some countries participating in European banking supervision are not included in this chart, either for confidentiality reasons or because there are no significant institutions at the highest level of consolidation in that country.
Chart 3
Capital ratios by business model for the first quarter of 2022
(percentages)
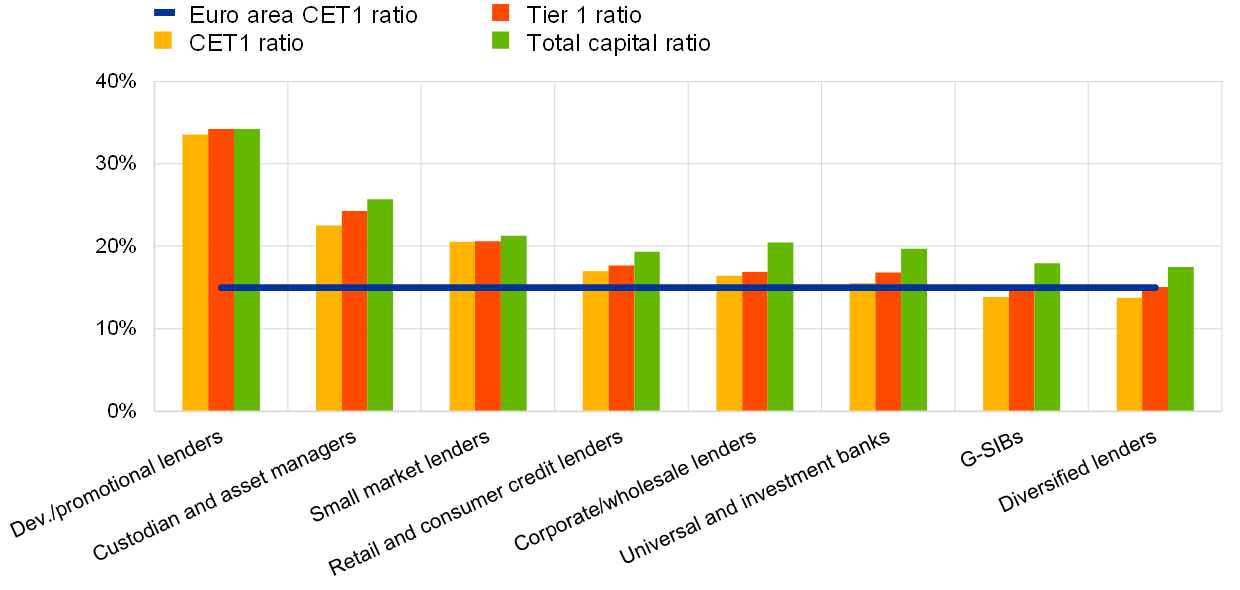
Source: ECB.
Note: “G-SIBs” stands for global systemically important banks. “Dev./promotional lenders” stands for Development/promotional lenders.
Asset quality
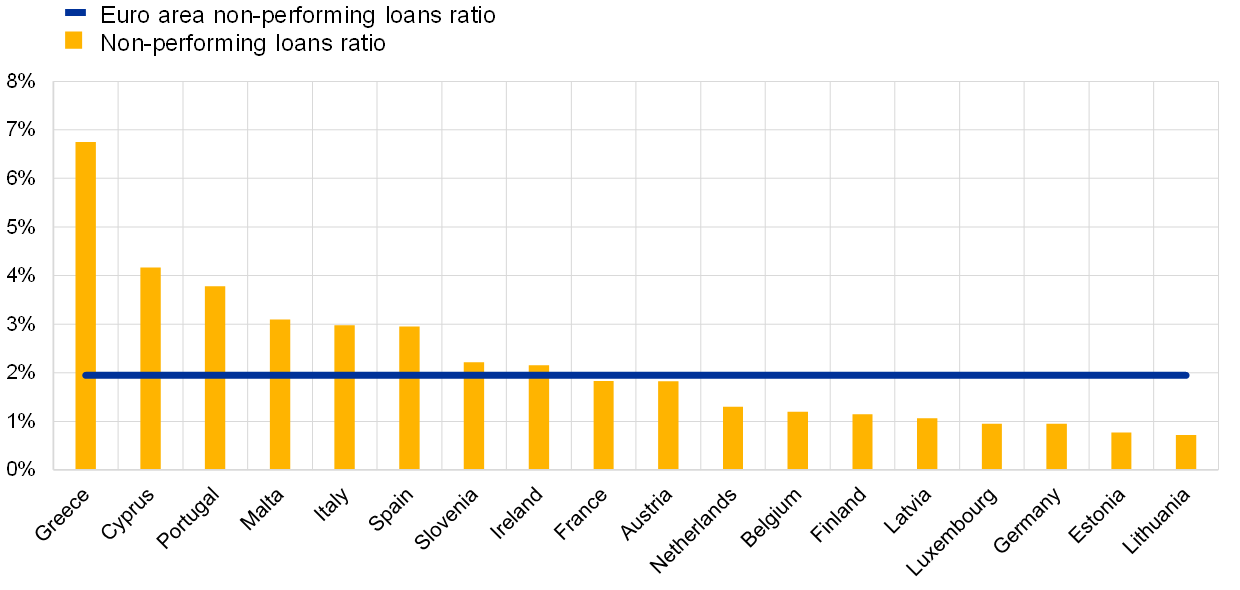
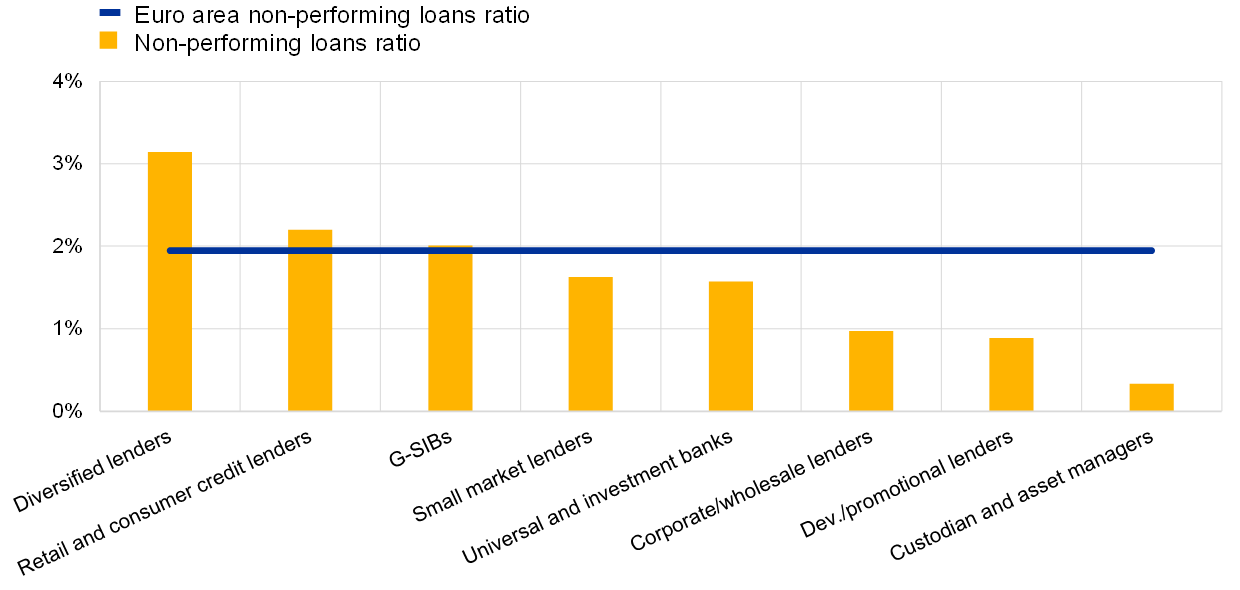
The aggregate non-performing loans (NPL) ratio decreased further to 1.95% in the first quarter of 2022, the lowest level recorded since supervisory banking statistics were first published in the second quarter of 2015. The decrease was driven by a further decline in the stock of NPLs to €369 billion (compared with €374 billion in the previous quarter) as well as an increase in total loans and advances to €18,963 billion (compared with €18,138 billion in the previous quarter). At country level, the average NPL ratio ranged from 0.72% in Lithuania to 6.75% in Greece. Across business model categories, custodians and asset managers reported the lowest aggregate NPL ratio (0.33%) and diversified lenders reported the highest (3.14%).
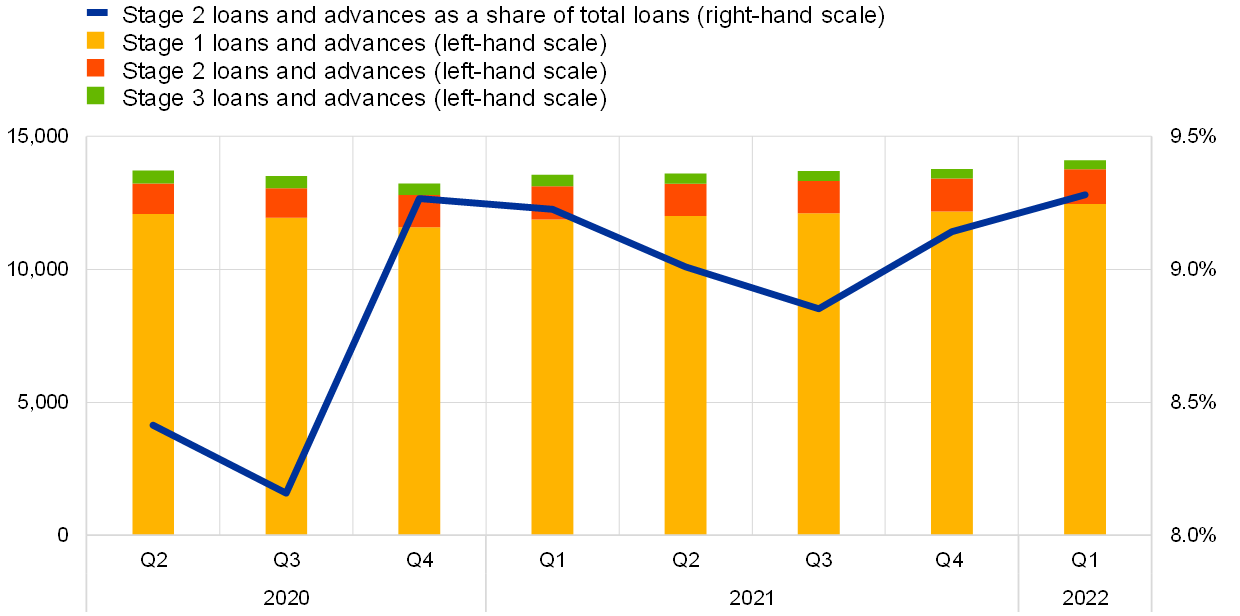
Aggregate stage 2 loans as a share of total loans continued to increase in the first quarter of 2022, reaching 9.28% (up from 9.14% in the previous quarter). The stock of stage 2 loans amounted to €1,311 billion (compared with €1,261 billion in the previous quarter).
Cost of risk stood at an aggregate level of 0.56% in the first quarter of 2022 (up from 0.50% in the previous quarter). Across significant institutions, the interquartile range widened to 0.65 percentage points (up from 0.58 percentage points in the previous quarter).
Chart 4
Non-performing loans by reference period
(EUR billions; percentages)
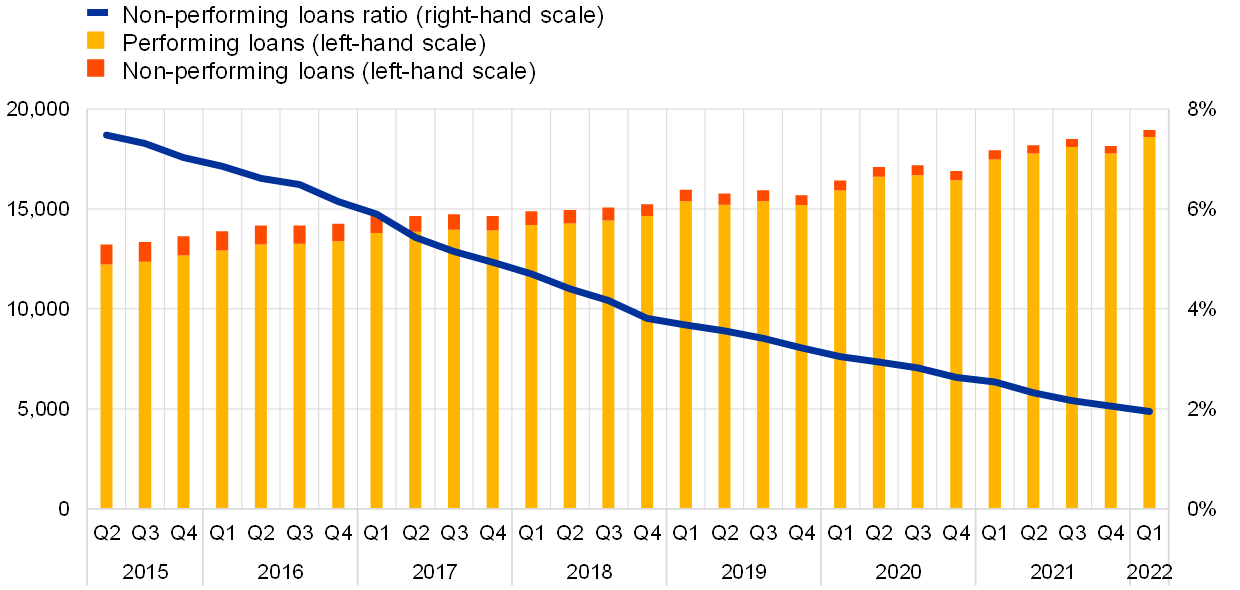
Source: ECB.
Chart 5
Non-performing loans ratio by country for the first quarter of 2022
(percentages)
Source: ECB.
Note: Some countries participating in European banking supervision are not included in this chart, either for confidentiality reasons or because there are no significant institutions at the highest level of consolidation in that country.
Chart 6
Non-performing loans ratio by business model for the first quarter of 2022
(percentages)
Source: ECB.
Note: “G-SIBs” stands for global systemically important banks. “Dev./promotional lenders” stands for Development/promotional lenders.
Chart 7
Loans and advances subject to impairment review by reference period
(EUR billions; percentages)
Source: ECB.
Note: Stage 1 includes assets where credit risk has not increased significantly since initial recognition, Stage 2 includes assets that have had a significant increase in credit risk since initial recognition, while Stage 3 includes assets that have objective evidence of impairment at the reporting date.
Chart 8
Cost of risk by reference period
(percentages)

Source: ECB.
Return on equity
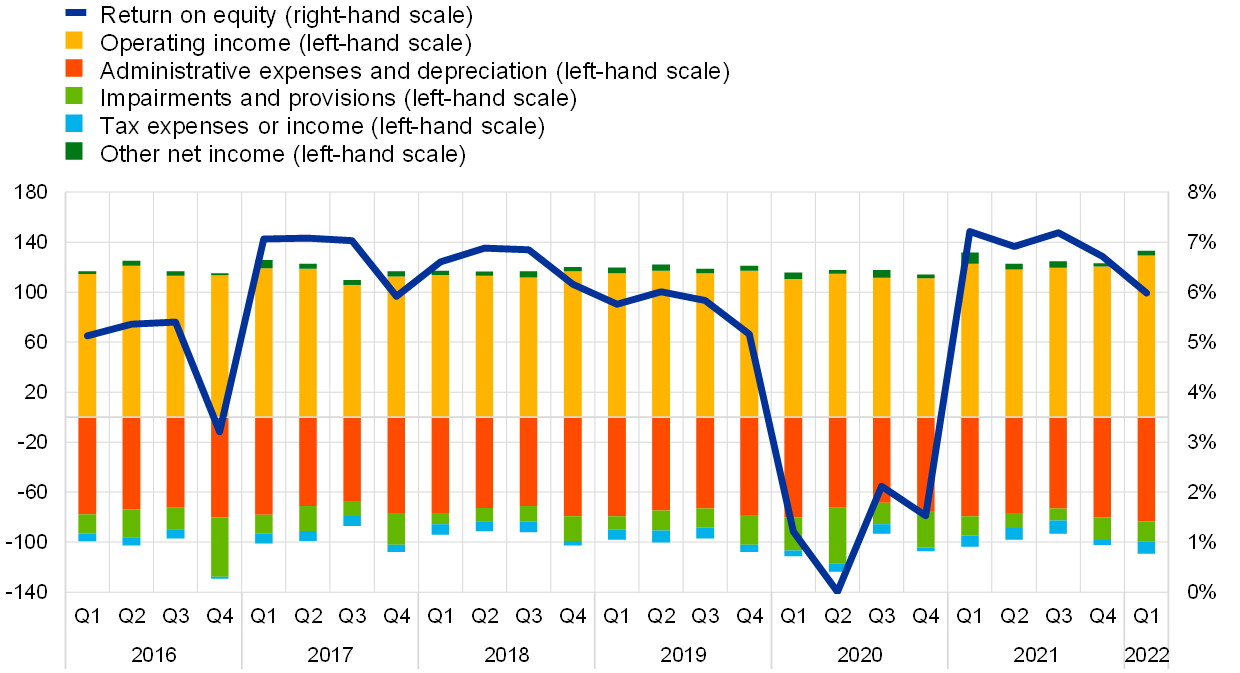
The aggregated annualised return on equity decreased to 5.98% in the first quarter of 2022 (compared with 6.71% for the full year in 2021). Increases both in operating income and in administrative expenses and depreciation were significant drivers of aggregate net profit or loss (the numerator of the return on equity).
Chart 9
Return on equity and composition of net profit and loss by reference period
(EUR billions; percentages)
Source: ECB.
Liquidity
The aggregate liquidity coverage ratio stood at 167.46% in the first quarter of 2022, down from 173.49% in the previous quarter. Both the liquidity buffer and the net liquidity outflow increased compared with the previous quarter (by €361 billion and €319 billion respectively).
Chart 10
Liquidity coverage ratio and its components by reference period
(EUR billions; percentages)
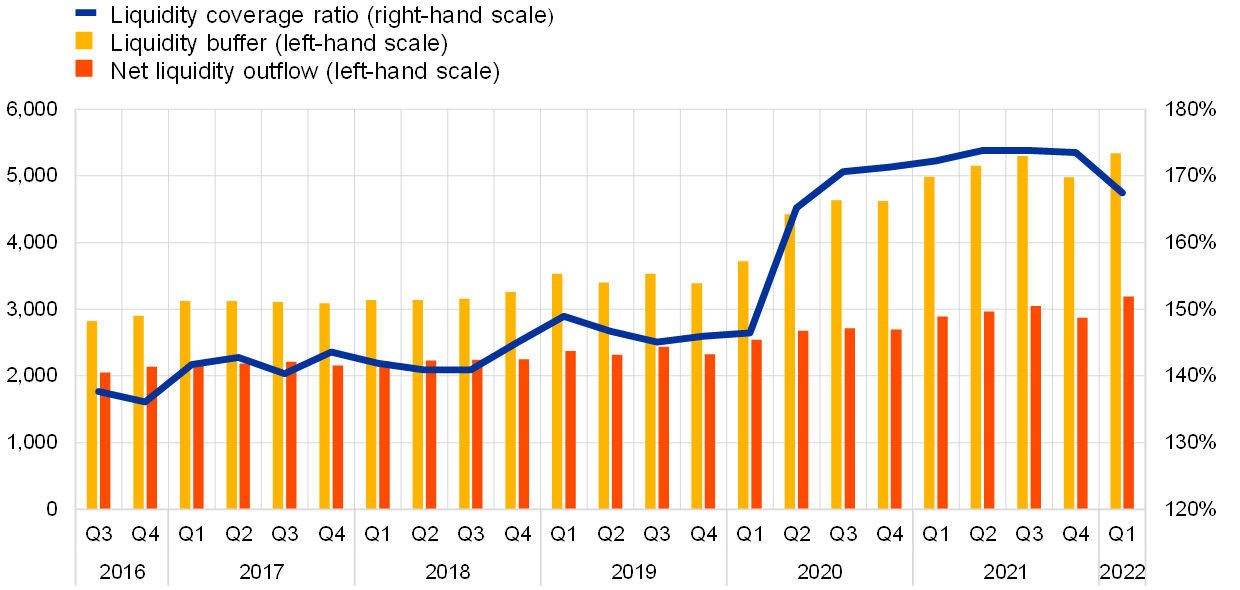
Source: ECB.
Loans and advances subject to COVID-19-related measures
In the first quarter of 2022 total loans and advances subject to COVID-19-related measures decreased further to €421 billion, down from €444 billion in the previous quarter. The decrease was driven by other loans and advances subject to COVID-19-related forbearance measures, which declined to €55 billion from €67 billion in the previous quarter.
Chart 11
Loans and advances subject to COVID-19-related measures by reference period
(EUR billions)
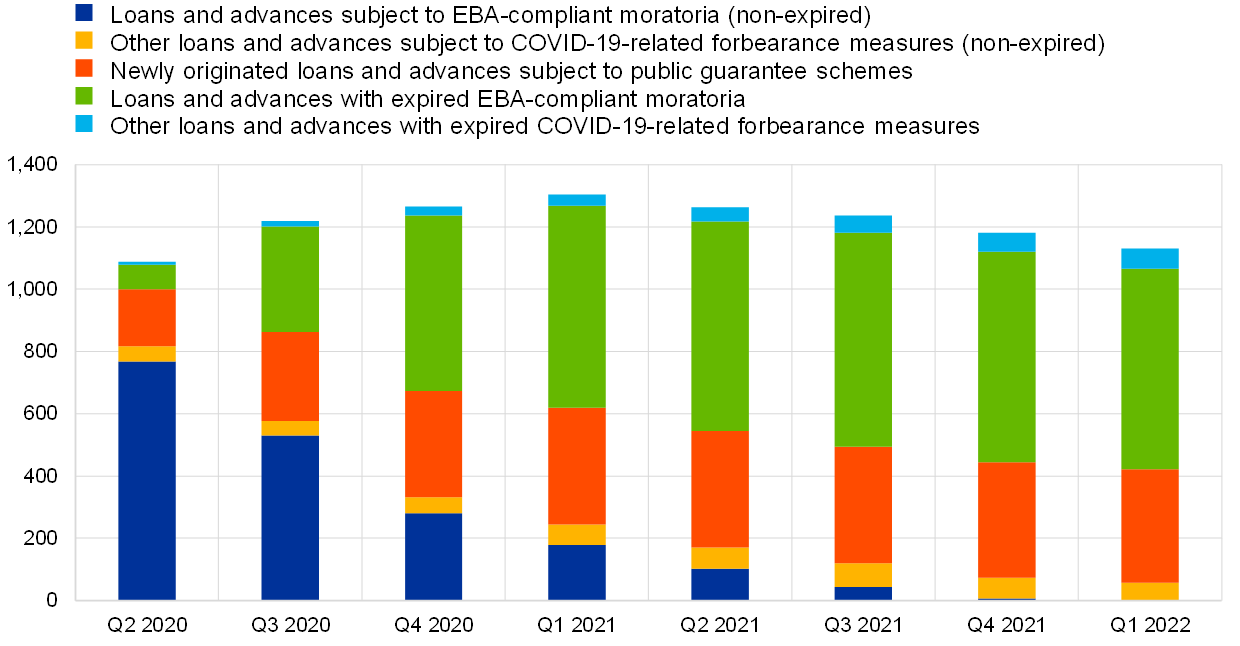
Source: ECB.
Note: “EBA” stands for European Banking Authority.
Factors affecting changes
Supervisory banking statistics are calculated by aggregating the data that are reported by banks which report COREP (capital adequacy information) and FINREP (financial information) at the relevant point in time. Consequently, changes from one quarter to the next can be influenced by the following factors:
- changes in the sample of reporting institutions;
- mergers and acquisitions;
- reclassifications (e.g. portfolio shifts as a result of certain assets being reclassified from one accounting portfolio to another).
For media queries, please contact Philippe Rispal, tel.: +49 69 1344 5482.
Notes
- The complete set of Supervisory banking statistics with additional quantitative risk indicators is available on the ECB’s banking supervision website.
Európai Központi Bank
Kommunikációs Főigazgatóság
- Sonnemannstrasse 20
- 60314 Frankfurt am Main, Németország
- +49 69 1344 7455
- media@ecb.europa.eu
A sokszorosítás a forrás megnevezésével engedélyezett.
Médiakapcsolatok