Introduction
Credit institutions operate in a dynamic digital environment, within the context of constantly rising customer expectations and evolving information technology (IT) landscapes, banking regulations and technical innovation. In 2020 banks managed to navigate through additional challenges caused by the coronavirus (COVID-19) pandemic, i.e. a significant increase in remote working, an increase in cyber risk, and even greater overall reliance on the continued proper functioning of IT infrastructures, not only their own but also those of third-party IT service providers. Although the observations presented in this report are based on data from the end of 2019 (i.e. before the pandemic), the insights gained are nonetheless useful and can highlight the developments in the management of the IT risk aspects. ECB Banking Supervision is therefore making this report available to the public as in previous year. It continues to collect these data to inform the yearly assessment of IT and cyber risk as part of the Supervisory Review and Evaluation Process (SREP)[1].
1 High-level observations
ECB Banking Supervision addresses IT and cyber risks at credit institutions by assessing their risk controls from various angles: through ongoing supervision, the regular assessment of IT-related risks and targeted on-site inspections.
Direct supervision is performed by Joint Supervisory Teams (JSTs) and complies with the European Banking Authority’s (EBA) Guidelines on ICT Risk Assessment under the Supervisory Review and Evaluation Process (SREP)[2]. As part of the annual SREP[3], JSTs perform their assessment of IT and cyber risk following a common and standardised methodology which includes the Information Technology Risk Questionnaire (ITRQ)[4]. These assessments are complemented by thematic reviews, horizontal analyses on IT risk topics and a reporting framework[5] to inform the JSTs of any significant cyber incident at the supervised credit institutions.
Frequent and targeted on-site inspections also allow ECB Banking Supervision to assess the IT and cyber risk management capabilities at individual institutions, thus contributing to a broader picture for the JSTs.
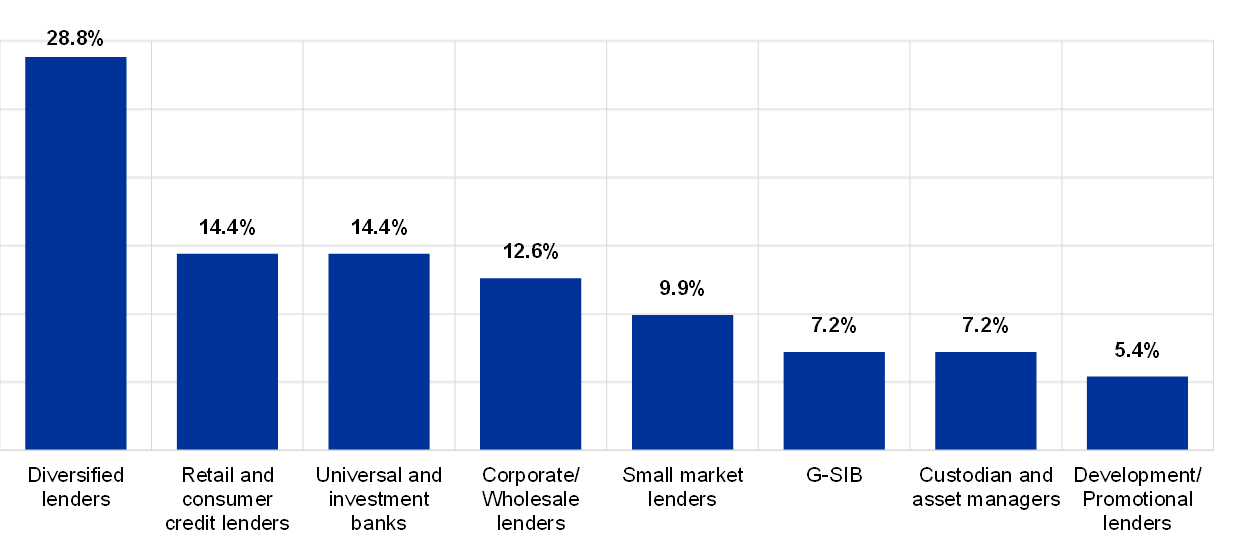
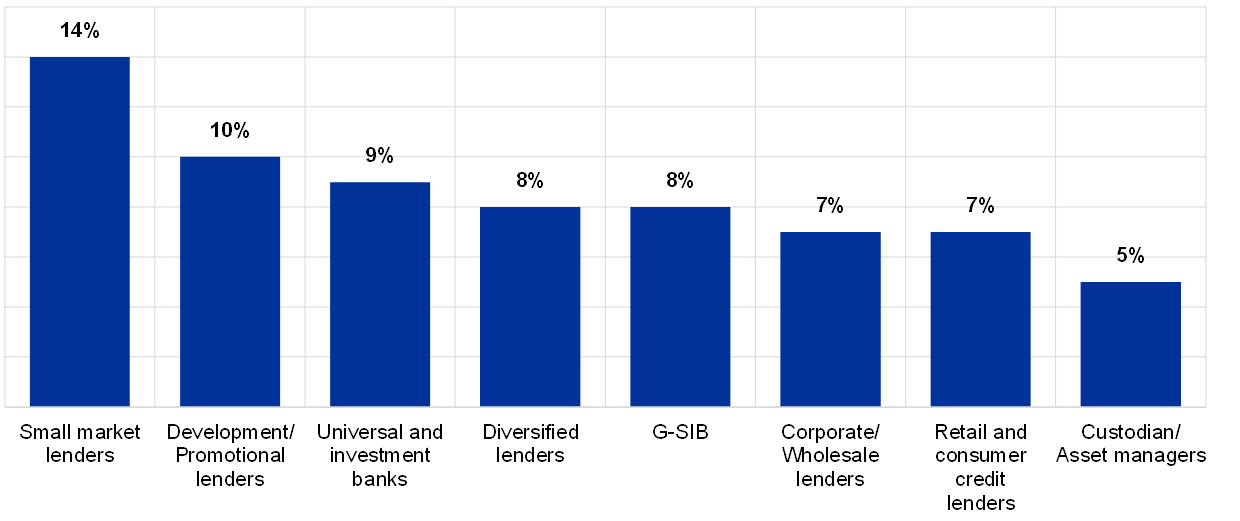
As in 2017 and 2018, for the reference year 2019[6] ITRQ self-assessments were provided by over 100 supervised institutions. The answers were used to perform a horizontal analysis at the group level of the significant supervised institutions. Chart 1 shows the percentage of institutions per business model participating in the 2019 data collection.
Chart 1
Breakdown by business model of institutions participating in the 2020 ITRQ, reference year 2019
The ITRQ assesses the IT risk level and IT risk controls of the institutions. The IT risk level section evaluates the exposure of the institution to IT risks, not taking into account the controls and measures put in place to mitigate those risks; the IT risk controls questions assess how effectively the institution has implemented measures and controls to prevent or mitigate their IT risks.
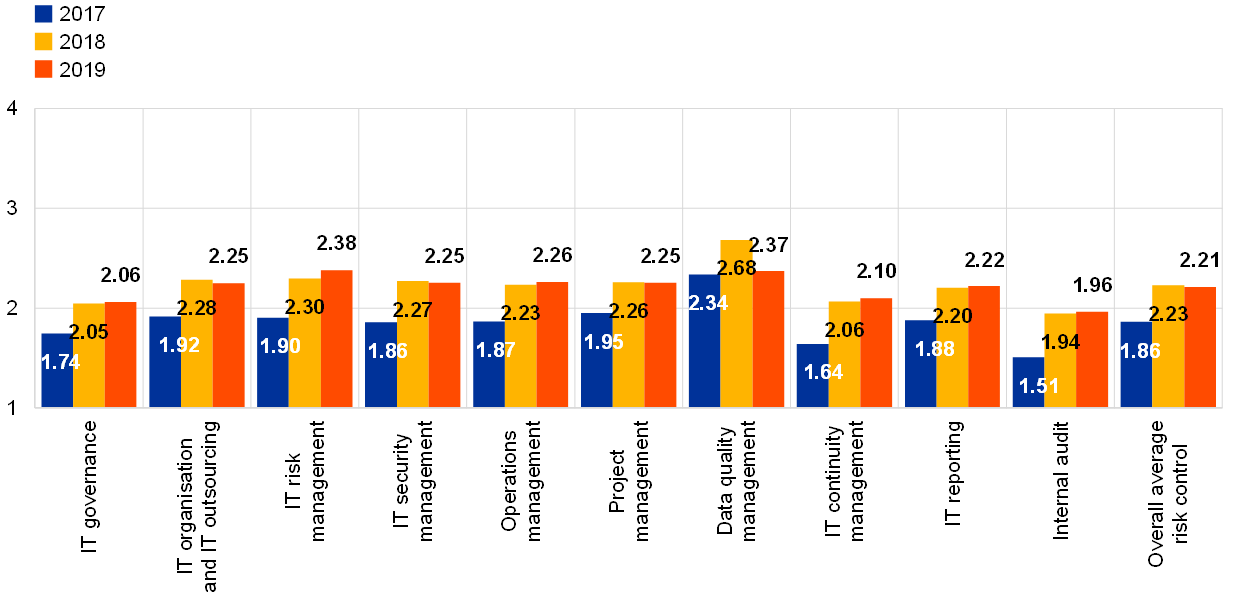
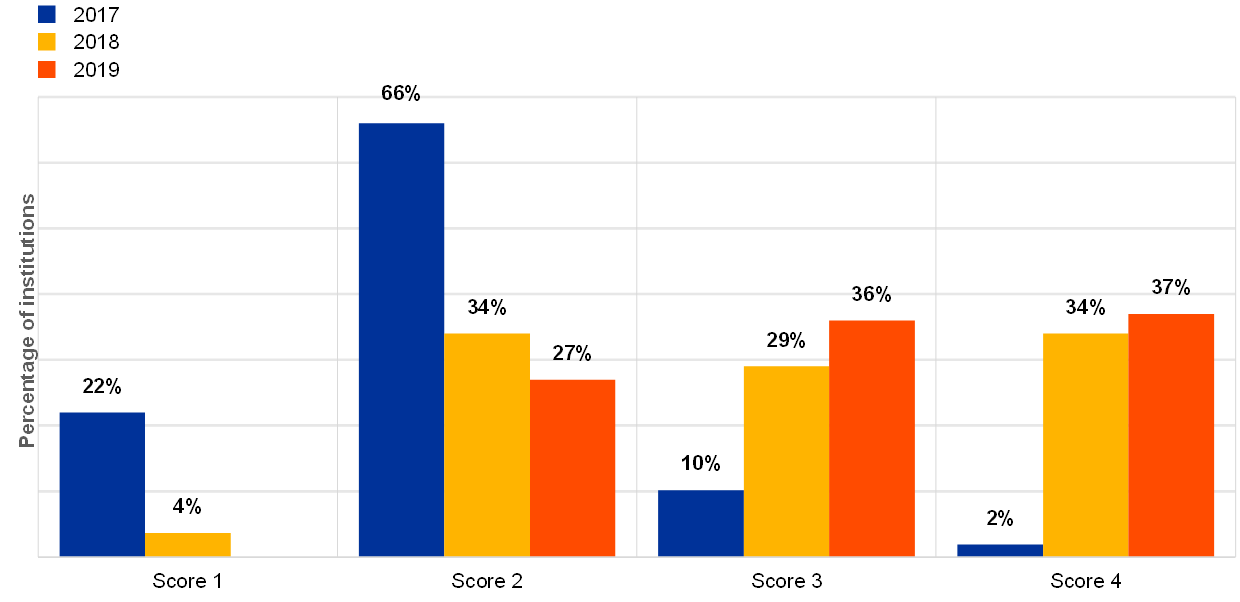
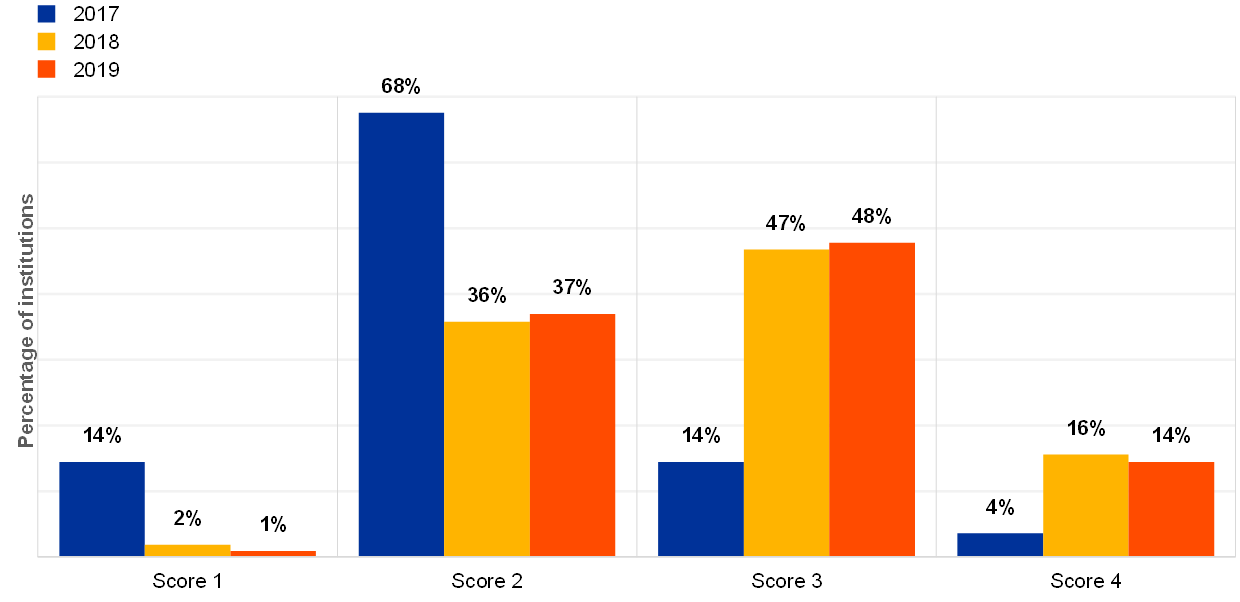
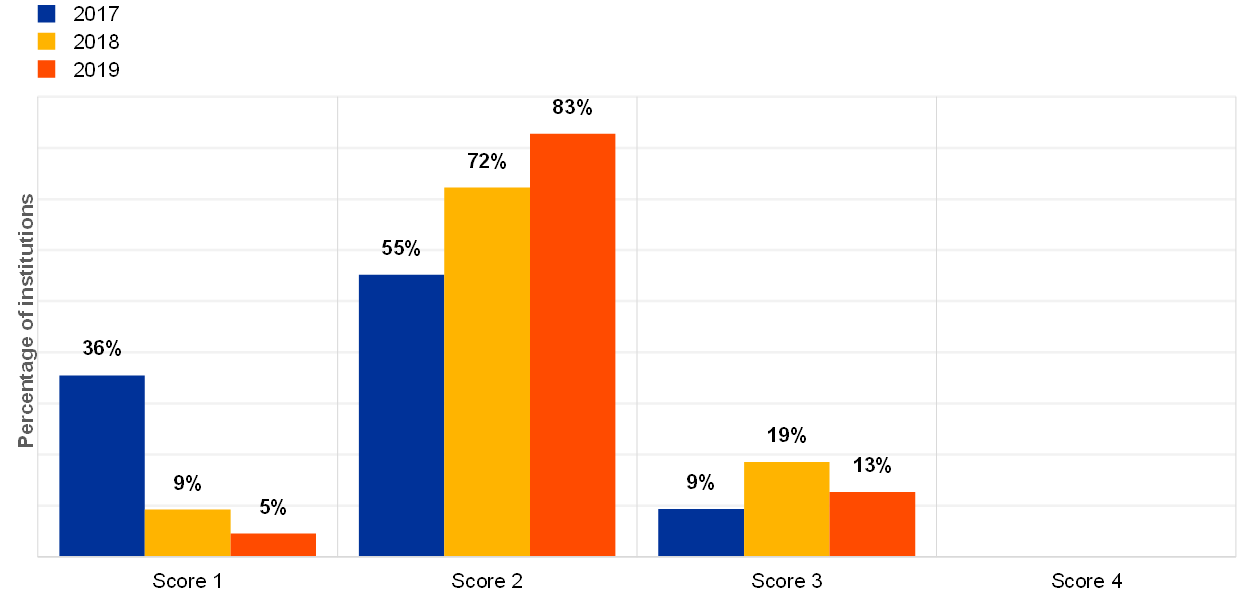
A slight increase in the average IT risk level self-assessment scores[7] for 2019, compared with 2018, was observed (Chart 2). IT risk control self-assessments scores[8] seem to have remained rather stable (Chart 3). The huge deviation between the 2017 and 2018/19 self-assessment scores could be related to a better understanding of the questions by the institutions – especially for the IT risk level where the inherent risk was taken into account as of 2018 instead of residual risk. Therefore, the 2017 scores need to be viewed with caution.
Chart 2
Institutions’ average overall risk level self-assessment scores, with “1” representing the lowest risk and “4” the highest risk
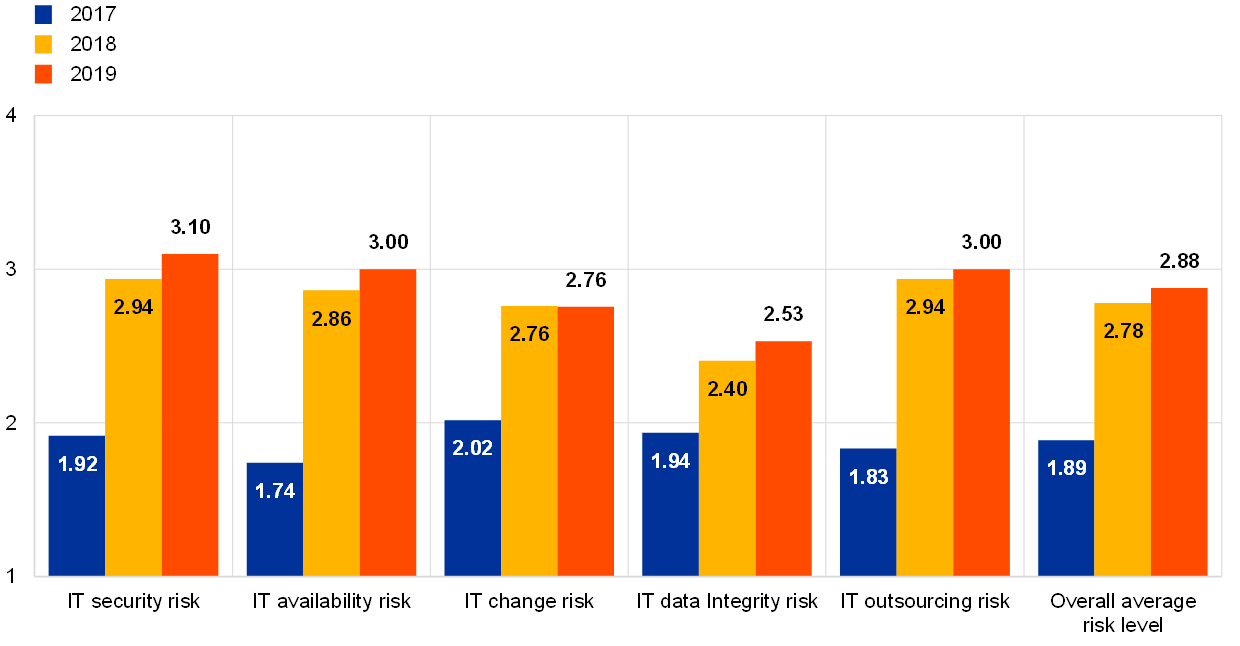
Chart 3
Institutions’ average overall risk control self-assessment scores, with “1” being the best score and “4” the worst score
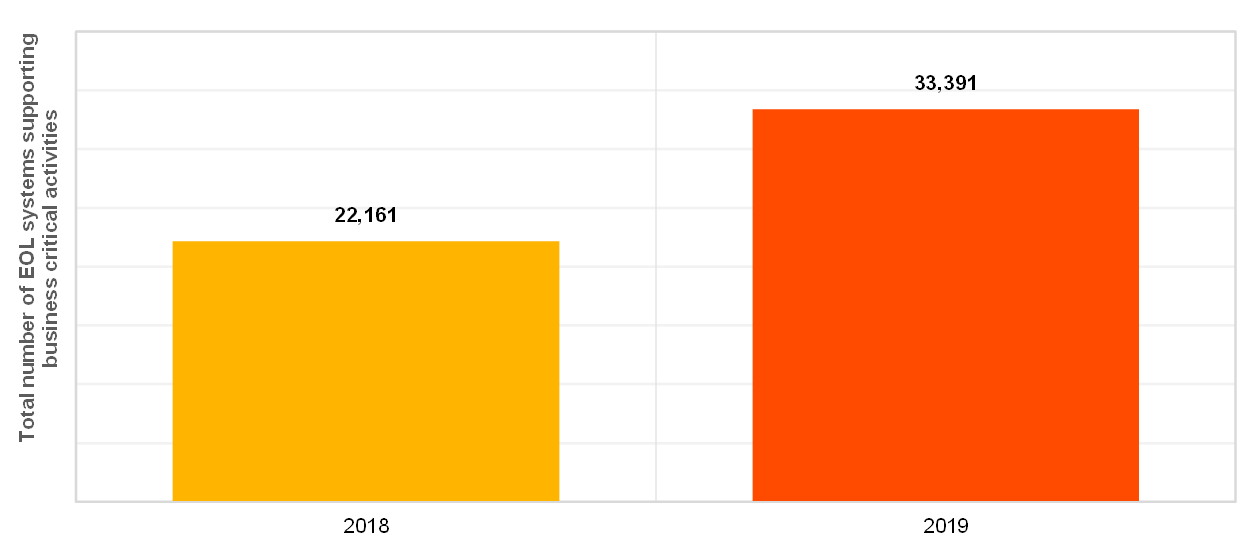
The area of IT security remains a challenge for banks. It was reported that 40% of the institutions were the target of at least one successful cyberattack in 2019, which represents a significant increase from the 28% reported for 2018. Regarding end-of-life (EOL) systems in 2019, although the number of institutions depending on EOL systems for their critical business processes was fairly stable (Chart 4), the total number of EOL systems is reported to have increased significantly (Chart 5).
Chart 4
Institutions reporting dependencies on EOL systems supporting business-critical activities
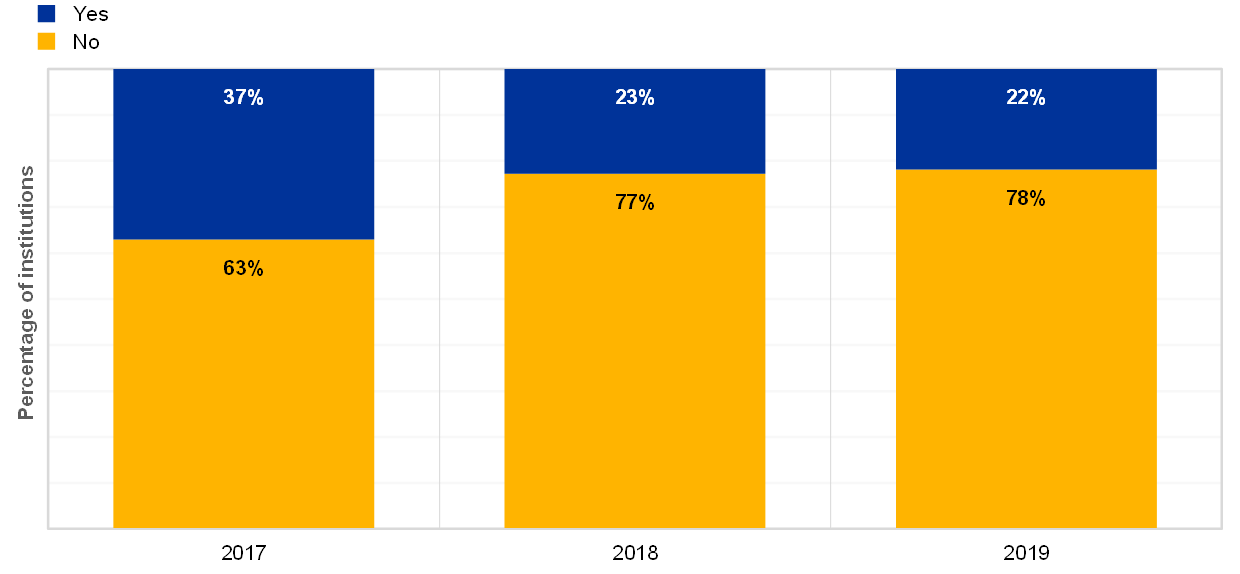
Chart 5
Total number of EOL systems supporting business-critical activities, across reference years
In a very stable trend over the last three years, almost half of the institutions reported not having implemented proper controls against data leakage (Chart 6).
Chart 6
Percentage of institutions for which protection against data leaks is implemented, properly managed and continuously monitored, across years

ECB Banking Supervision continues to pay close attention to all IT security-related topics. Institutions are consistently encouraged to keep their guard up, reduce the inherent complexities in their IT systems as much as possible and – more generally – follow the guidance provided by the EBA Guidelines on ICT and security risk management (EBA/GL/2019/04)[9], Section 3.4 Information security.
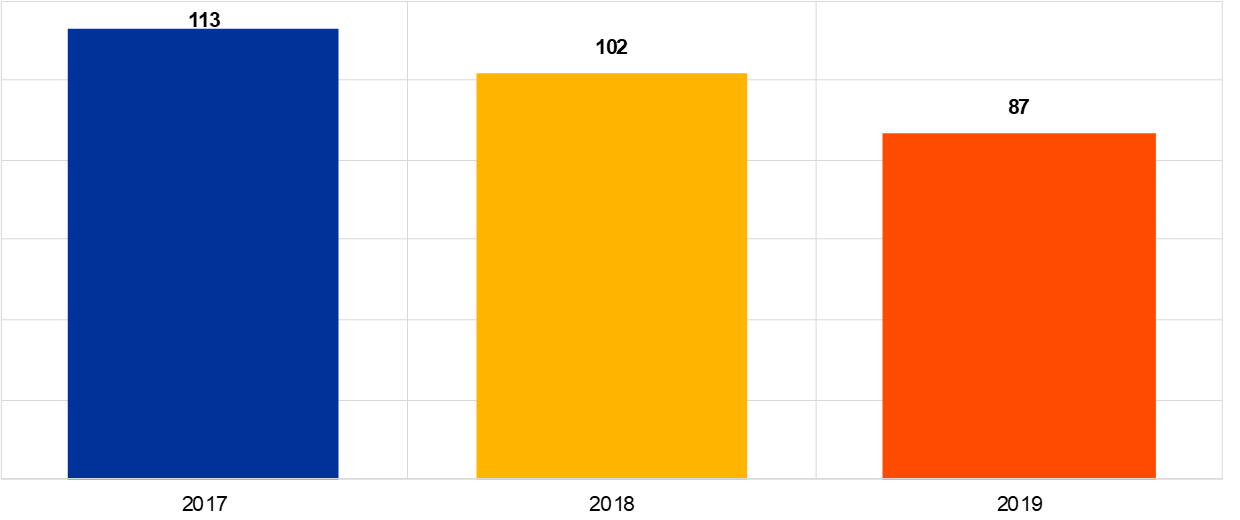
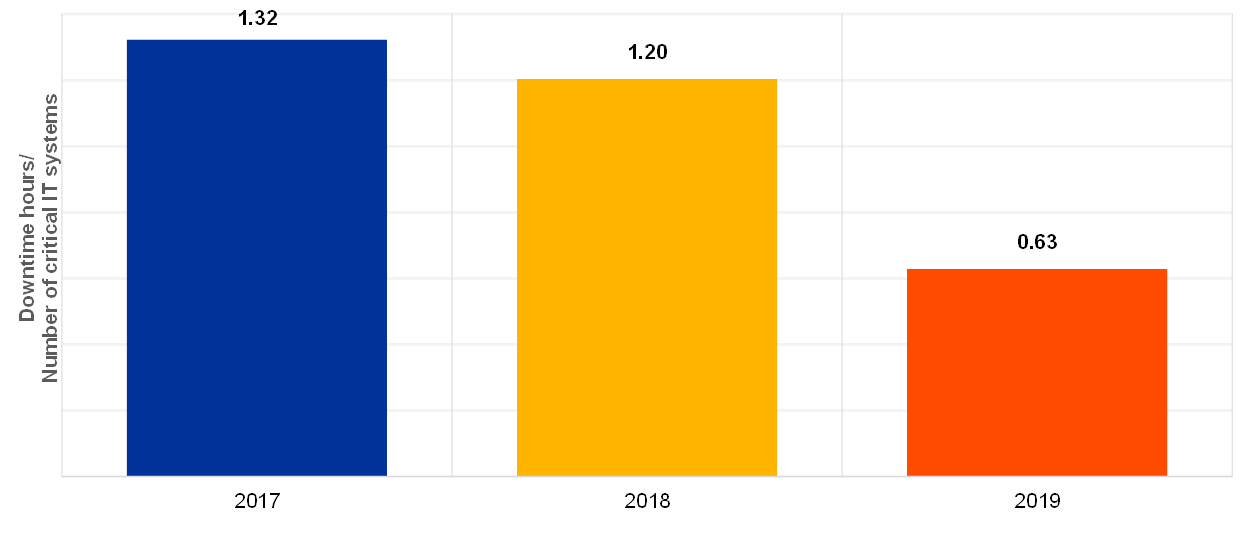
For IT availability and continuity, the analysis shows a decrease in the overall average unplanned downtime of critical IT systems when compared with previous years (Chart 7). The overall number of critical findings regarding IT availability and continuity risk that have not been remediated for longer than one year was reported to have decreased by nearly 15% compared with 2018 (Chart 8).
Chart 7
Overall average unplanned downtime (in hours) in the reference year per overall average number of critical IT systems
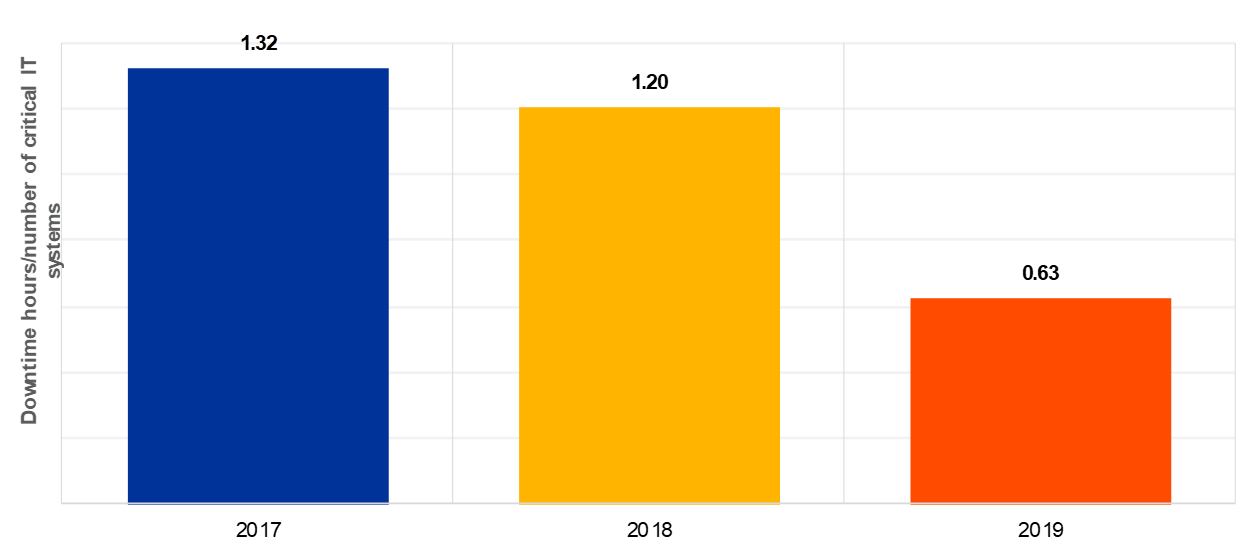
Chart 8
Total number of critical IT findings on availability and continuity not remediated for longer than one year
The improvements in IT availability and continuity show an overall positive trend. Nevertheless, as risk levels remain very high, institutions are advised to continue evaluating and improving their contingency plans and capabilities to be prepared for a variety of possible crisis scenarios (in line with EBA/GL/2019/04, Section 3.7 Business continuity management).
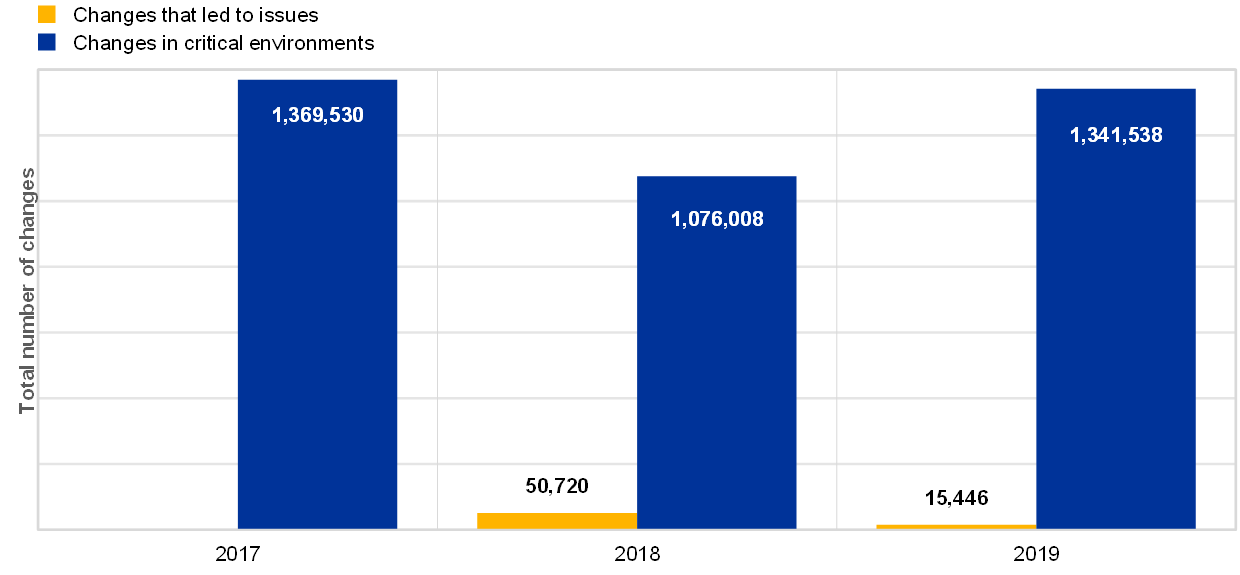
In IT change risk, although the overall number of IT changes has increased, the number of changes that led to issues substantially decreased (Chart 9). Even with this improvement, change remains a significant source of incidents affecting critical IT environments.
Chart 9
Total IT changes in critical environments and changes that led to issues over a three-year period (number of changes that led to issues is not available for 2017)
ECB takes note of the improved figures around IT changes leading to issues. Nonetheless the ECB points to the importance of ensuring a sound and controlled process for managing IT changes, in line with EBA/GL/2019/04, Section 3.6.3. ICT change management.
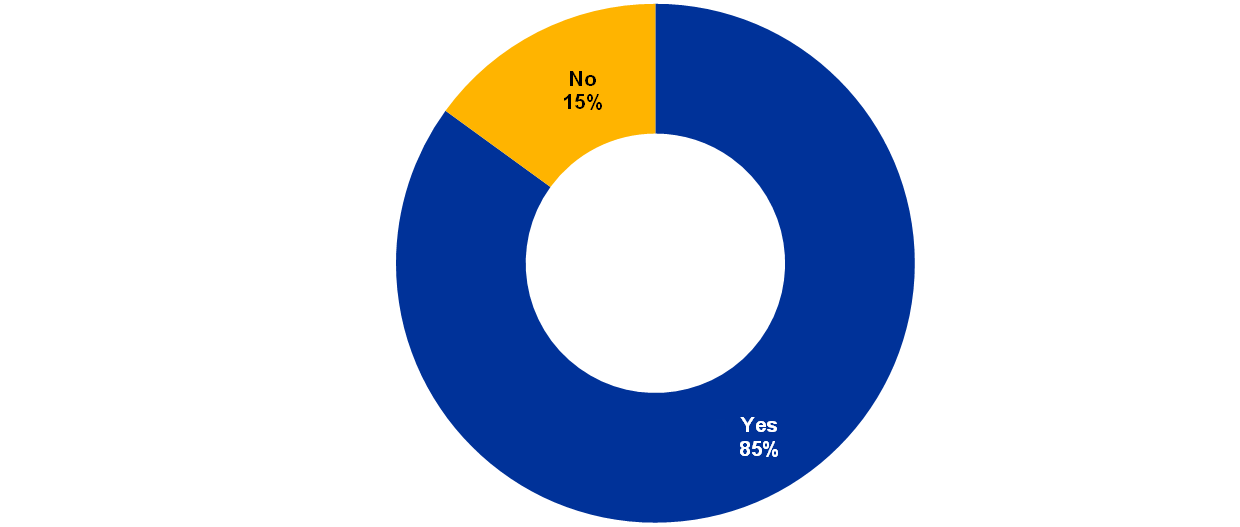
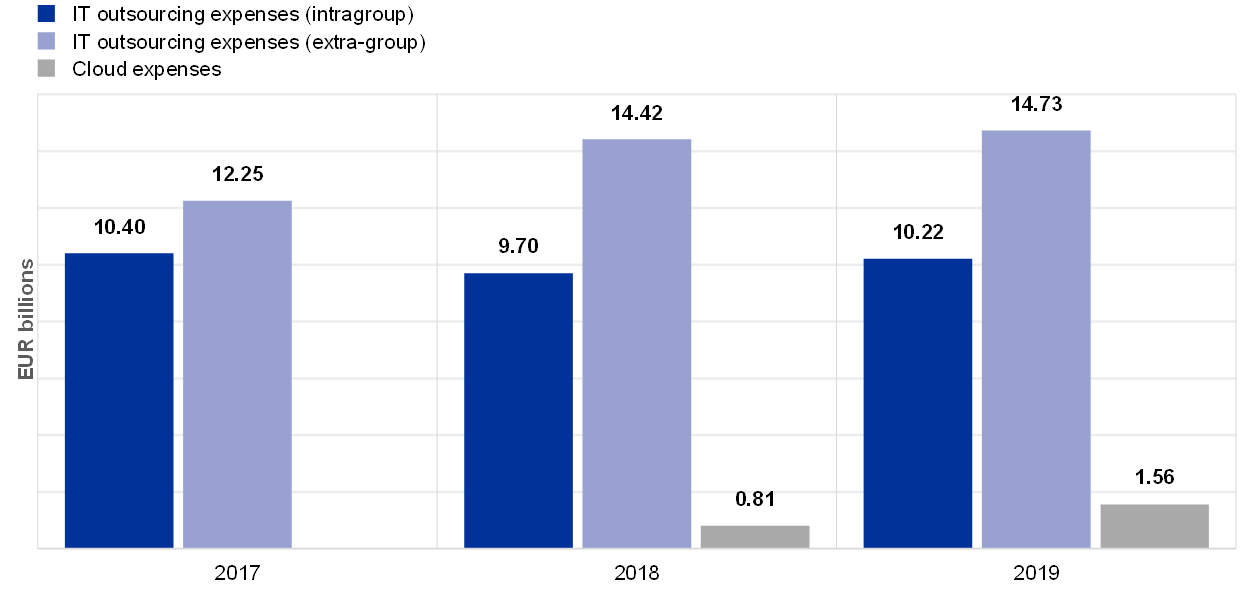
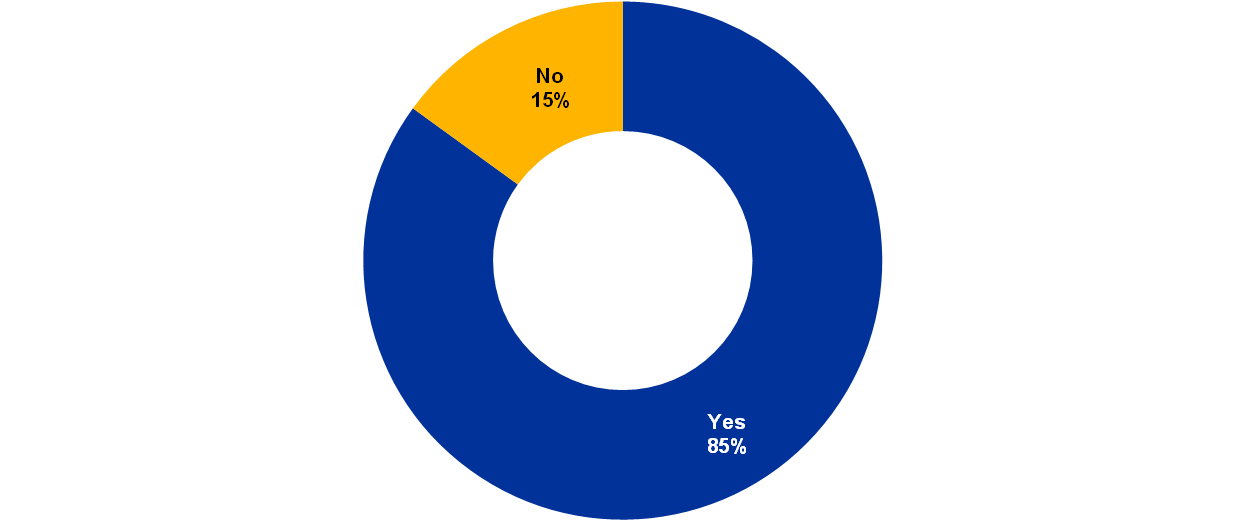
Regarding IT outsourcing, overall expenses have increased by 6% compared with 2018 (Chart 10). IT outsourcing covers a broad spectrum of services, ranging from IT infrastructure to application development. Most of the institutions (85%) reported that they use cloud services for at least some of their operations (Chart 11). Cloud expenses have nearly doubled, rising from 3% in 2018 to 6% in 2019 of the total IT outsourcing expenses.
Chart 10
Total IT outsourcing expenses by category over the last three years (the amount for cloud expenses is not available for 2017)
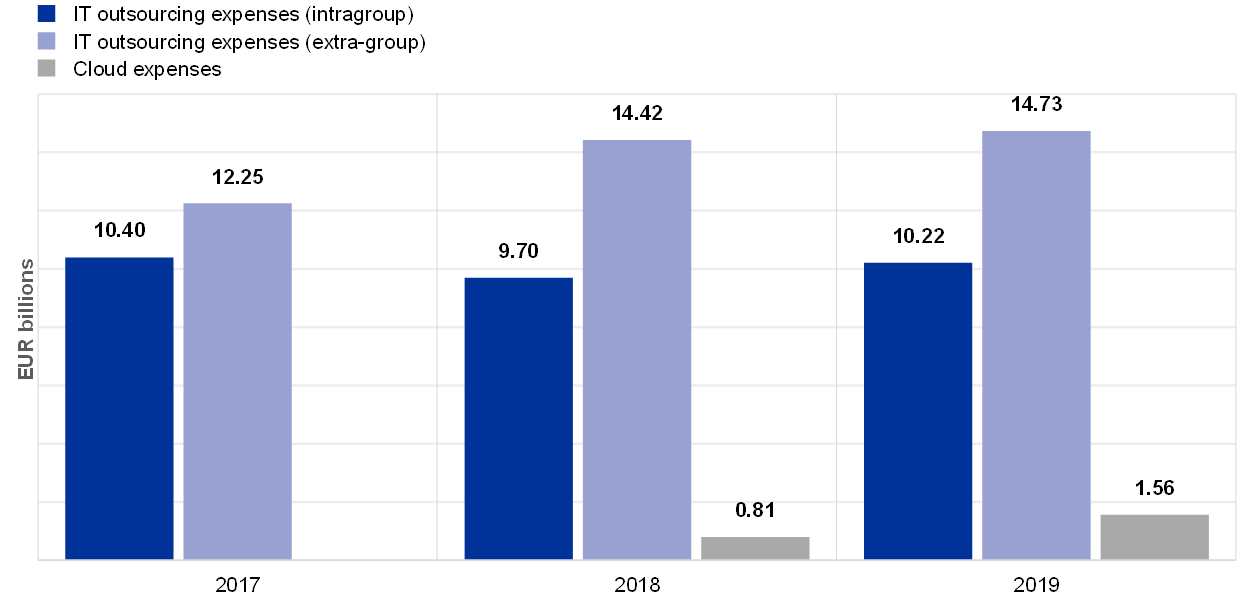
Chart 11
Percentage of institutions using any form of cloud computing services (reference year 2019)
ECB Banking Supervision continues to exercise enhanced scrutiny of IT outsourcing activities, including cloud outsourcing, and their monitoring by the institutions. In line with the EBA Guidelines on outsourcing arrangements, ECB Banking Supervision expects full compliance with the applicable regulation regarding outsourcing[10] within the respective timeline[11].
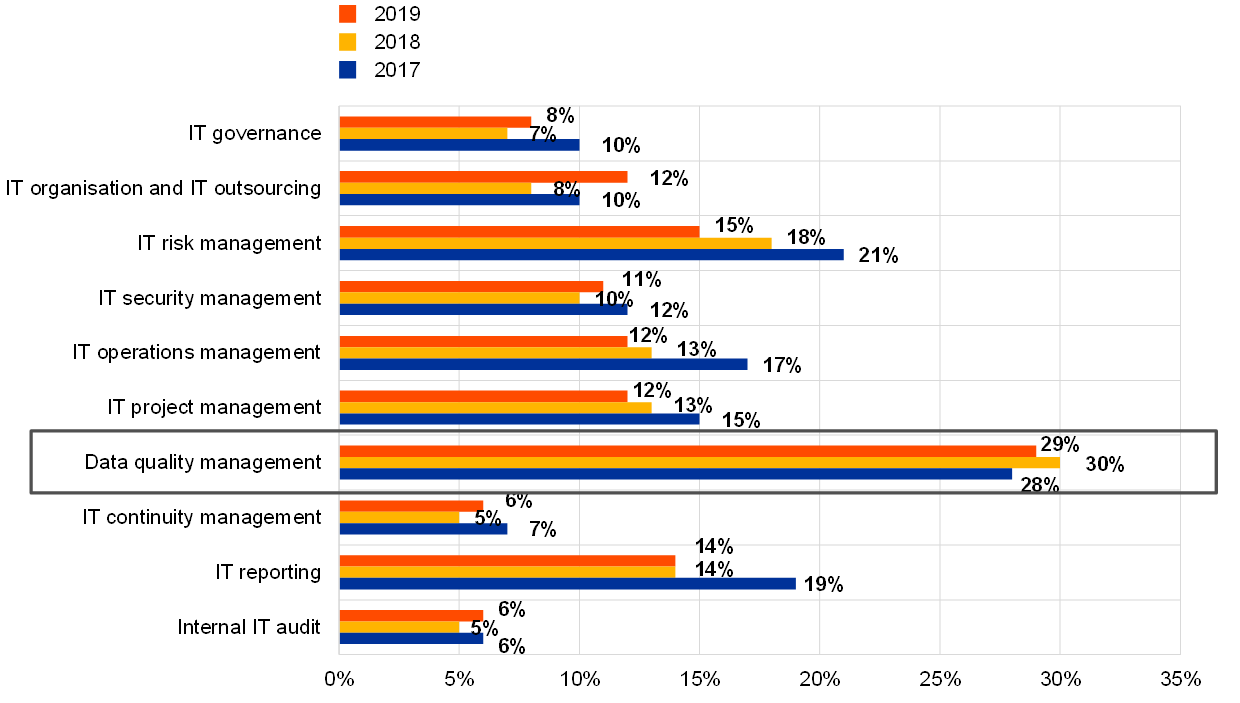
IT data quality management remains the least mature risk control category when compared with the other control categories (Chart 12). Furthermore, the trend shows that the situation does not seem to be improving.
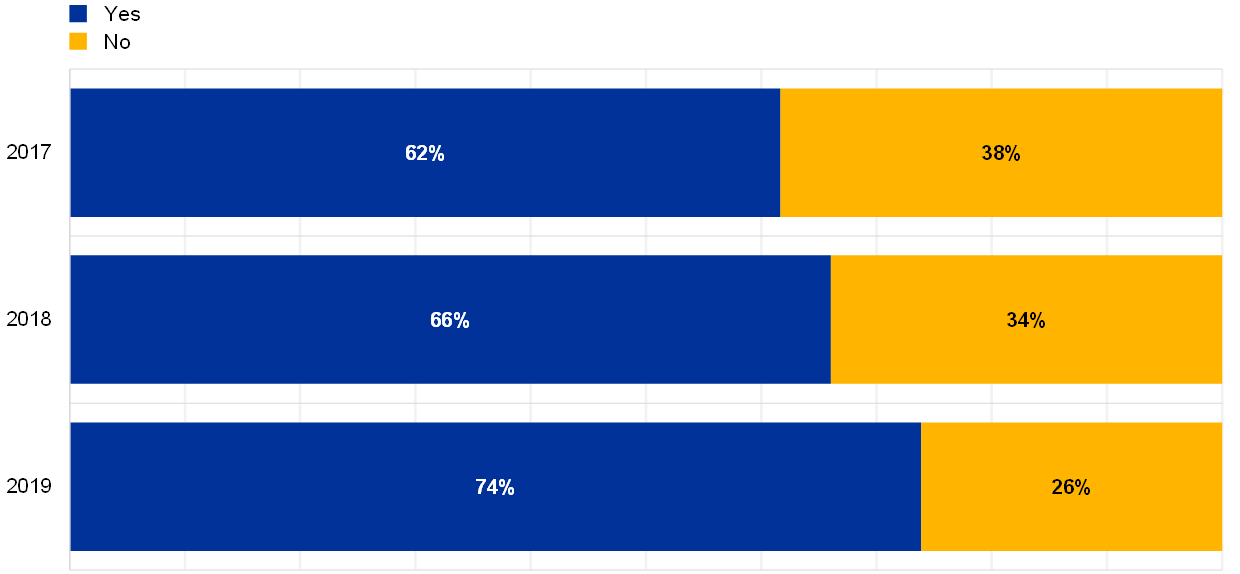
Good data quality management is usually supported by proper data classification that sets the levels of confidentiality, availability and integrity required by the businesses. In addition, data classification relies on clearly appointed data owners (Chart 13).
Chart 12
Percentage of controls not implemented by the institutions, grouped by IT risk control category, for the last three years (percentage of “No” answers over total answers)
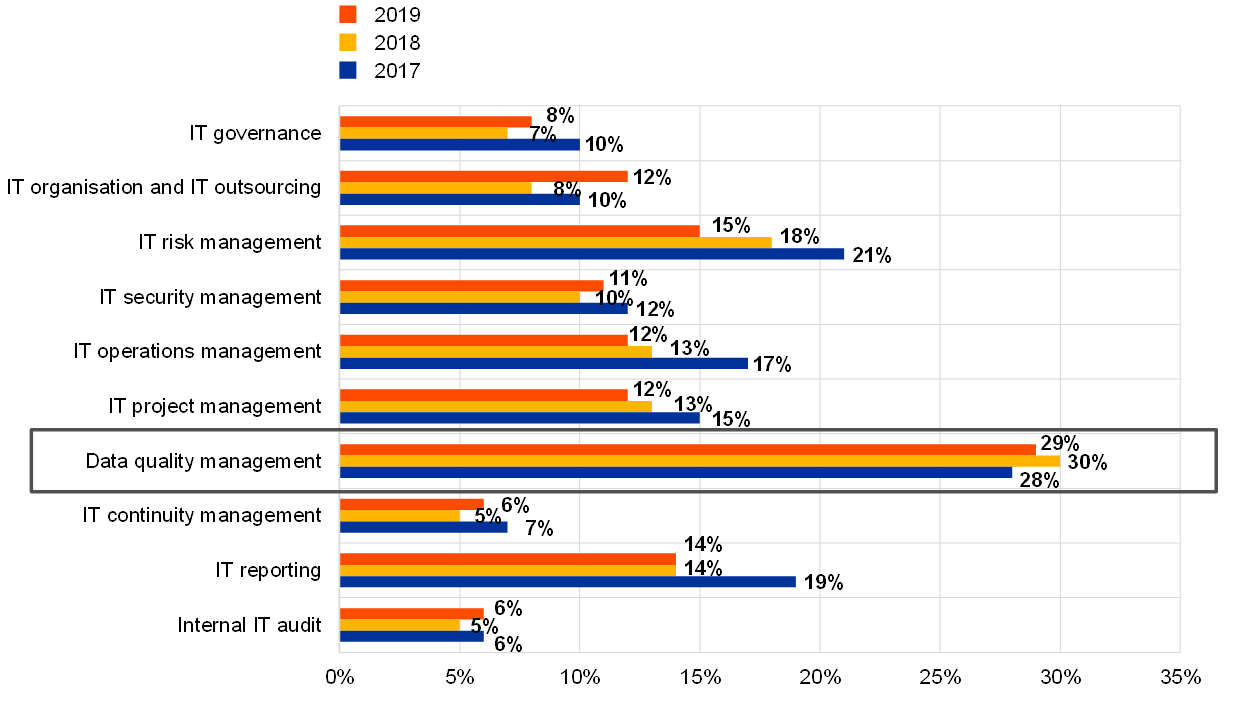
Chart 13
Percentage of institutions for which information owners are determined
In order to properly conduct the data classification, clear owners of the information (categories) are determined
ECB Banking Supervision continues to emphasise the importance of clearly defined roles and responsibilities for managing data integrity in the ICT systems.
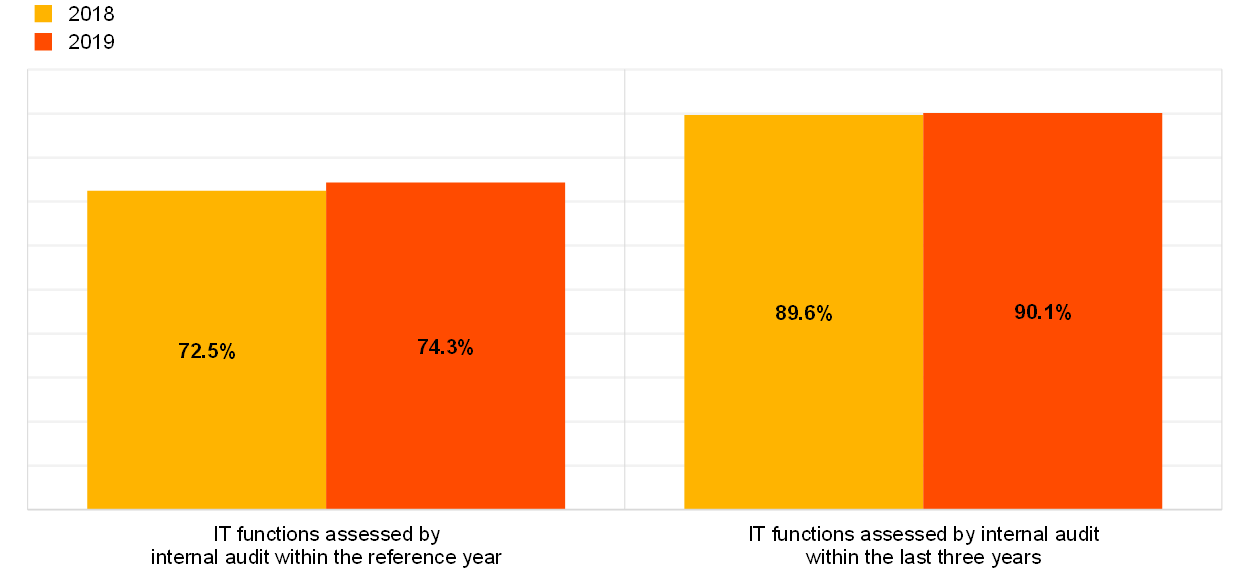
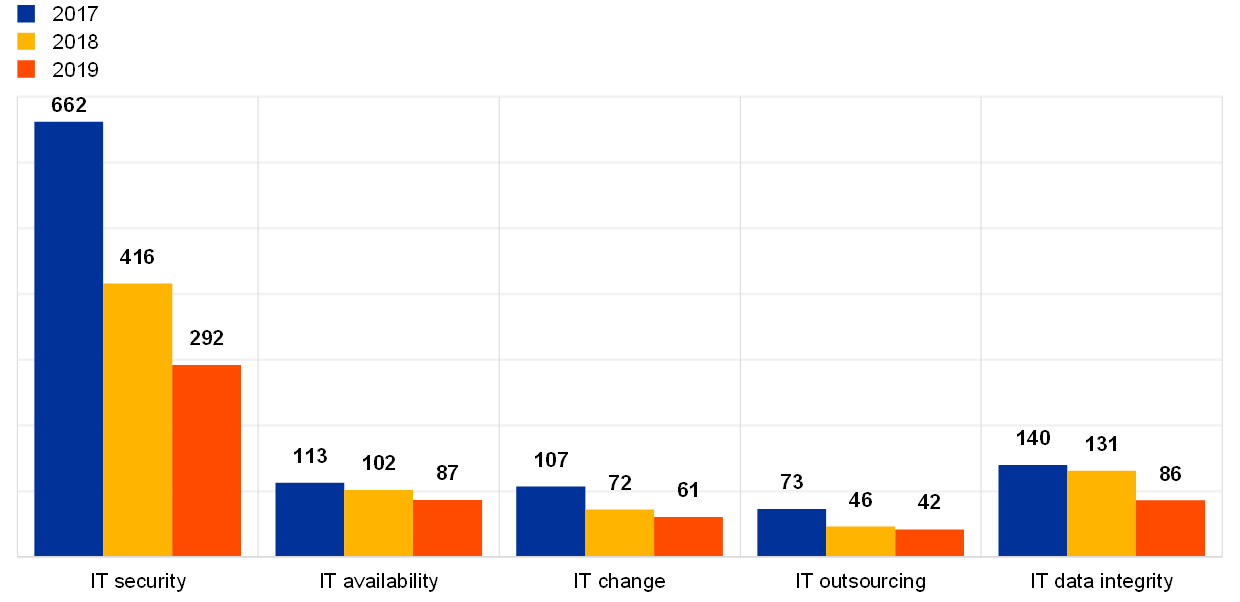
Looking at IT internal audit, the percentage of IT functions reviewed increased slightly during the reference year 2019 and also within the three-year cycle (Chart 14). However, only 50% of the institutions report that they have audited their entire IT functions within the last three years (Chart 15). The number of critical findings not remediated for longer than one year has continued to decrease, showing a downward trend of -26% with respect to 2018 (Chart 16). Finally, most of the institutions continue to report having sufficient skilled resources dedicated to IT audits (Chart 17).
Chart 14
Average percentages of IT functions assessed by internal audit within the reference year and within the three-year cycle
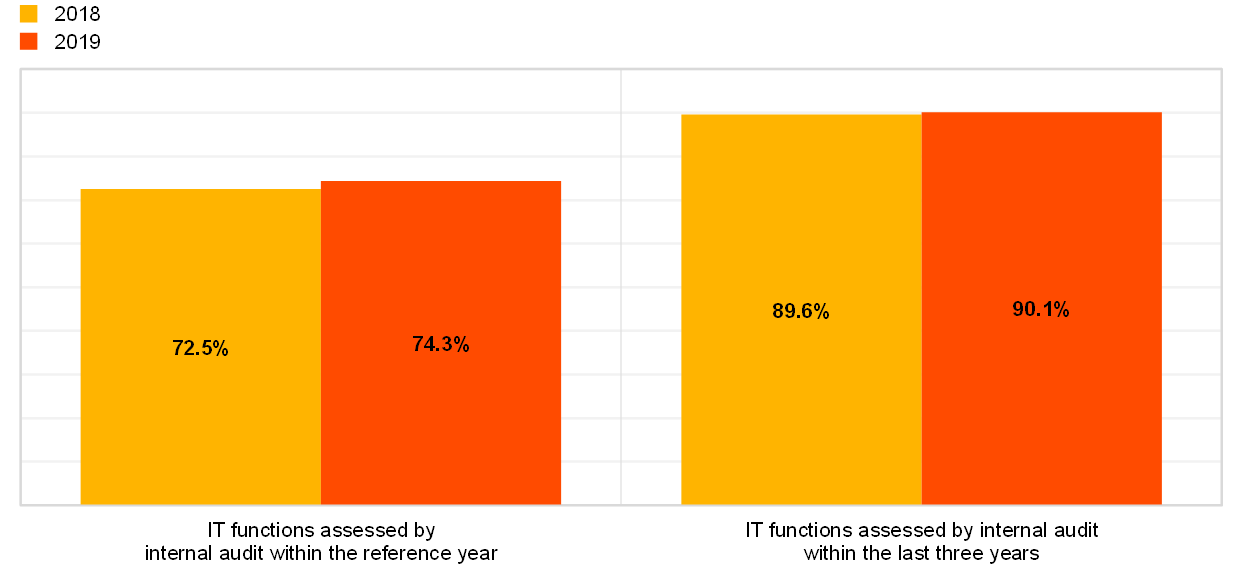
Chart 15
Breakdown of institutions by coverage of IT functions reviewed by internal audit between 2017 and 2019

Chart 16
Total number of critical IT findings not remediated for more than one year across IT risk level categories
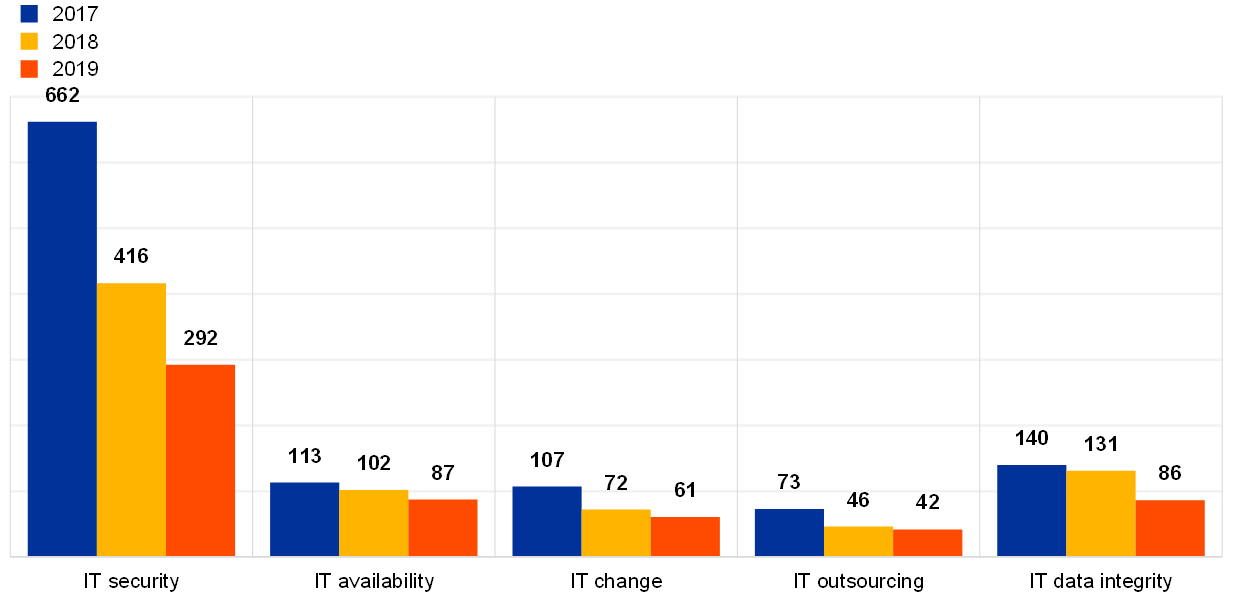
Chart 17
The internal audit function has adequate resources, both in terms of number of staff and of competences/skills, to properly perform IT audit activities
ECB Banking Supervision considers the comprehensive coverage of IT audits to be a key element of IT risk management. It is desirable that all the institutions’ critical IT functions be assessed by internal IT audit functions, in line with EBA Guidelines and professional standards.[12]
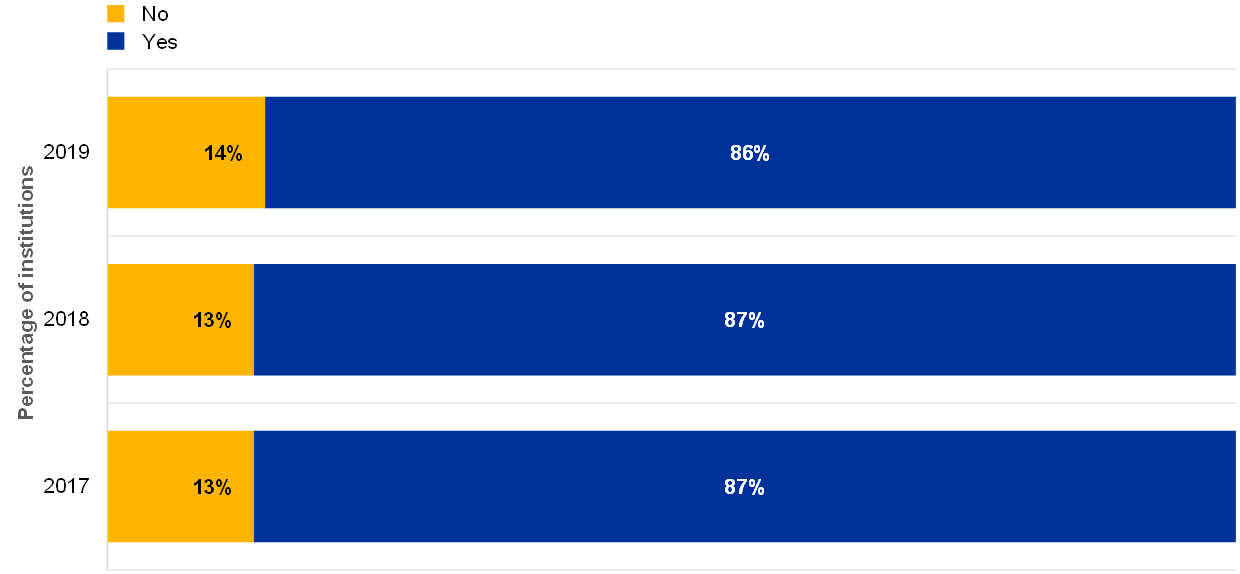
Regarding IT governance, 5% of the institutions still report not having functional independence between first and second lines of defence in IT risk (Chart 18).
Chart 18
Percentage of institutions for which there is functional independence between the first and second lines of defence in the IT risk area (reference year 2019)
Is there functional independence between the first and second lines of defence in the IT risk area?

ECB Banking Supervision continues to stress the importance of functional independence regarding IT between the first and the second lines of defence in line with EBA Guidelines EBA/GL/2017/11 paragraph 32.
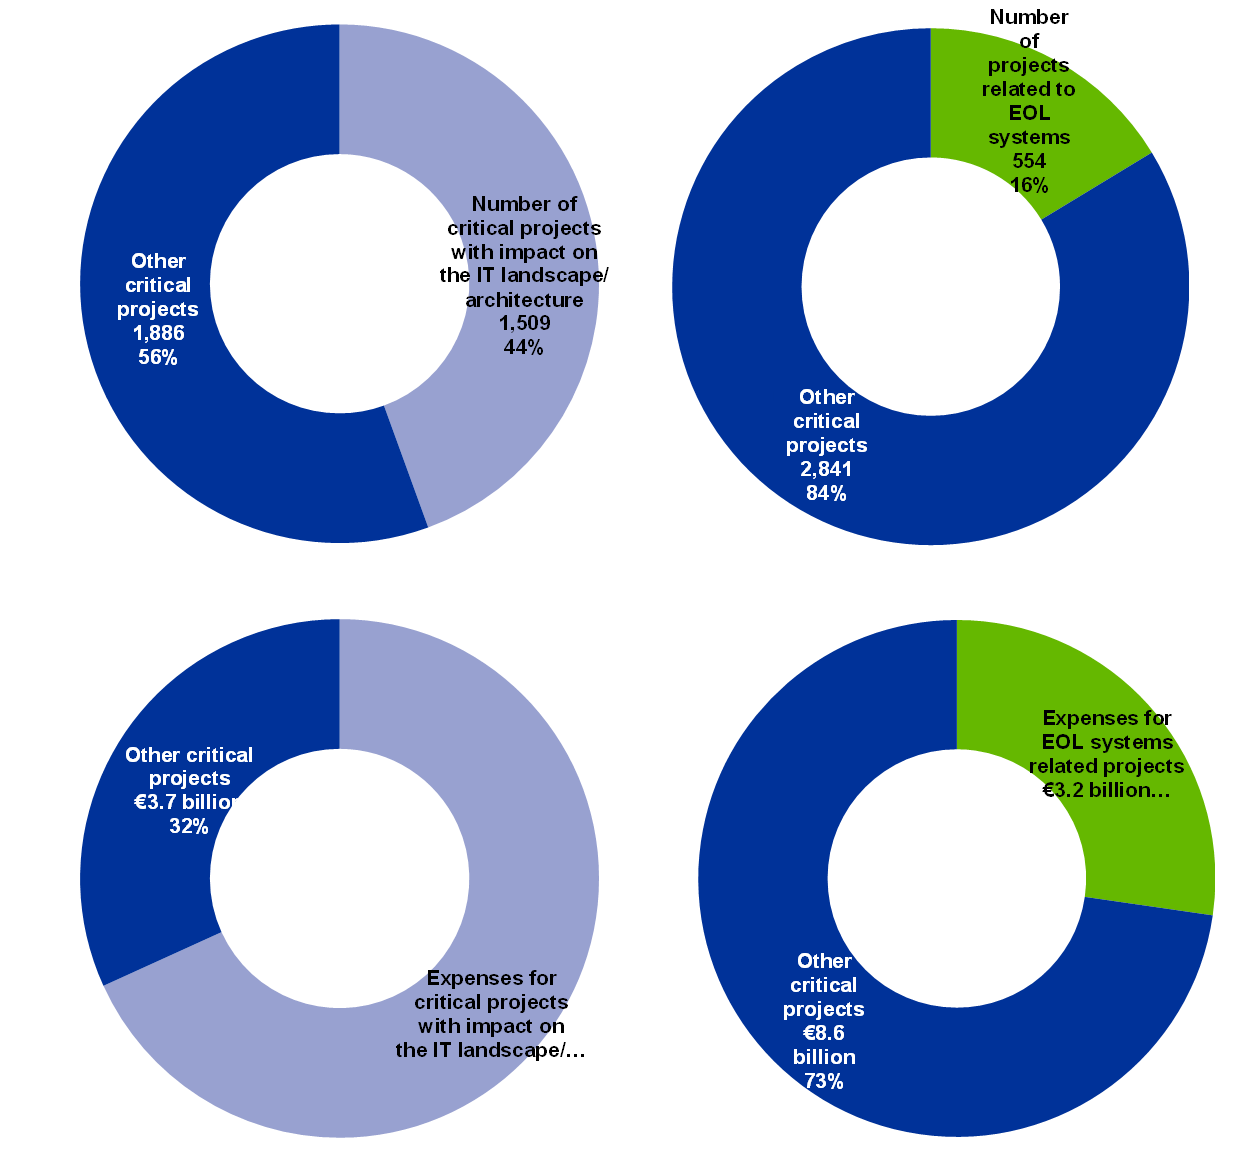
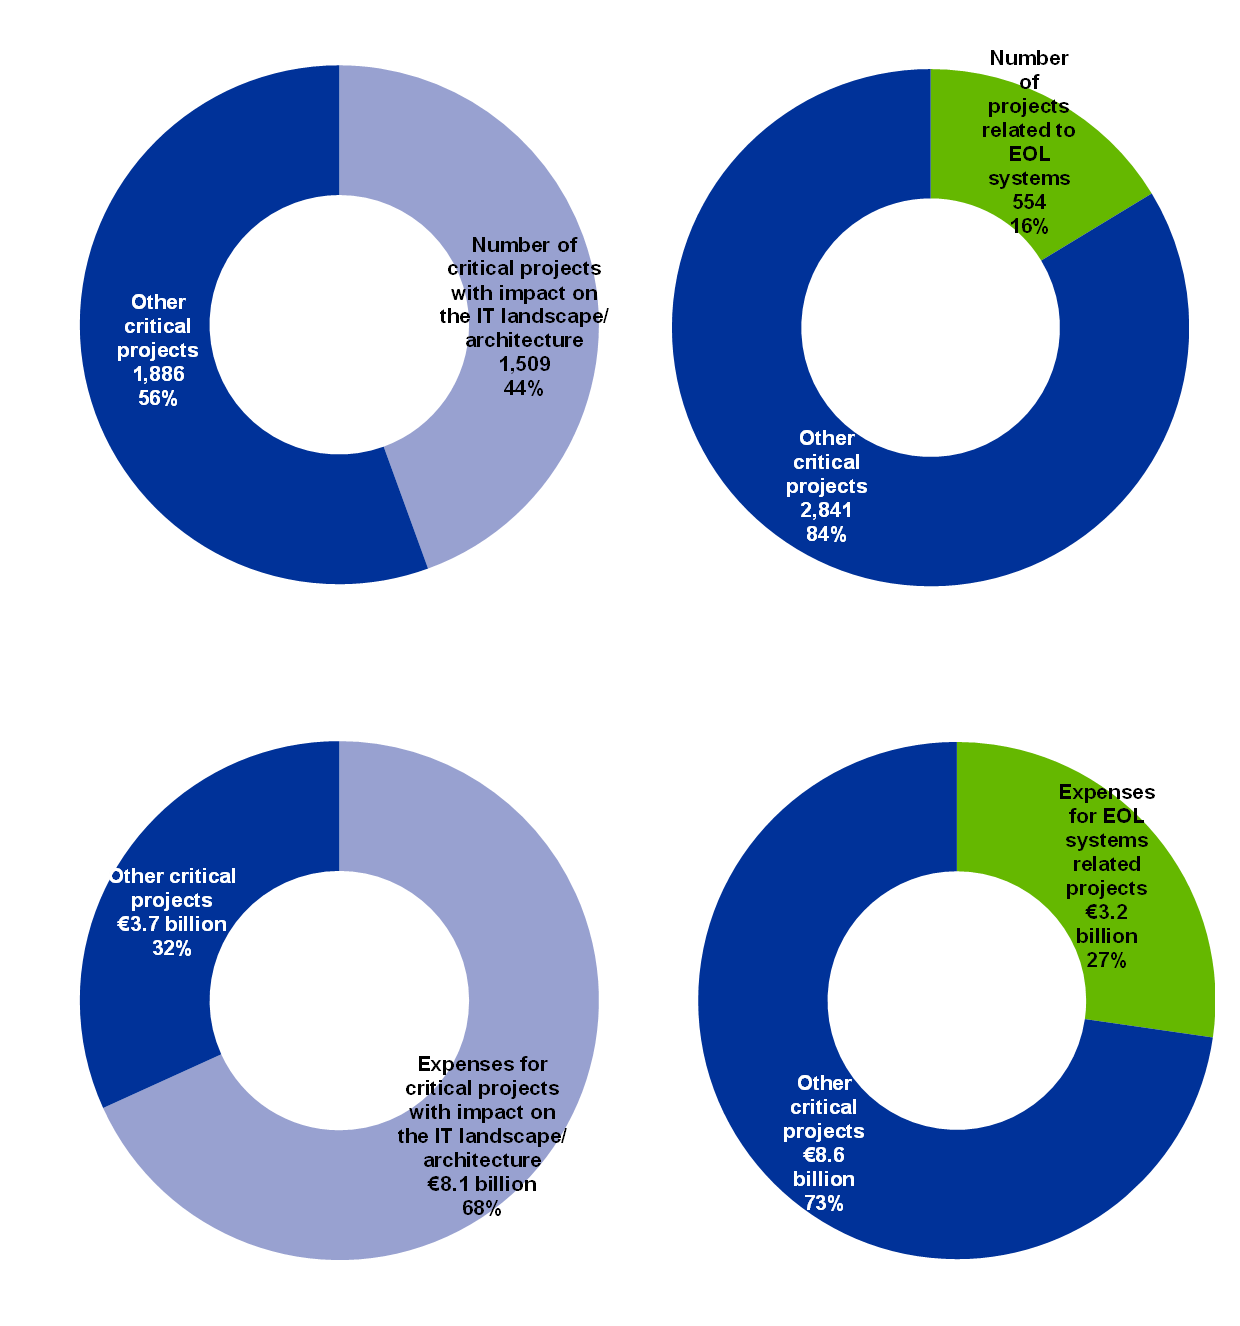
IT run and IT change expenses are reported as stable, and the overall IT budget is expected to slightly decrease for 2020 (Chart 19). The institutions also reported investing in projects with an impact on their IT landscape/architecture (€8.1 billion) as well as projects related to EOL systems (€3.2 billion) (Chart 20).
Chart 19
Distribution of IT run and change expenses across years (estimated numbers for 2020)
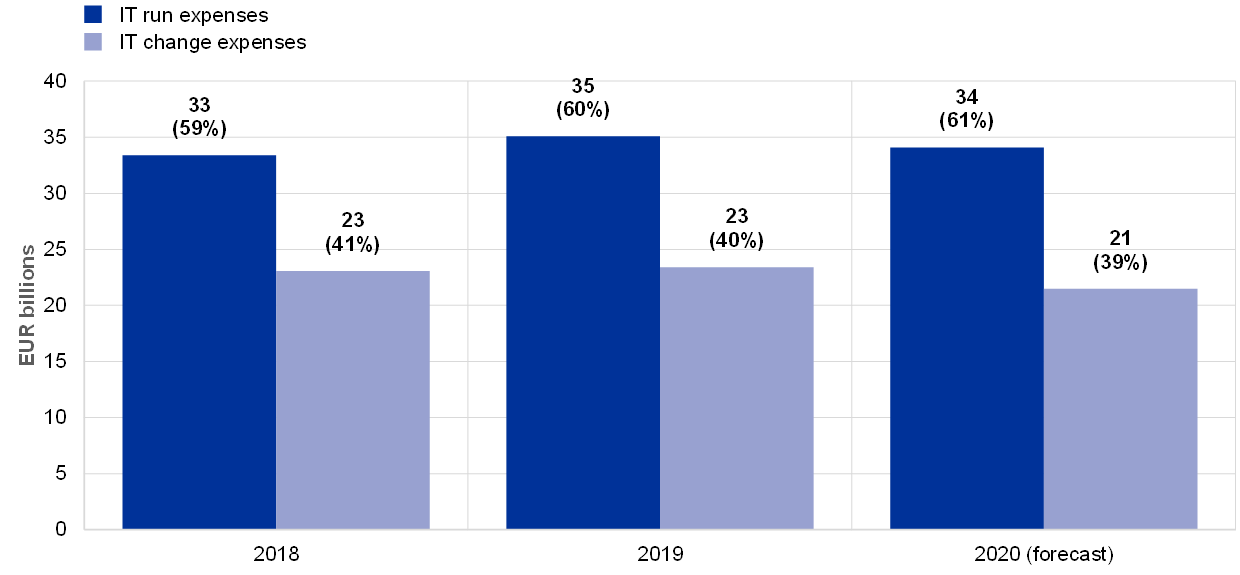
Chart 20
Overview of critical projects with significant IT undertaking (planned, in progress or completed in the reference year) and related expenses
In 2019, the 30 institutions with at least three board members with IT expertise show some distinguishing features. They reported to have on average (see Chart 21 and Chart 22):
- spent more on IT security (as a percentage of total IT expenses 8.7% vs. 4.3%);
- higher IT outsourcing expenses for cloud services (as a percentage of total IT outsourcing expenses 17% vs. 6%);
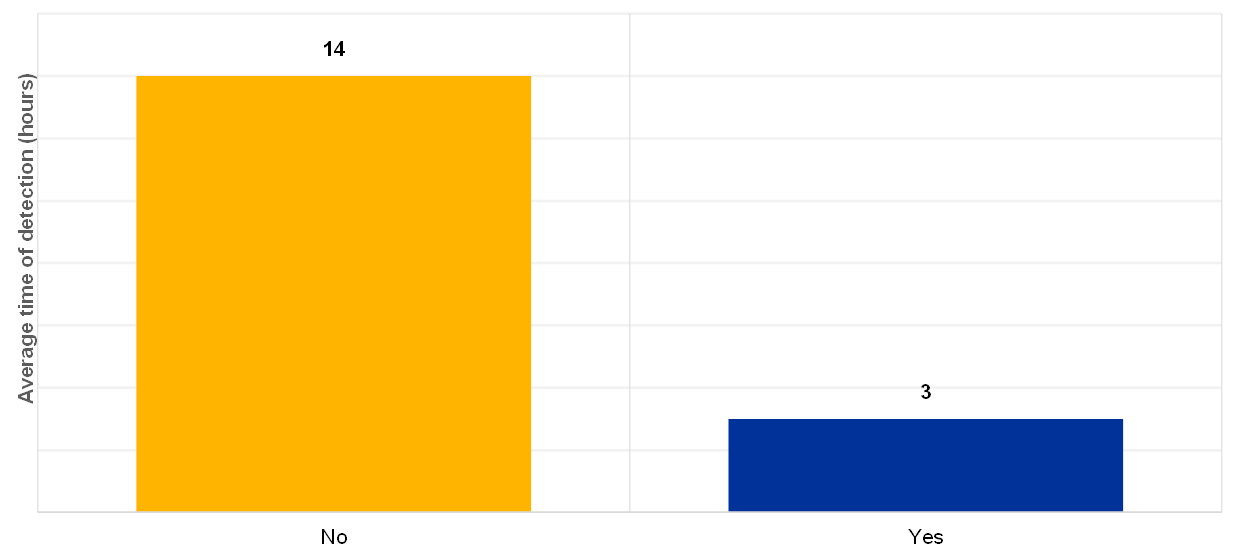
- a lower number of hours for detecting cyberattacks, both including and excluding distributed denial-of-service attacks (DDoS) (3 hours vs. 14 hours).
Chart 21
Overview of average IT security expenses over IT expenses and IT outsourcing expenses for cloud services over total IT outsourcing expenses for institutions with at least (or fewer than) three board members with IT expertise (reference year 2019)
Has the institution at least 3 Board Members with IT expertise?
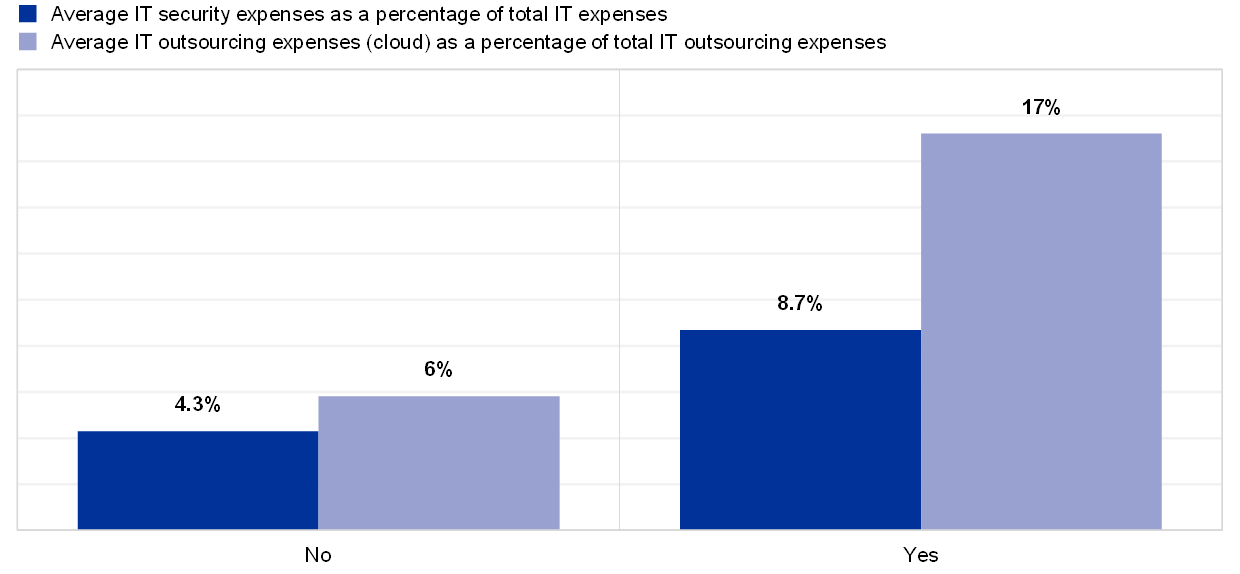
Chart 22
Overview of institutions with at least (or fewer than) three board members with IT expertise and their average time of detection of cyberattacks (reference year 2019)
Has the institution at least 3 Board Members with IT expertise?

The conclusions derived from the above horizontal analysis emphasise the importance of institutions improving their compliance with regulation, in particular with the EBA Guidelines on ICT and security risk management.
2 Detailed analysis
The IT Risk Questionnaire (ITRQ) is structured according to the five IT risk categories defined by the EBA: IT security risk, IT availability and continuity risk, IT change risk, IT outsourcing risk and IT data integrity risk. The risk levels for each of these five IT risk categories are self-assessed by the institutions. All risk level scores use the same scale, with “1” indicating the lowest risk level and “4” the highest risk level, to evaluate the exposure of the institution to these risks, not taking into account the controls and measures put in place by the institution to mitigate those risks.
In the ITRQ there are also ten IT risk control categories, split into 35 sub-categories to allow for deeper insight into how effectively the institution has implemented measures and controls to prevent or mitigate their IT risk. For each of these sub-categories, the institutions were asked to self-assess their IT risk control maturity, with “1” being the best score (high IT risk control maturity) and “4” the worst score (low IT risk control maturity). The individual questions in each of the 35 sub-categories are expected to substantiate the risk control self-assessment scores.
In addition, the ITRQ includes general questions about governance, the number of staff, budgets/expenses, the IT environment and IT audit. These questions provide background information so that individual scores about IT risk levels and IT risk control maturities can be better put into the relevant context and be better judged by the supervisors. under the Supervisory Review and Evaluation Proc
This detailed analysis contains seven chapters: five of these are based on the IT risk categories defined in the EBA Guidelines on ICT Risk Assessment under the Supervisory Review and Evaluation Process (SREP) (EBA/GL/2017/05). The last two chapters focus on IT internal audit and IT governance, emphasising the importance of an adequate internal governance environment and an effective implementation of the three lines of defence in the IT domain. All chapters follow the same structure (three sections):
- general description of the risk area;
- the assessment methodology;
- the main observations.
2.1 IT security risk
2.1.1 General description
The definition of IT security risk is directly derived from the EBA Guidelines (EBA/GL/2017/05)[13], which refer to “the risk of unauthorised access to ICT systems and data from within or outside the institution […]”.
IT security risk includes:
- the risk of unauthorised access to IT systems and data from within or outside the institution (e.g. cyberattacks);
- the risk of inadequate internal IT security, which could result in:
- unauthorised access to critical IT systems from within the institution for different purposes and by a variety of techniques;
- unauthorised IT manipulations due to inadequate IT access management procedures and practices;
- security threats due to a lack of security awareness whereby employees fail to understand, neglect or fail to adhere to IT security policies and procedures;
- unauthorised storage or transfer of confidential information outside the institution;
- the risk of inadequate physical IT security, such as the misuse or theft of IT assets via physical access, causing damage; the loss of assets or data; and deliberate or accidental damage to physical IT assets caused by terrorism, accidents or unfortunate manipulations by staff of the institution and/or third parties.
2.1.2 Methodology
The institutions were asked to assess their own IT security risk from various angles. Information is considered to be sensitive when its leakage, alteration, or destruction could have an impact on the institution’s business or the ability to comply with regulation. The institutions were asked to provide:
- the number of external companies having access to internal systems or sensitive data;
- the number of security incidents that have resulted in data breaches;
- the total number of IT systems connected to an external network;
- the number of EOL[14] systems that support business-critical processes;
- the number of EOL systems connected to an external network;
- the number of IT security incidents.
Another aspect touched upon by the ITRQ relates to the activities carried out by institutions to detect and to mitigate known vulnerabilities. The institutions provided insights about penetration tests, vulnerability scanning and findings related to IT security risk.
In order to assess their IT security risk control, the institutions were asked detailed questions related to:
- information security policies and procedures: to assess whether the controls are documented, approved by their management and supported by investments in human and technical resources;
- security reviews: to evaluate whether the reviews are carried out regularly by independent parties;
- IT security awareness: to collect information on training sessions and information campaigns for staff;
- physical security: to understand whether the institutions have implemented adequate physical controls to protect office premises, data centres and sensitive areas;
- identity and access management: to assess whether the institution has practices in place to ensure controlled access for systems and data;
- patch and vulnerability management: to check whether the institution has processes in place to identify vulnerabilities and to regularly update their systems with patches and bug fixes;
- network security, including remote access: to assess whether the institutions have perimeter defences to protect their IT systems from external intrusion;
- security event logging and monitoring: to better understand the action taken by the institution in the case of a security event;
- malware prevention: to assess the institution’s level of protection against malware;
- data classification: to assess whether sensitive assets are appropriately classified.
2.1.3 Main results and observations
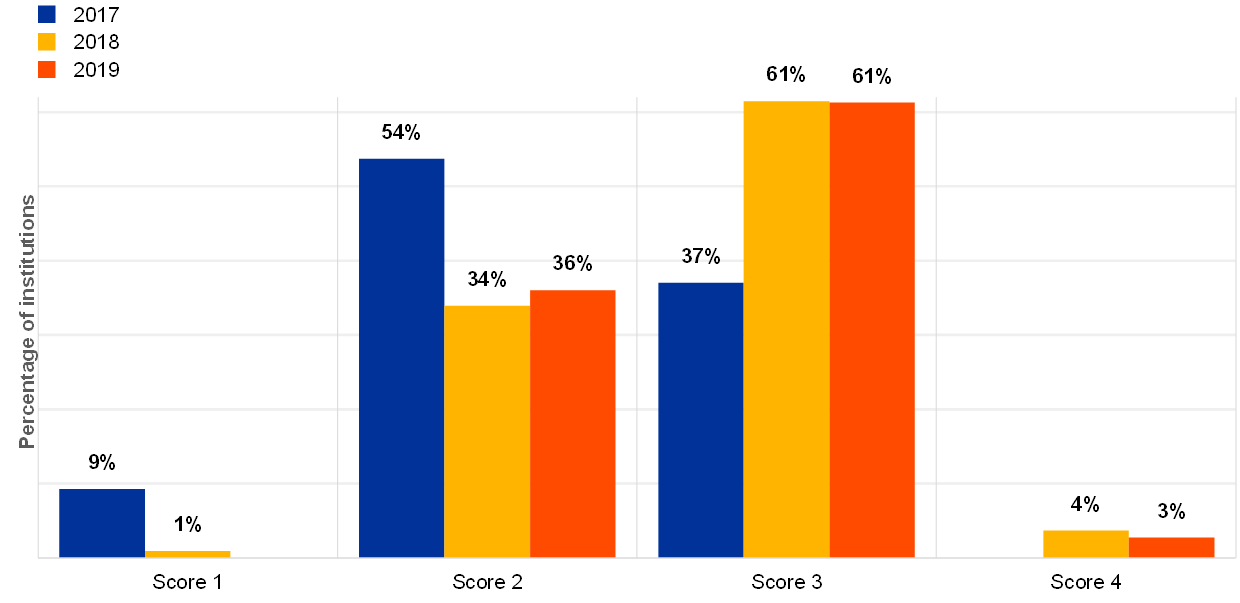
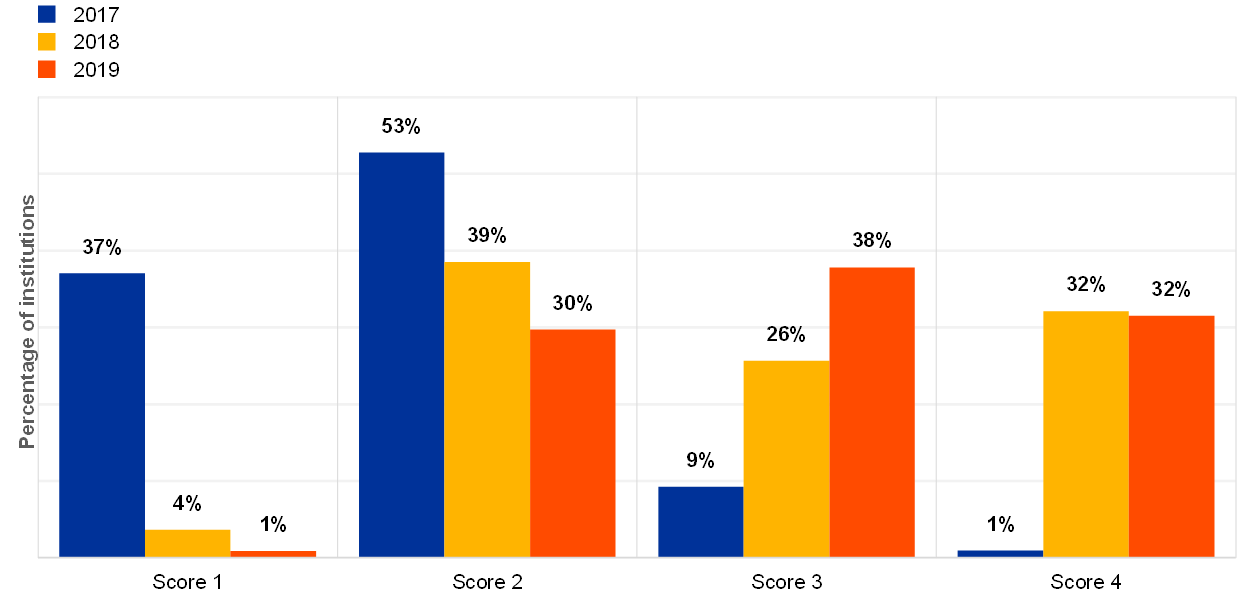
The institutions reported an increase of their overall IT security risk level between 2018 and 2019.
Chart 23
Distribution of the overall IT security risk level self-assessment scores across the years
The institutions provided self-assessment scores for the controls they have implemented for the IT security risk. The figures below show a rather stable trend over recent years for the topics of IT security:
- security reviews (Chart 24);
- IT security awareness (Chart 25);
- IT physical security (Chart 26);
- data classification (Chart 27).
Chart 24
Institutions’ self-assessment scores for the IT risk control category “security reviews”
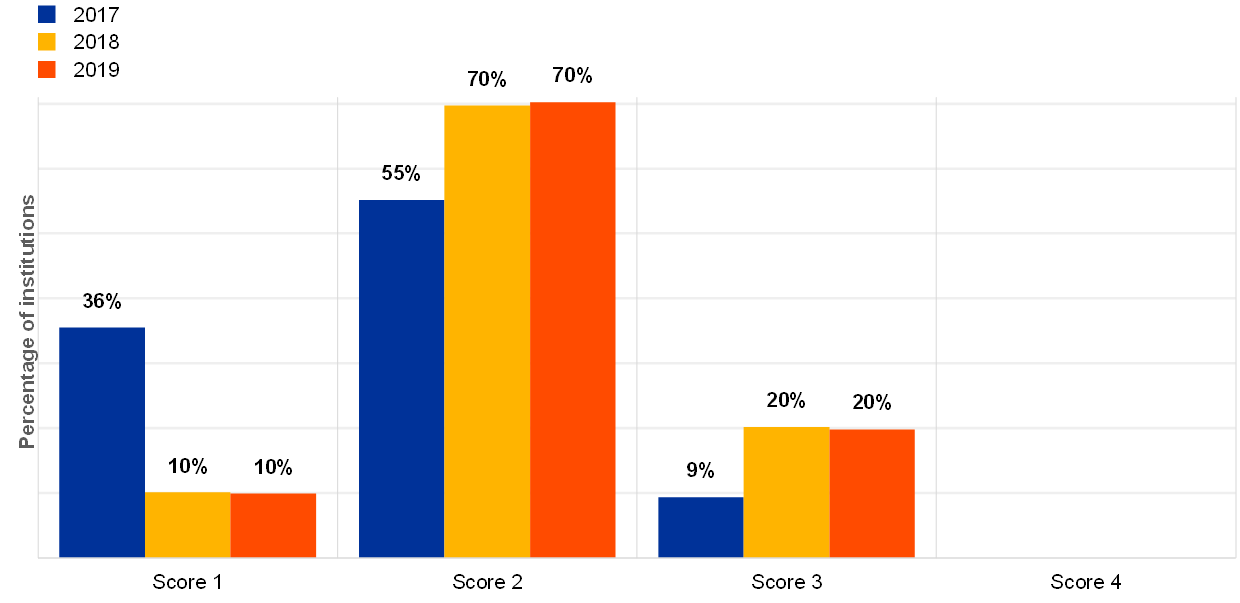
Chart 25
Institutions’ self-assessment scores for the IT risk control category “IT security awareness”
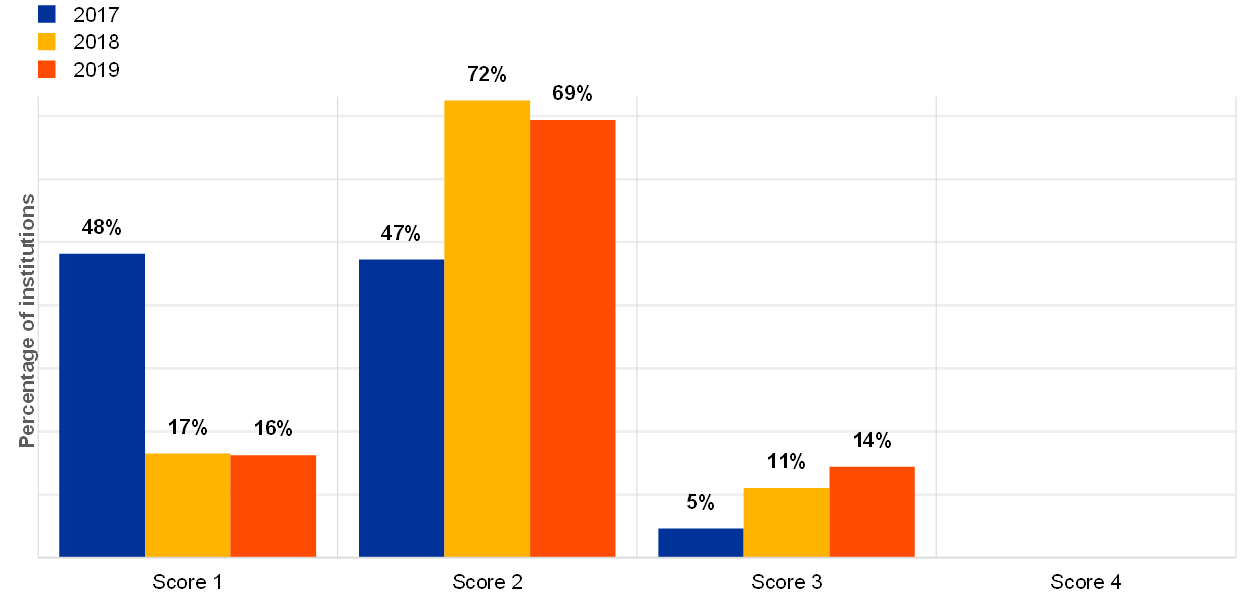
Chart 26
Institutions’ self-assessment scores for the IT risk control category “IT physical security”
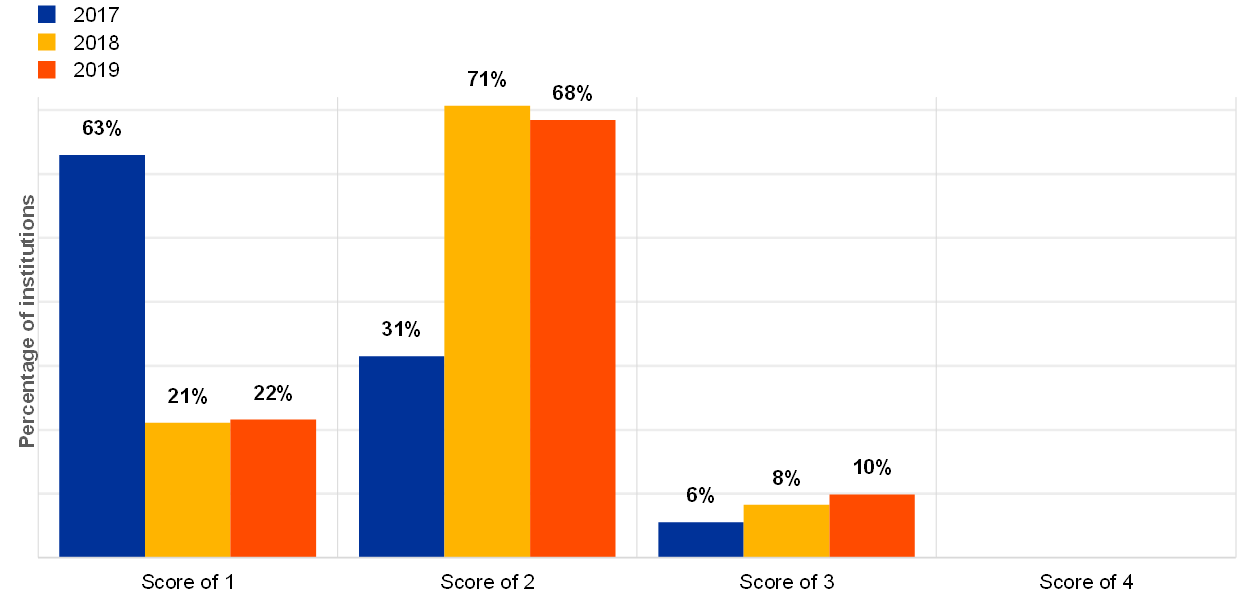
Chart 27
Institutions’ self-assessment scores for the IT risk control category “data classification”
A substantial number of institutions (40%) reported that they were the target of at least one successful cyberattack in 2019, representing a 43% increase from 2018. The number of successful cyberattacks, however, varied greatly across the different institutions.
More than 70% of institutions reported having insurance coverage for cyber risk.
In the reference year 2019, a question regarding detection time for cyberattacks was introduced. The reported data show significant differences between the different institutions (see Chart 28).
Chart 28
Average detection time, in hours, of all types of cyberattack per institution (excluding institutions reporting zero (0) hours of detection time, logarithmic y-axis scale, reference year 2019)
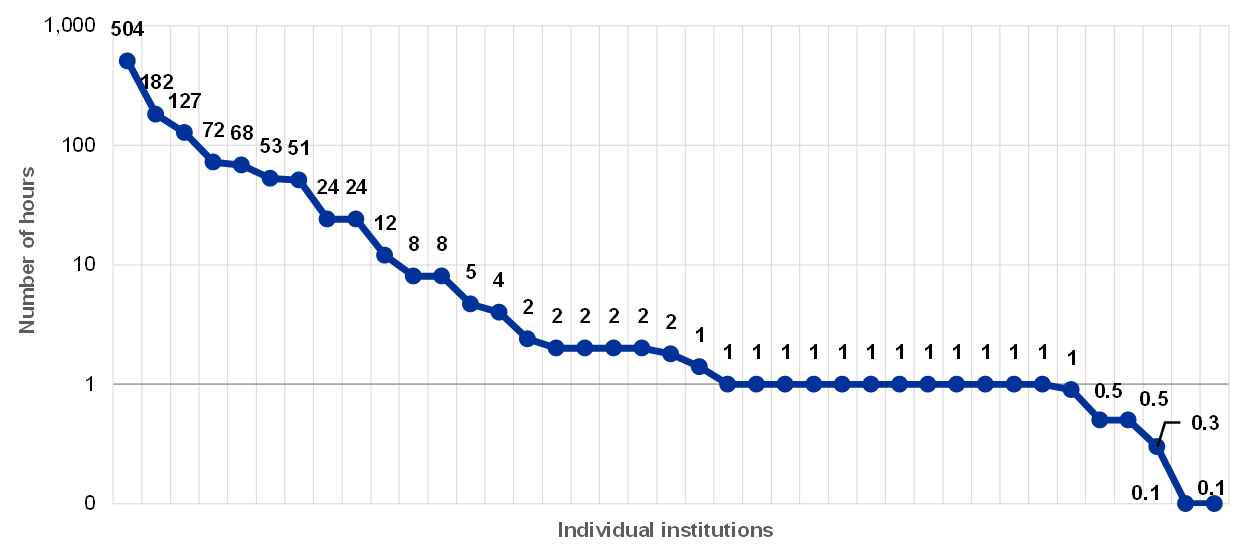
Detection time is an important indicator when assessing the institution’s ability to deal with cyberattacks. There were several cyberattacks for which detection took more than a week.
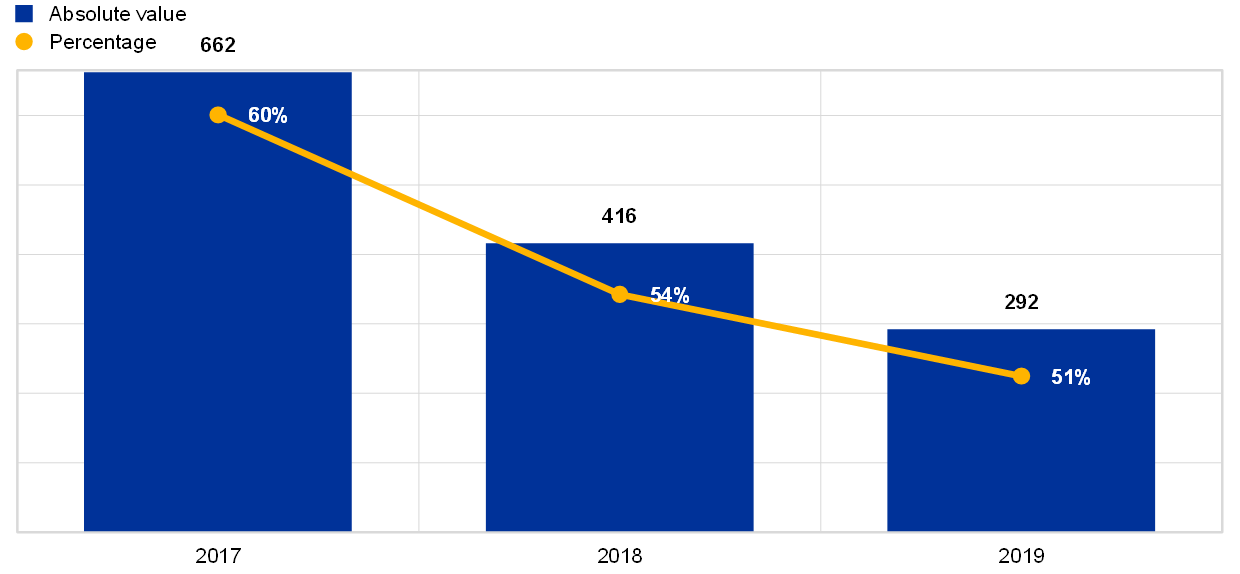
The highest number of critical findings not remediated for more than a year related to IT security issues, although the numbers show a decrease compared with the previous year.
Chart 29
Critical IT security findings not remediated for longer than one year; absolute values per reference year and percentage with respect to total number of findings not remediated for more than one year
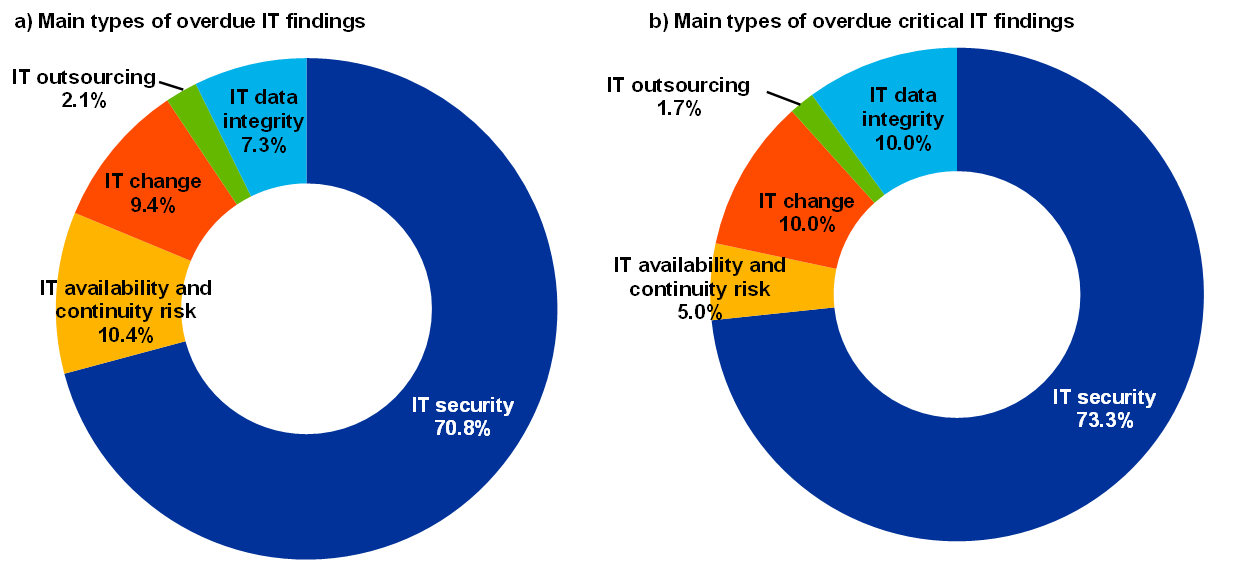
The majority of institutions reported that IT security is the category where they have the highest number of overdue IT findings as well as overdue critical IT findings[15] – 68 institutions (70.8%) and 44 institutions (73.3%) respectively.
Chart 30
Distribution of institutions per main type of overdue IT findings (a) and overdue critical IT findings (b) (reference year 2019)
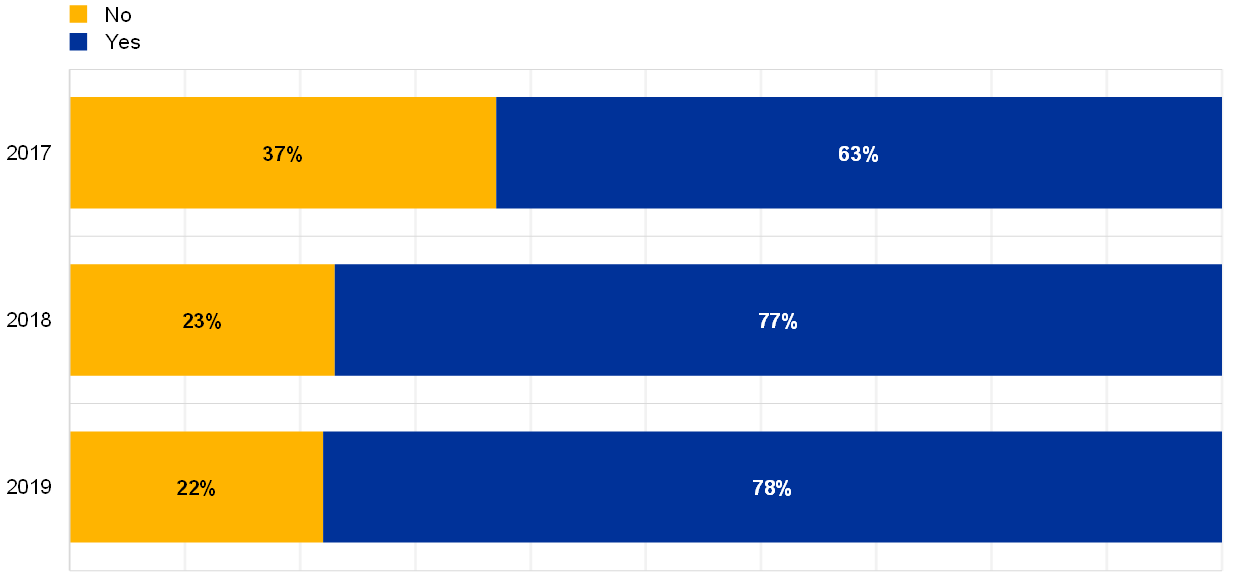
The total number of EOL systems supporting business-critical activities has increased[16]. However, the number of institutions that reported being dependent on at least one EOL system supporting business-critical activities is stable (around 78%) compared with the previous year. There are no migration plans within a three-year horizon for 32% of the institutions which have at least one critical EOL system.
Chart 31
Percentage of institutions relying on EOL systems supporting business-critical activities
Is the institution relying on EOL systems supporting business critical activities?
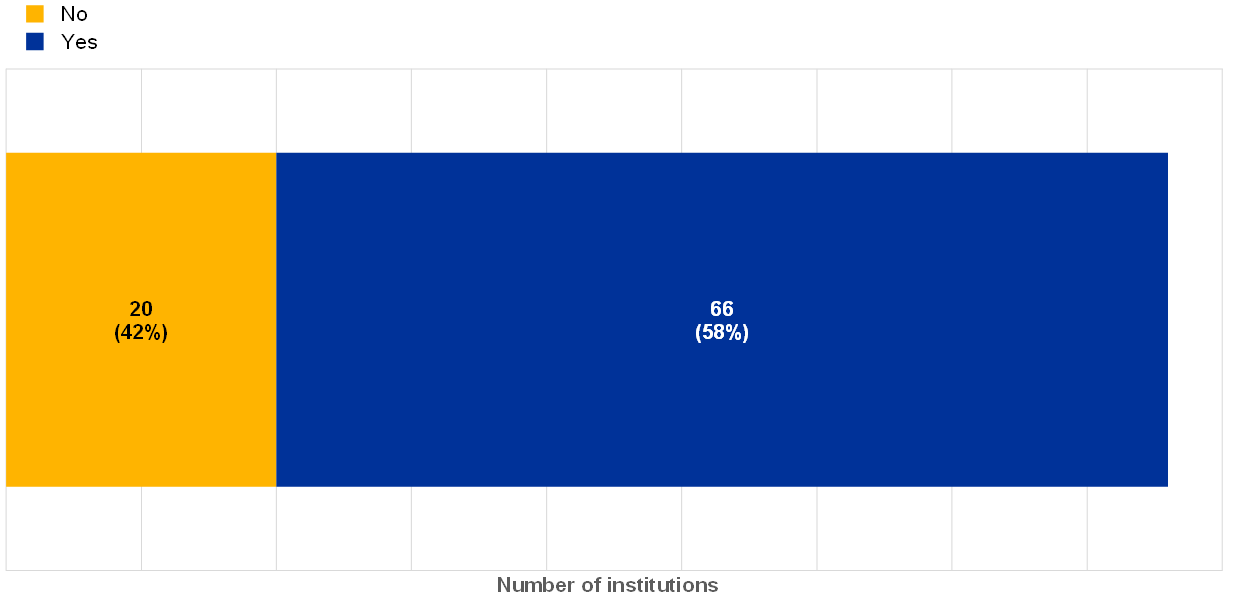
Some of the institutions (23%) reporting using the EOL system to support business-critical activities also reported that they do not identify, centrally document and analyse vulnerabilities within an acceptable timeframe.
Chart 32
For institutions which have at least one EOL system supporting critical activities, the percentage of those institutions which identify, centrally document, analyse, classify and patch vulnerabilities in an acceptable timeframe (reference year 2019)
Vulnerabilities are identified, centrally documented, analysed, classified and patched accordingly within an acceptable timeframe, coherent with the IT systems’ criticality
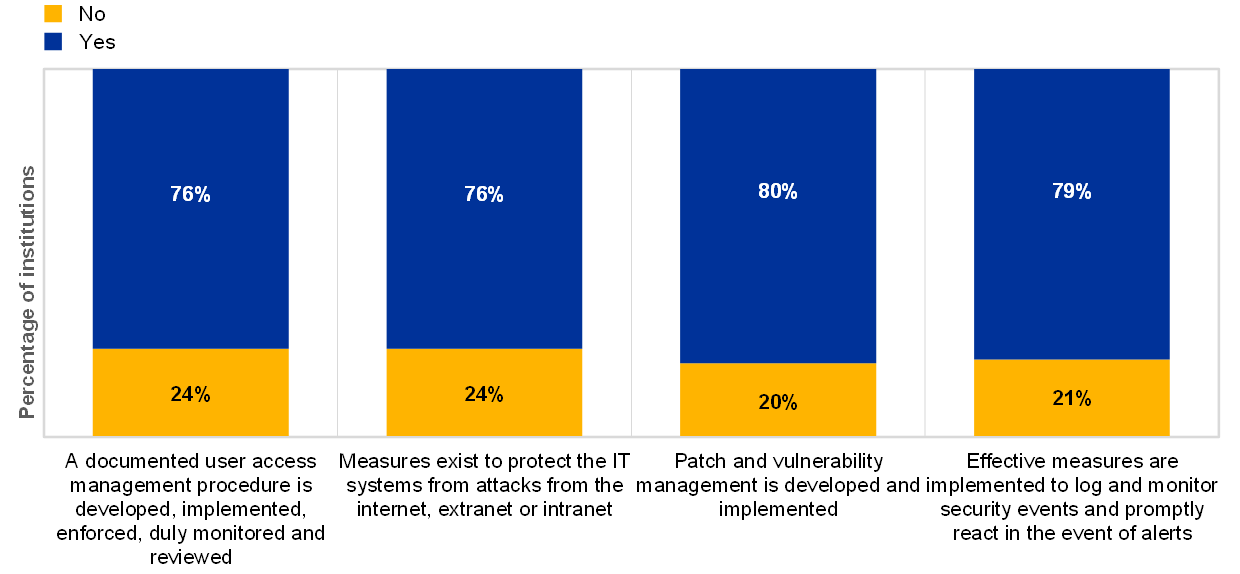
Between 20% and 24% of the institutions which had at least one successful cyberattack reported weaknesses in at least one IT security risk control. Out of these institutions, 17% have not implemented all the four risk controls below.
Chart 33
Percentage of institutions (among those that have suffered at least one successful cyberattack) that have implemented selected controls
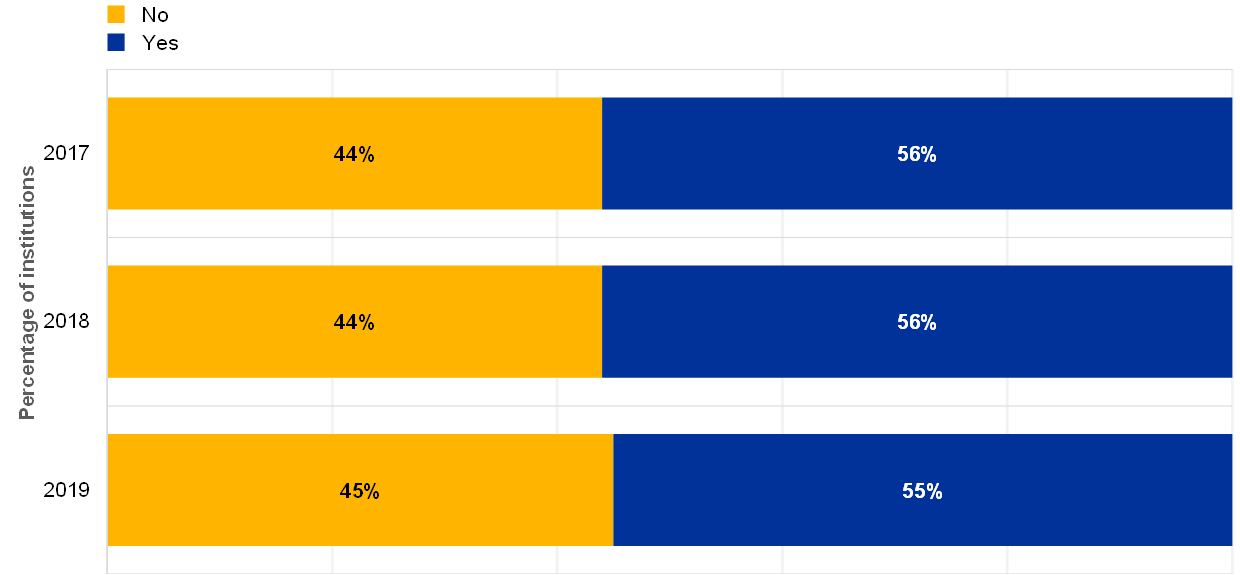
Over recent years, nearly half of the institutions reported that they have not implemented controls to protect against data leakage.
Chart 34
Percentages of institutions for which protection against data leaks is implemented, properly managed and continuously monitored, across years
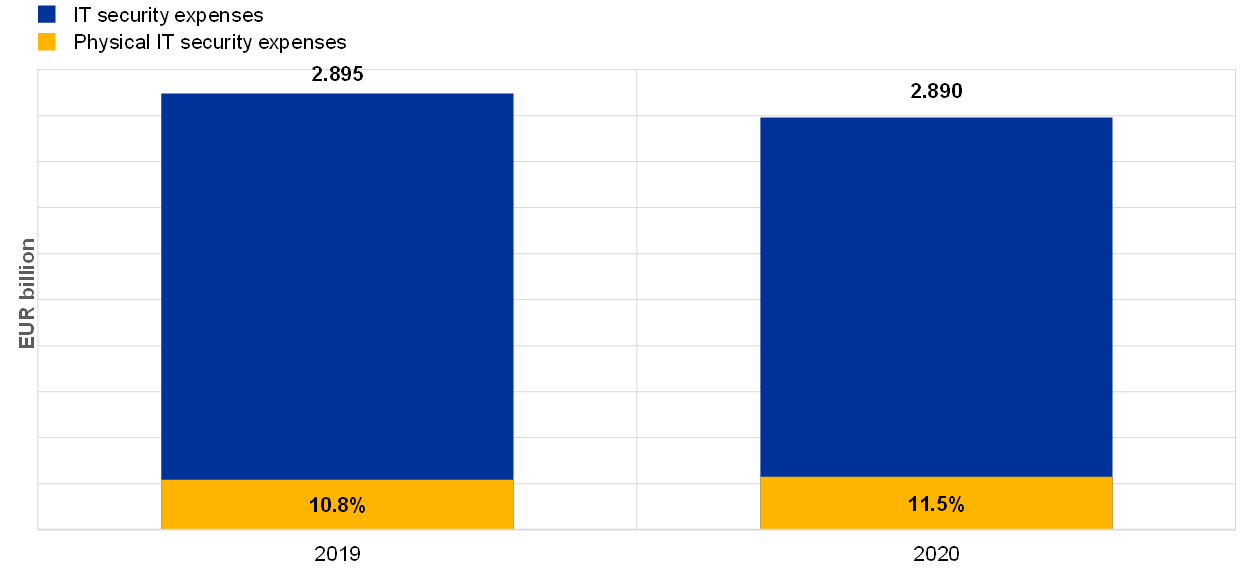
In 2019, institutions spent on average 5% of their IT budget on IT security and around 11% of the IT security expenses were dedicated to physical IT security. The institutions reported that in 2020 the budget for IT security will remain almost the same.
Chart 35
Overview of total IT security expenses in 2019, the forecast expenses for 2020 and the percentages of expenses dedicated to physical IT security
2.2 IT availability and continuity risk
2.2.1 General description
The EBA Guidelines (EBA/GL/2017/05) define IT availability and continuity risk as: “the risk that performance and availability of ICT systems and data are adversely impacted, including the inability to timely recover the institution’s services, due to a failure of ICT hardware or software components; weaknesses in ICT system management; or any other event […]”[17].
2.2.2 Methodology
The institutions’ risk levels for IT availability and continuity risk were assessed on the basis of two aspects in the ITRQ:
- resilience capability against a disruption:
- locations of business-critical IT operations/data centres;
- triggering of business continuity plan (BCP) or disaster recovery plan (DRP)[18];
- business impact in the case of a disruption of the IT system:
- online and mobile presence in distribution channels;
- unplanned downtime;
- losses caused by a disruption;
- systemic impact on the financial sector.
The effectiveness of an institution’s risk control framework for identifying, understanding, measuring and mitigating IT availability and continuity risk covered the following aspects:
- risk analysis, assessment and treatment: to identify an institution’s understanding of its critical activities, its services and its resources, as well as the availability of solutions to restore services in the case of IT failure;
- plans, processes and procedures: to assess whether the continuity and recovery plans are designed, maintained and regularly updated to minimise disruption to an institution’s operations, within acceptable limits;
- technical infrastructure and solutions: to assess whether, at least for its critical activities and services, the institution makes use of sufficiently robust, redundant and secure technical infrastructures and solutions;
- testing and continuous improvement: to assess whether the institution’s business continuity and disaster recovery solutions work effectively when needed;
- backups: to better understand and assess whether the institution backs up its IT systems in line with a predefined backup policy, considering the applicable regulatory requirements and business recovery requirements, how critical the underlying systems are and the sensitivity of the data;
- incident and problem management: as the monitoring of incidents is a prerequisite for triggering continuity solutions in a timely manner, this aspect assesses the effectiveness of an institution’s incident and problem management processes.
2.2.3 Main results and observations
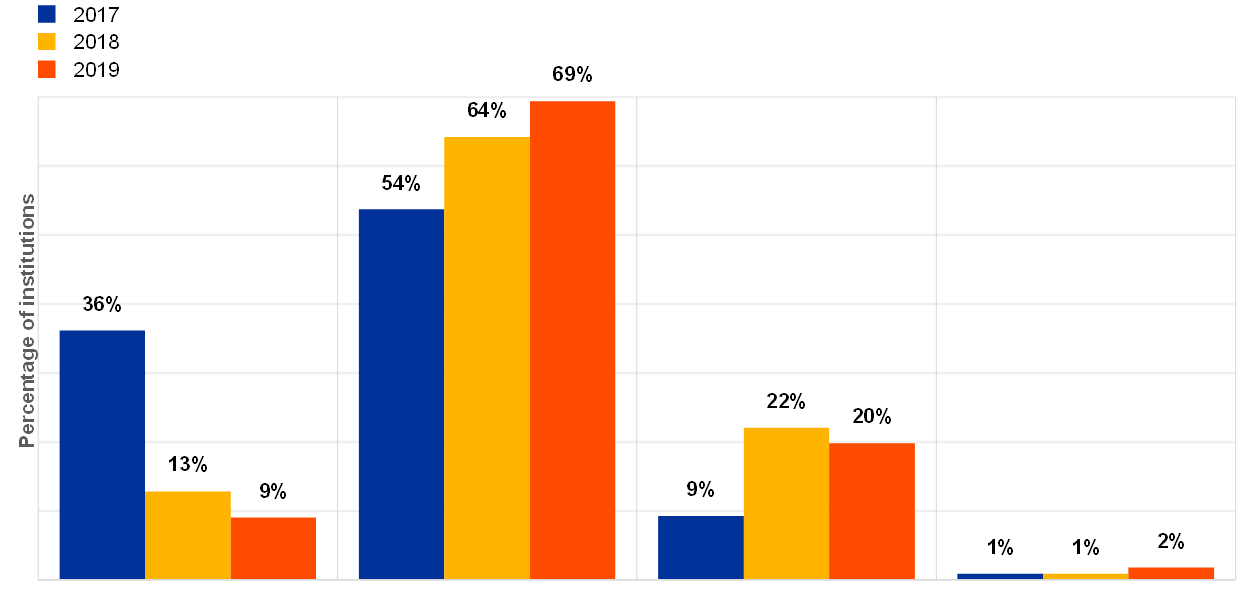
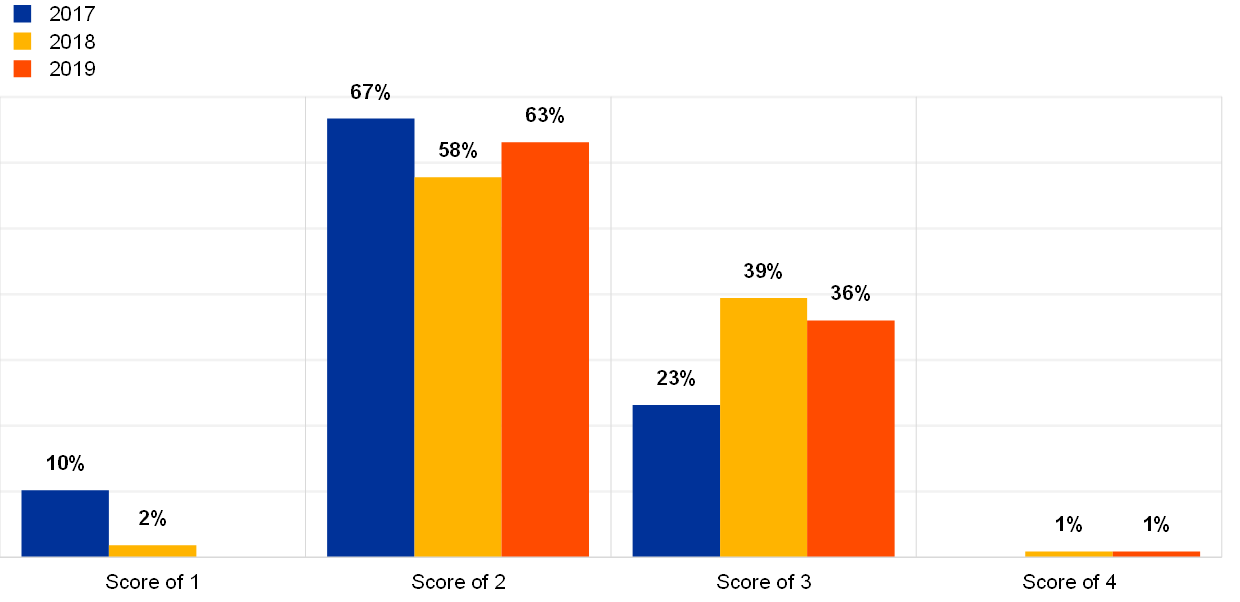
The overall IT availability and continuity risk level scores increased between 2018 and 2019, indicating either a greater awareness or presence of IT availability and continuity risks.
Chart 36
Distribution of the IT availability and continuity risk level self-assessment scores across years
The institutions provided self-assessment scores for the controls they have implemented for IT availability and continuity risk. The figures below show a mixed trend over recent years for the following topics under IT availability and continuity:
- risk analysis, assessment and treatment (see Chart 37);
- plans, processes and procedures (see Chart 38);
- technical infrastructure and solutions (see Chart 39);
- testing and continuous improvements (see Chart 40).
Chart 37
Institutions’ self-assessment scores for risk analysis, assessment and treatment in the IT risk control category “IT continuity management”
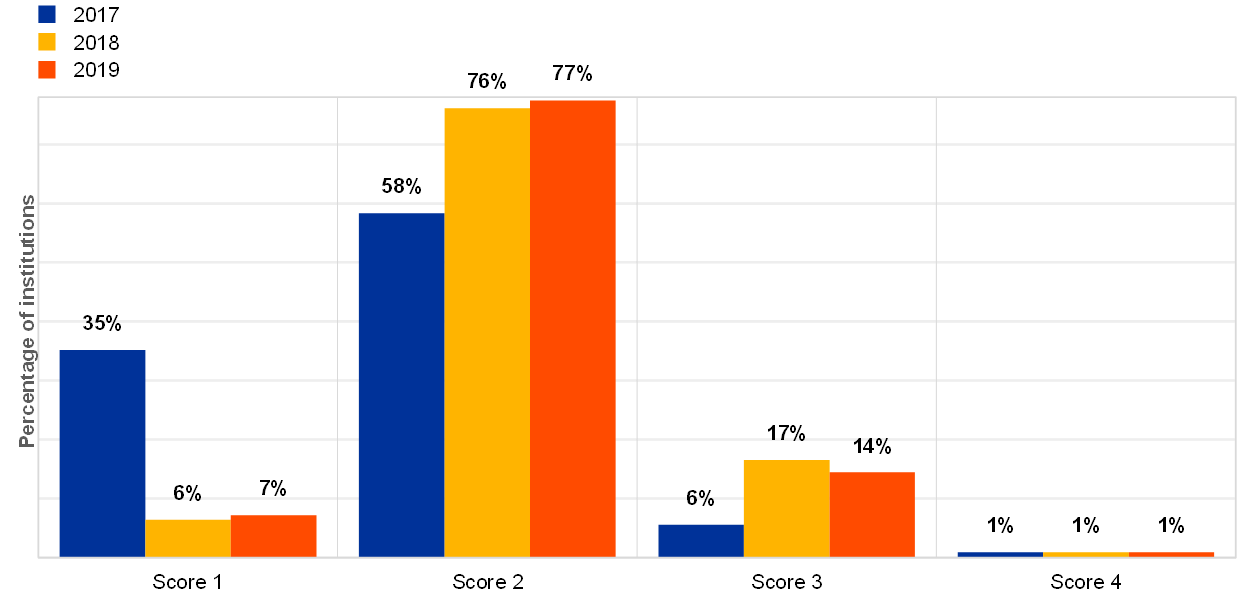
Chart 38
Institutions’ self-assessment scores for plans, processes and procedures in the IT risk control category “IT continuity management”
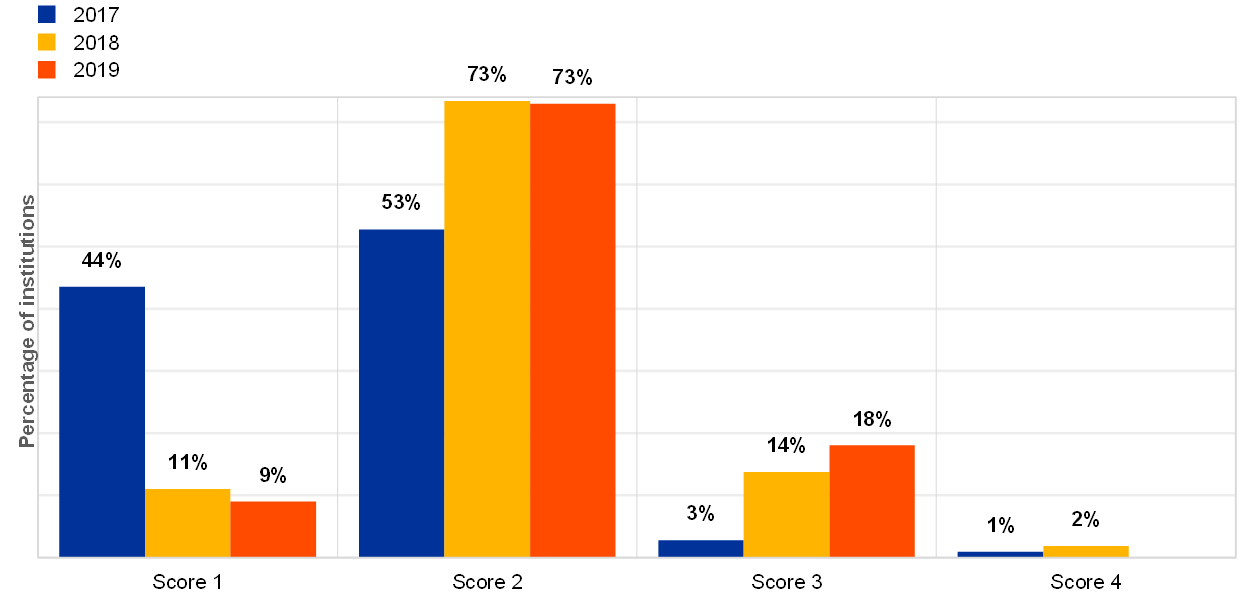
Chart 39
Institutions’ self-assessment scores for technical infrastructure and solutions in the IT risk control category “IT continuity management”
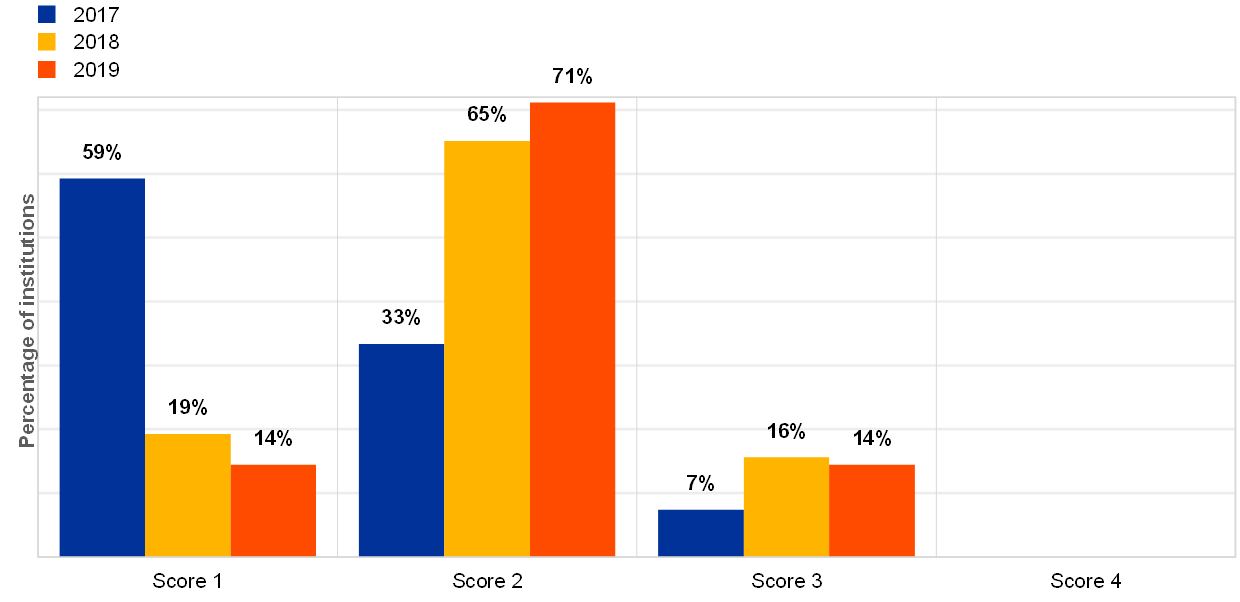
Chart 40
Institutions’ self-assessment scores for testing and continuous improvements in the IT risk control category “IT continuity management”
The total number of critical IT systems reported by the institutions went up from 33,000 (2018) to more than 38,000 (2019). The accumulated downtime due to IT disruptions with impact on customer services was significant and showed an increase of 20% compared with 2018 (18,000 hours in 2019 compared with almost 15,000 hours in 2018).
The unplanned downtime for material customer services and the unplanned downtime for critical IT systems could be a broader concern since most of the institutions are interconnected. Furthermore, 33% of the institutions provide critical services to other institutions where a disruption could potentially impact the financial sector. This high level of dependency for critical services might lead to a systemic impact in the event of major disruption.
In 2019, G-SIB banks reported the highest overall unplanned downtime of critical IT systems; however, custodians/asset managers show the highest proportion of unplanned downtime hours per critical IT system for the second consecutive year (average of 5.4 hours per critical IT system).
Chart 41
Overview of total unplanned downtime of critical IT systems in hours and total number of critical IT systems across business models (reference years 2019 and 2018; one outlier excluded)
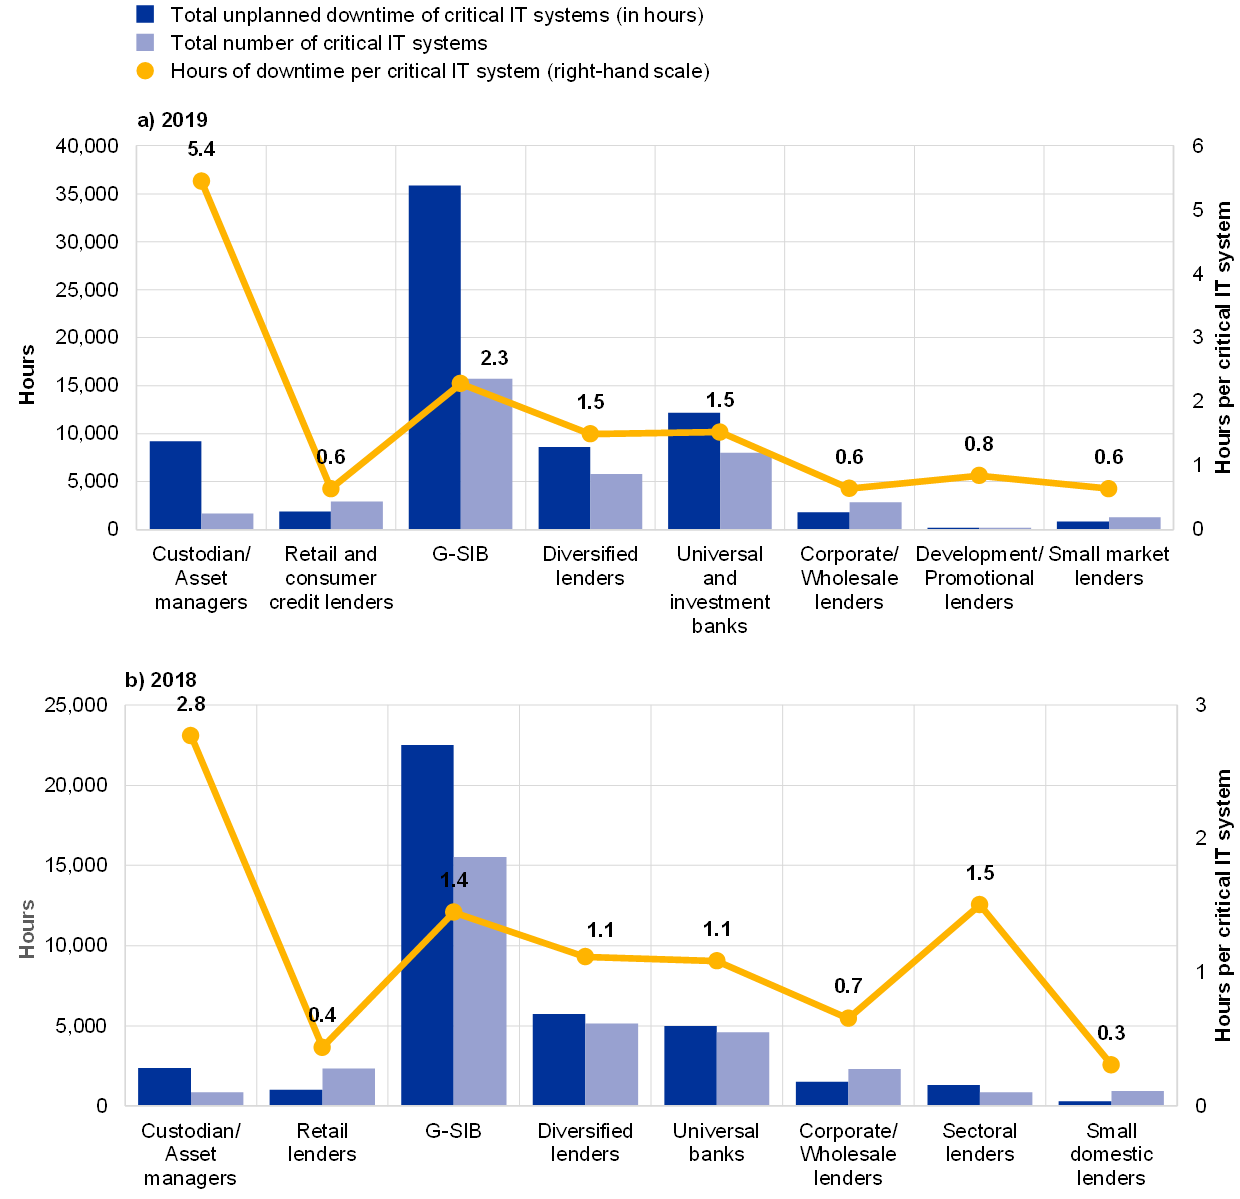
The trend of overall average unplanned downtime in hours per overall number of critical IT systems shows a significant decrease in 2019, which could be explained by the increase in critical IT systems compared with 2018.
Chart 42
Overall average unplanned downtime (in hours) in the reference year per average number of critical IT systems
The institutions reported that the main root causes of unplanned downtime of material customer services due to IT disruptions are mainly related to technical (infrastructure) changes, failing infrastructure components and IT application defects. The comments from the institutions showed that the downtime mainly impacted online banking, payment and transactions services, and ATMs. In 2019, retail lenders reported the highest total number of unplanned downtime of material customer services due to IT disruptions.
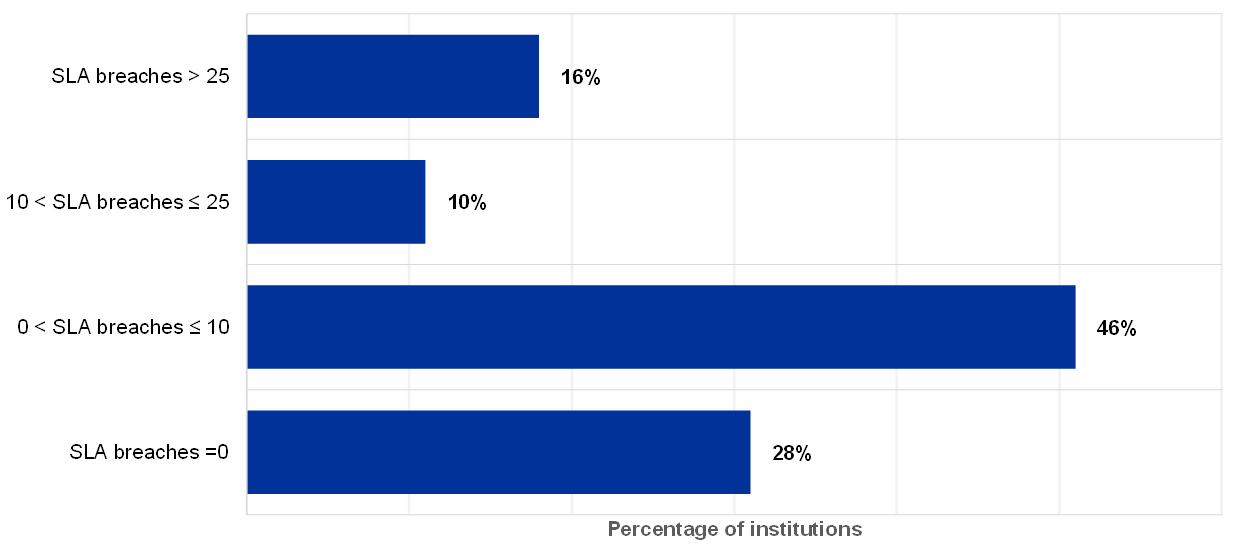
In 2019, the reported number of unplanned downtimes exceeding service level agreements (SLAs)[19] is significant. Only 28% of the institutions did not report any issues regarding the SLAs (Chart 43).
Chart 43
Percentage of institutions with SLA breaches related to unplanned downtime
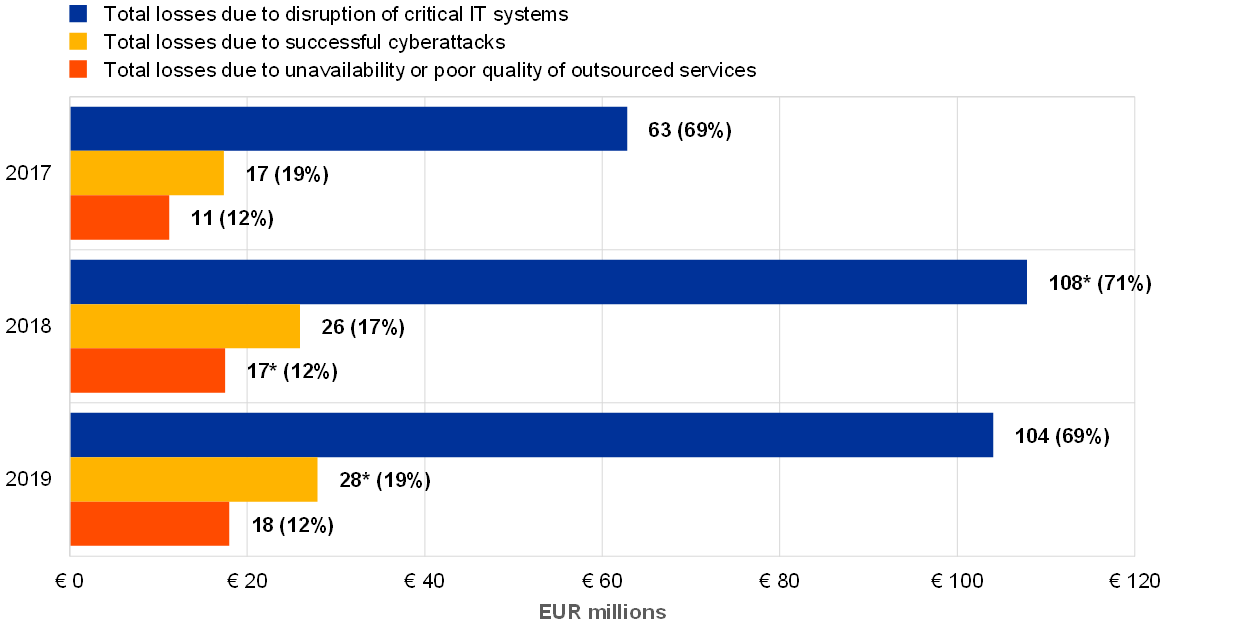
The institutions reported an overall decrease in losses due to IT disruptions compared with 2018 (Chart 44). In 2019, more than half of the losses reported by the institutions were due to disruptions in the critical IT services, followed by losses due to cyberattacks. This last category shows an increased proportion in 2019 compared with previous years. Looking at the total amount of reported losses due to cyberattacks, there is an increase of 8% compared with 2018 while the other two categories stayed broadly the same.
Chart 44
Total losses reported by institutions across years and breakdown by category (EUR millions, *one outlier institution excluded)
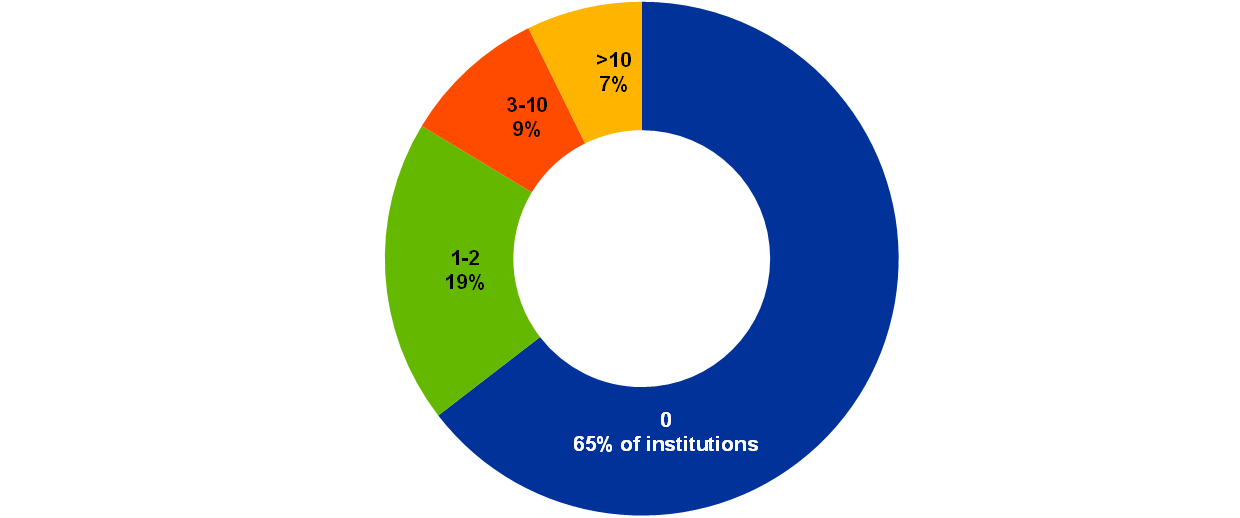
There is a downward trend in the number of institutions that have triggered their BCP or IT continuity plans at least once (see Chart 45). In 2019, 65% of the institutions did not trigger their business continuity or IT continuity plans while 7% triggered this more than ten times (see Chart 46).
Chart 45
Percentage of institutions which have triggered their BCP or IT continuity plans at least once
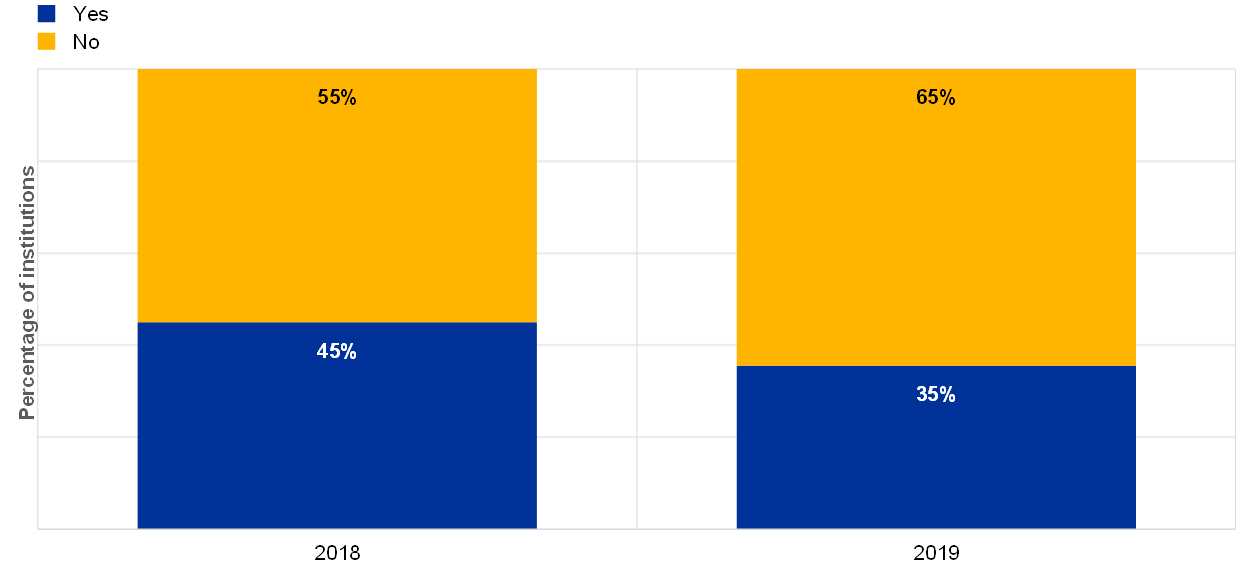
Chart 46
Percentage of institutions which triggered their IT continuity and DRPs 0, 1-2, 3-10 times and more than 10 times in 2019
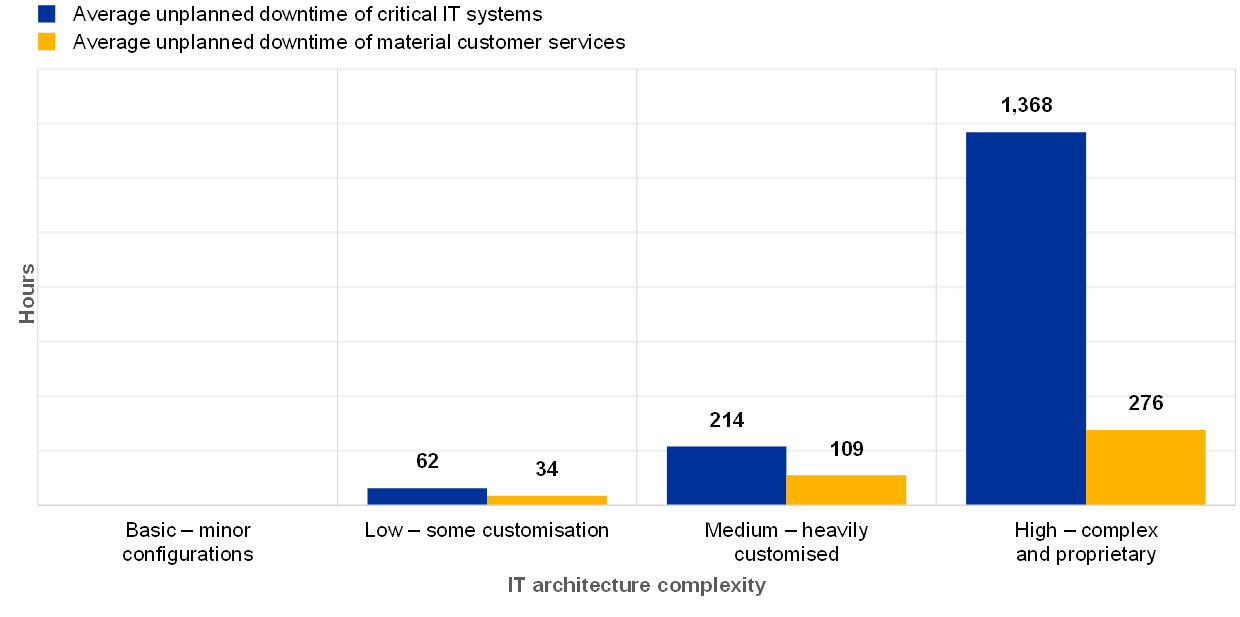
In line with the 2018 report, the institutions with complex architectures reported having the greatest average of unplanned downtime for their critical IT systems (Chart 47).
Chart 47
The average unplanned downtime per institution by IT architecture complexity (reference year 2019)
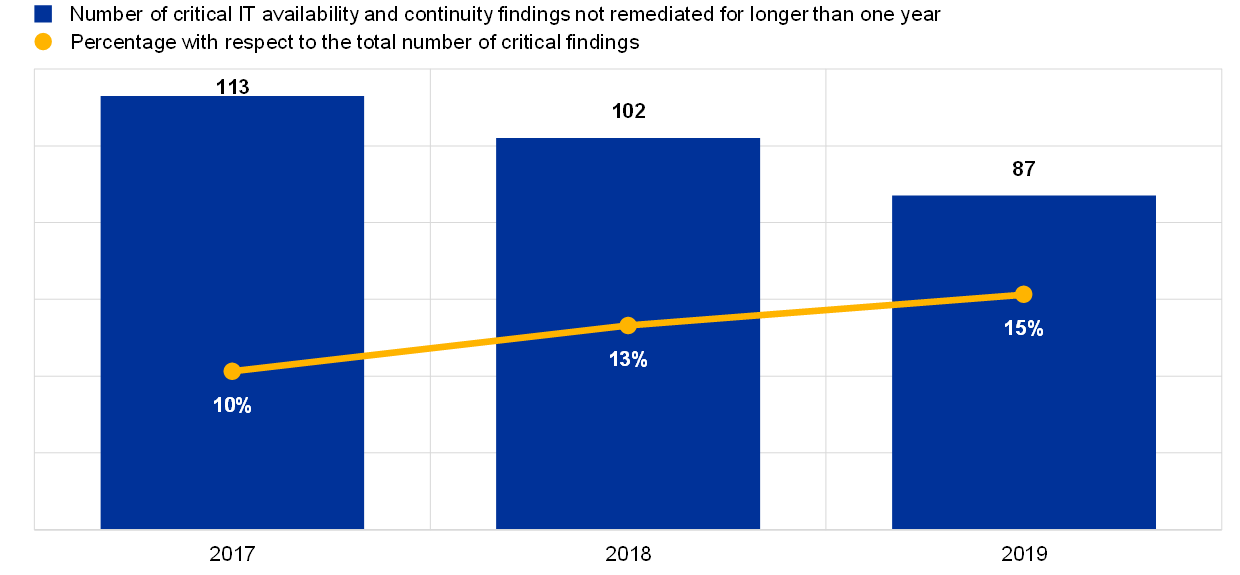
The overall number of critical IT findings that have not been remediated for longer than one year and that are related to IT availability and continuity risk shows a downward trend (Chart 48). However, the proportion of this risk category is increasing compared with the total number of not remediated findings across all risk categories.
Chart 48
Total number of critical IT findings on availability and continuity not remediated for longer than one year and as a percentage of total critical IT findings
2.3 IT change risk
2.3.1 General description
The definition of IT change risk in the ITRQ is directly derived from the EBA Guidelines (EBA/GL/2017/05): “the risk arising from the inability of the institution to manage ICT system changes in a timely and controlled manner, in particular for large and complex change programmes […]”[20].
In practice, IT change risk often refers to the complexity of the IT architecture which is not sufficiently aligned with the needs of the business and which falls short of actual risk management requirements. It also refers to the uncontrolled release of software/IT systems/hardware (new versions or patches) within the production environment, the inadequacy of IT solutions lifecycles for properly designing, building and maintaining IT systems (software, hardware or data), and inadequate patch management (of business software and IT systems) which leads to potential outdated or vulnerable IT systems.
The institutions’ IT environments may have a direct impact on their IT change risk level. In particular, major organisational changes, such as mergers, acquisitions and carve-outs, which lead to a merging or splitting of the IT landscape, as well as the number of critical projects with significant IT undertakings, have a large impact on the risk level.
2.3.2 Methodology
Within the ITRQ, the overall assessment of risk levels for IT change risk is based on the frequency of changes to critical IT systems (from low to high frequency). Five indicators were used for the assessment: the complexity of the IT architecture, the number of critical IT environments[21], the number of changes in critical IT environments, the number of changes that have caused issues in the production environment and the number of findings related to IT change risk that have not been remediated for more than one year.
The effectiveness of the risk control framework for identifying, understanding, measuring and mitigating IT change risk was self-assessed through two sets of questions relating to the following points.
- Change and release management, which refers to processes aimed at implementing, deploying or migrating changes into a production environment. These may be software deployments that result from IT projects and that are developed or acquired via the IT solutions lifecycle, or the implementation in a production environment of any IT components which are part of the IT systems, such as hardware, technical software, IT security component rules, configuration parameters, patches, bug fixes, etc.
- The project management framework, governance and IT solutions lifecycle, including in software acquisition, software development and project management, referring to overall processes such as the design and maintenance of IT solutions, including the alignment of IT projects with the institution’s strategy.
ECB Banking Supervision focuses on critical systems, which means IT systems and services that fulfil at least one of the conditions below.
- They support the core business operations and distribution channels (e.g. automated teller machines (ATMs), internet and mobile banking, stock market trading).
- They support essential governance processes and corporate functions, including risk management and treasury management systems.
- They fall under special legal or regulatory obligations (if any) that impose heightened availability, resilience, confidentiality or security requirements. These can include data protection measures, a maximum period of unavailability and maximum data loss.
- They process or store sensitive data (e.g. customer data) unauthorised access to which could significantly impact the institution’s soundness and continuity of business, reputation or financial results.
- They provide baseline functionalities that are vital for the adequate functioning of the institutions (e.g. telecom and connectivity services, IT and cyber security services, identity and access management services, Active Directory, etc.).
2.3.3 Main results and observations
The analysis was performed based on the number of IT systems and number of IT changes reported in the ITRQ by the institutions. Between 2018 and 2019, the institutions’ self-assessment scores for the overall risk level remained stable.
Chart 49
Distribution of the IT change risk level self-assessment scores across years
The institutions provided self-assessment scores for the controls they had implemented for the IT change risk. The figures below show a slight improvement compared with the previous years for the aspects of IT change:
- change and release management (see Chart 50);
- project management framework and governance (see Chart 51);
- IT solutions lifecycle (see Chart 52).
Chart 50
Institutions’ self-assessment scores for the IT risk control category “change and release management”
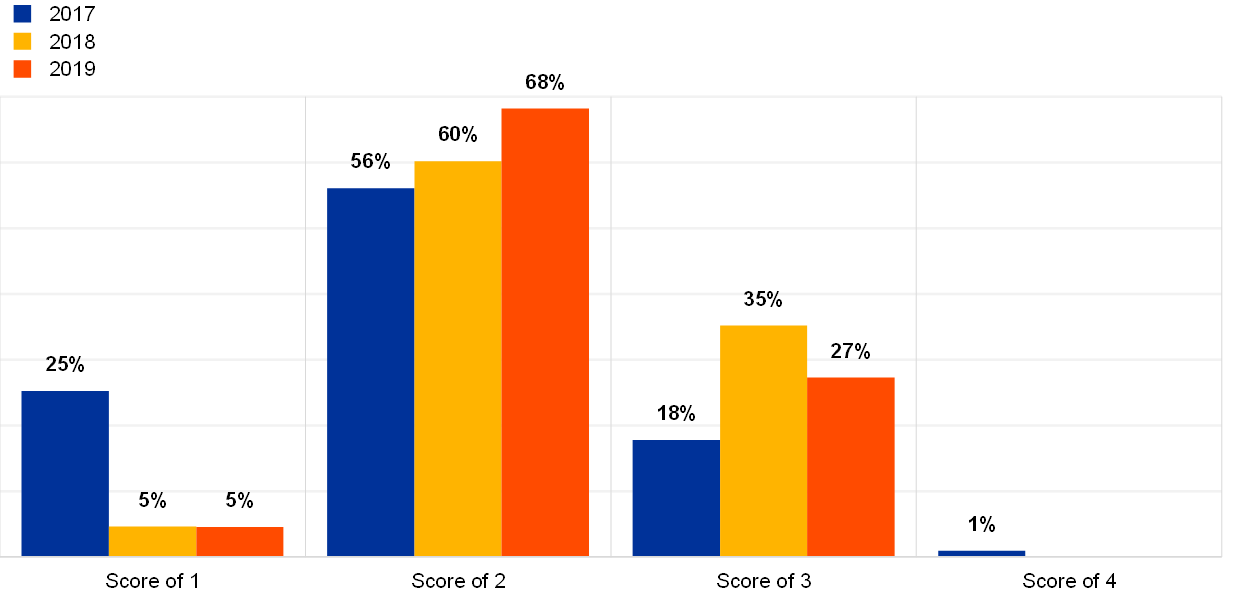
Chart 51
Institutions’ self-assessment scores for the IT risk control category “project management framework and governance”
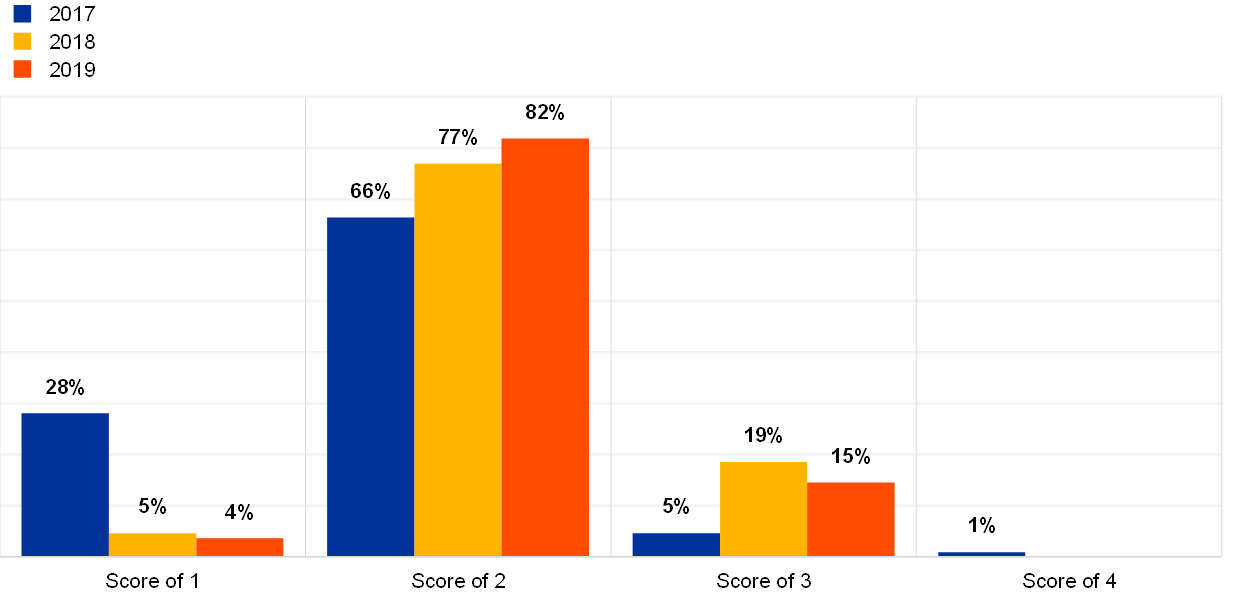
Chart 52
Institutions’ self-assessment scores for the IT risk control category “IT solutions lifecycle”
The institutions’ responses show that within the following sub-categories attention is needed since some of the institutions do not have the appropriate controls in place:
- a release management team is in place;
- changes to IT security controls are authorised by relevant information/IT security managers after having analysed the IT security impact;
- an asset inventory is maintained and updated.
Chart 53
Percentage of institutions with change and release management controls in place (reference year 2019)
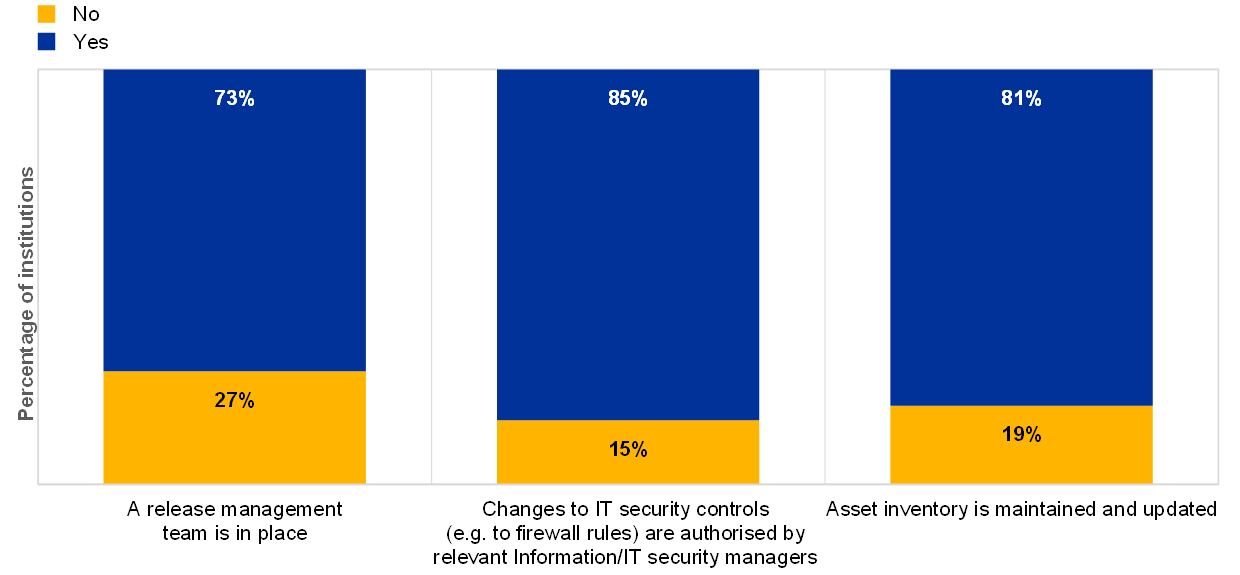
Overall, 19% of the institutions reported not maintaining an up-to-date inventory of all IT assets/configuration items (software and hardware including outsourced assets). The lack of a reliable asset inventory, especially for critical assets, may hamper proper change risk assessments, business impact analyses and controlled implementations of changes.
Changes are needed for software and hardware, e.g. maintenance, security patches, updates, etc. The institutions reported that change management is in place but there were changes that led to issues within the IT production environments. Although the number has decreased substantially, as shown[22] in Chart 54, this illustrates the need for continuous attention to be paid to this topic to avoid disruption of the critical IT systems.
Chart 54
Total IT changes in critical environments and changes that led to issues over a three-year period (the number of changes that led to issues is not available for 2017)
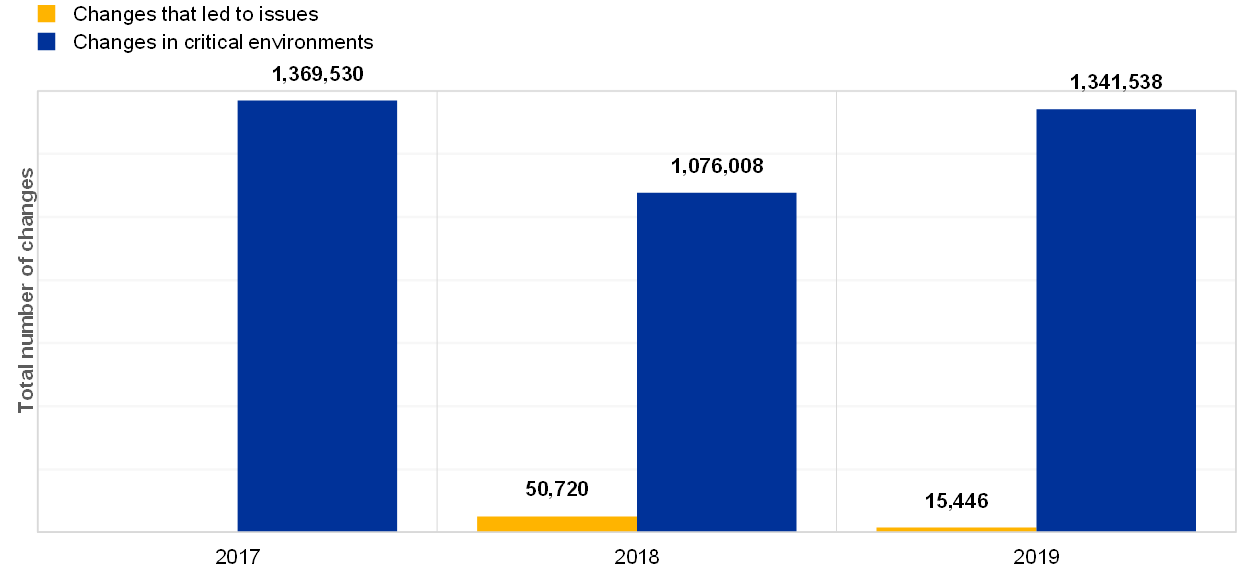
Chart 55
Total number of changes to critical IT systems across business models (reference year 2019)
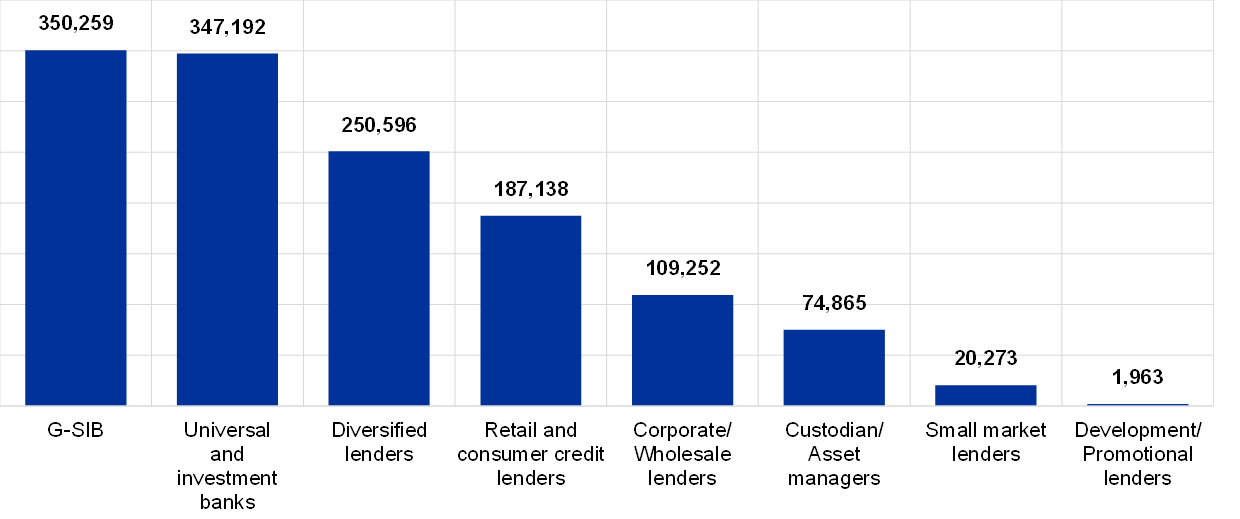
Chart 56
Total number of changes that led to issues across business models (reference year 2019)
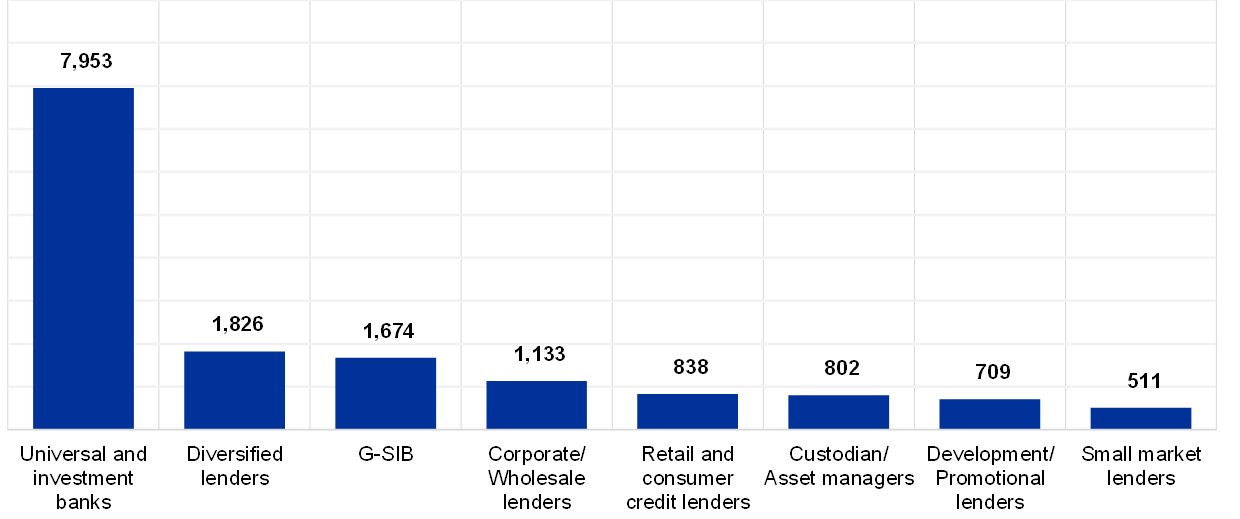
Chart 57
Distribution of number of changes in critical IT environments and changes that led to issues across business models (reference year 2019)
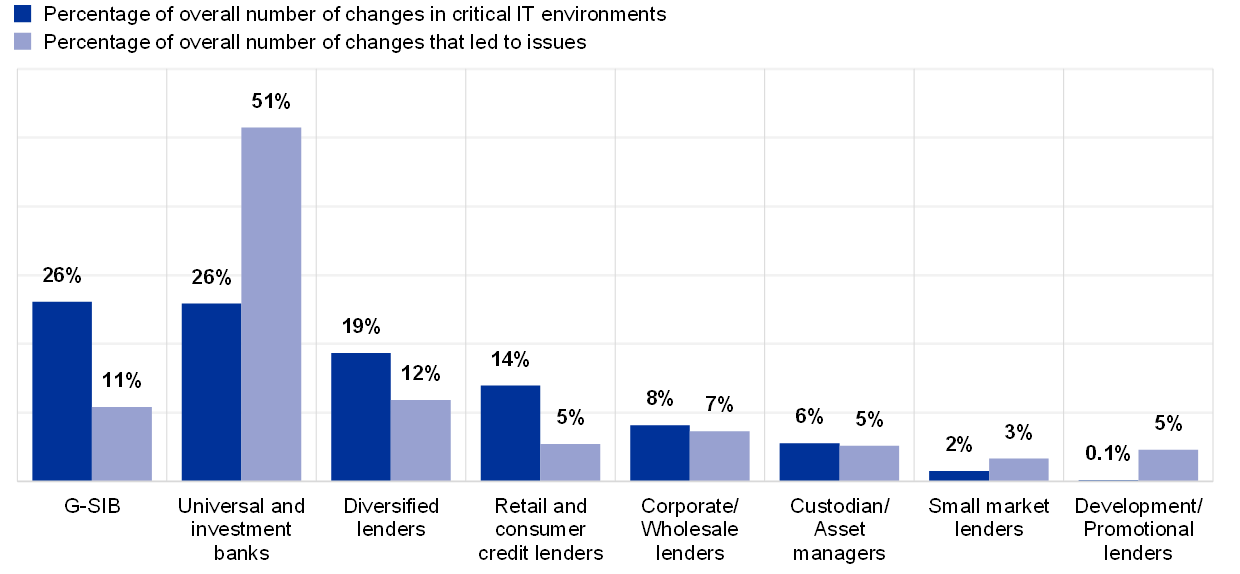
Chart 58
Number of changes to critical IT environments per institution (y-axis: logarithmic; reference year 2019)
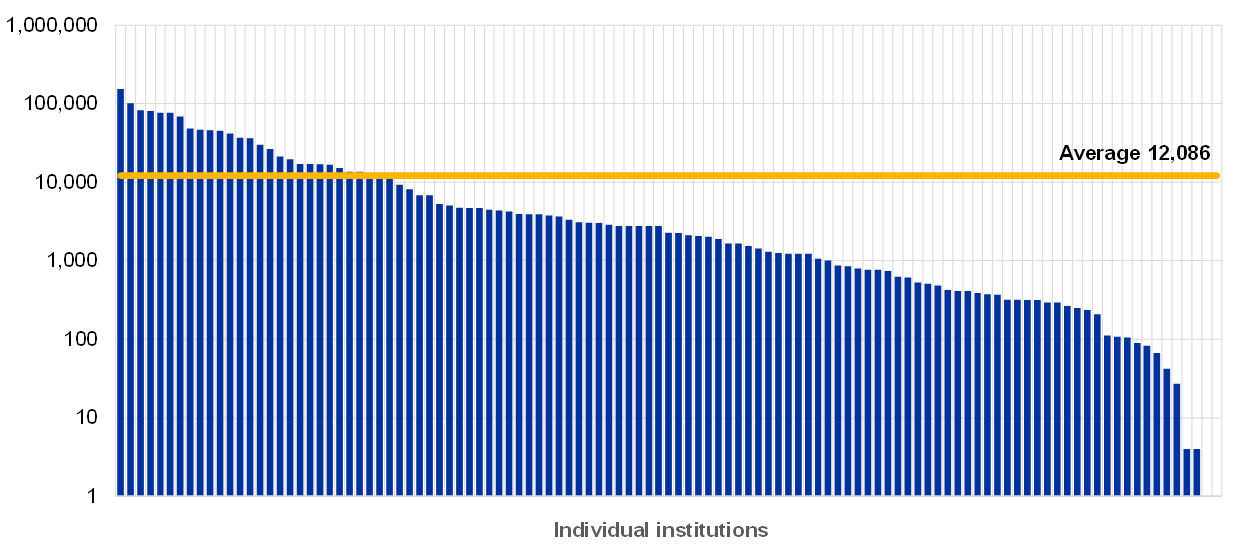
Chart 59
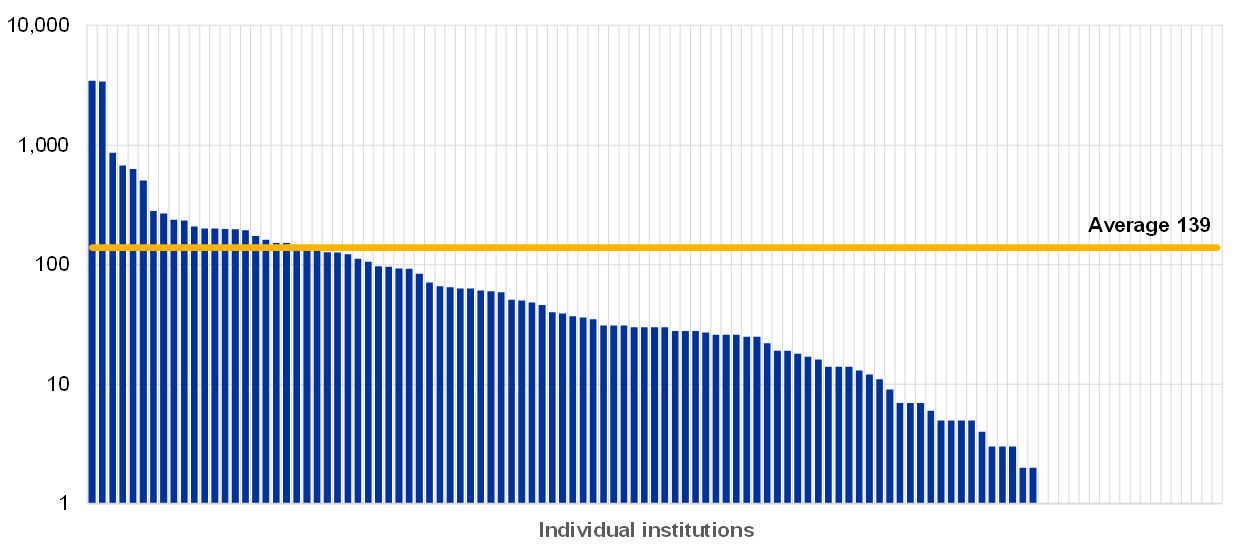
Number of changes that led to issues in the production environment per institution (y-axis: logarithmic; reference year 2019)
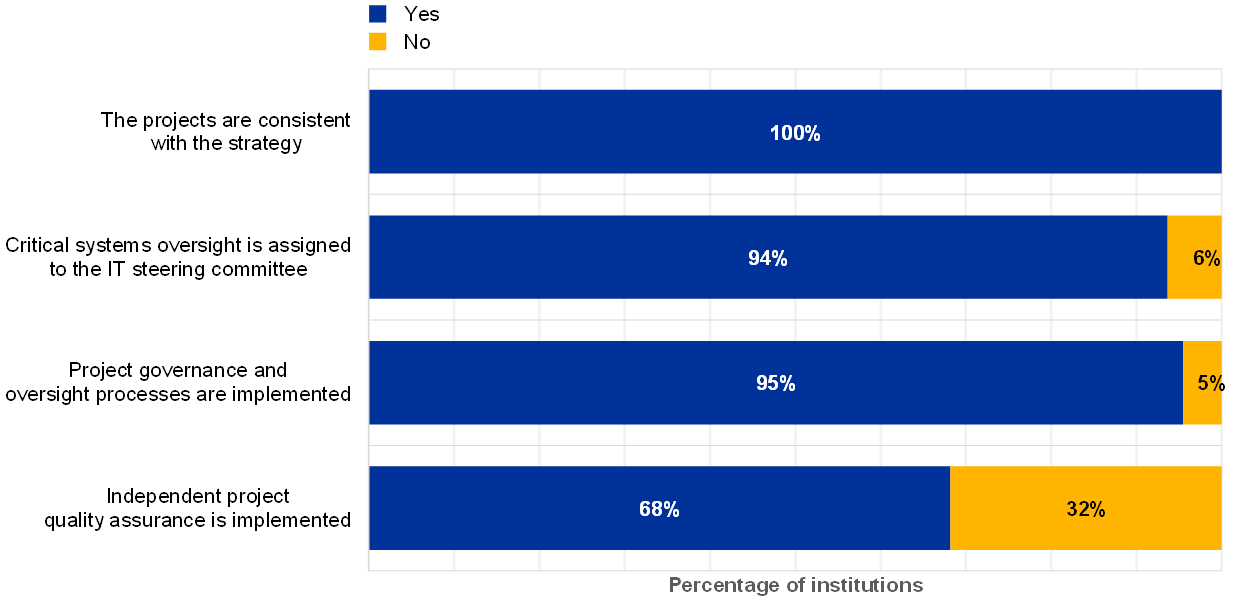
The majority of institutions reported that the risk controls of their project management framework and governance are effective and consistent across their organisation and considered related risks to be mitigated. However, based on the responses one-third of the institutions have not implemented independent quality assurance supporting the implementation of critical projects[23] (Chart 60).
Chart 60
Institutions’ answers regarding the risk controls implemented for project management (reference year 2019)
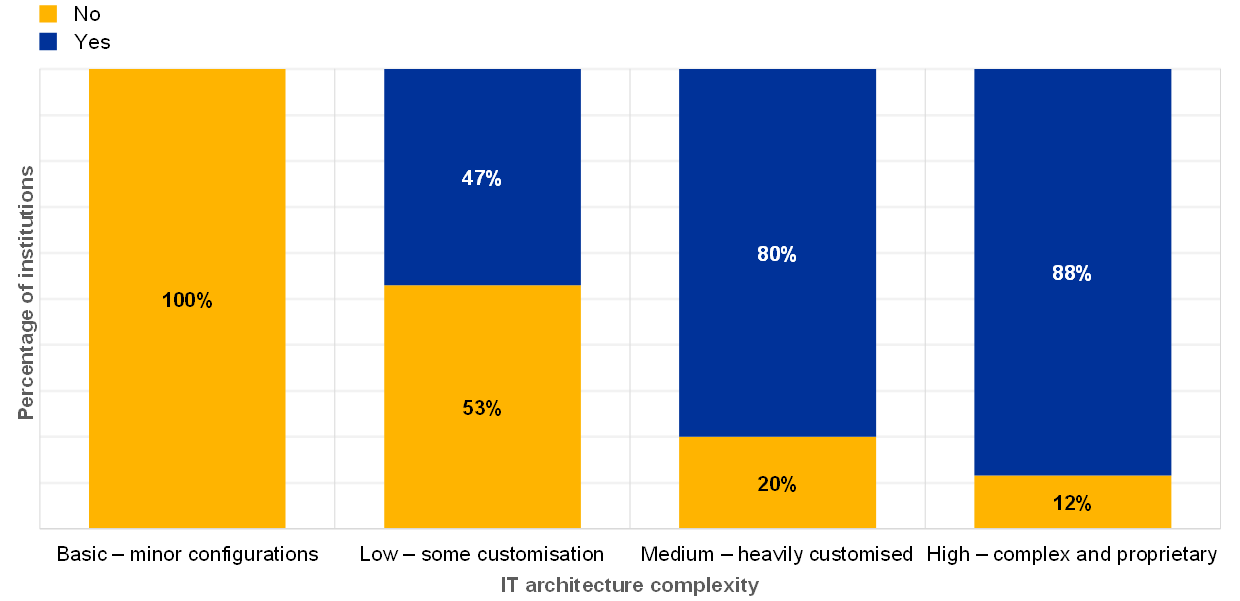
Around 78% of the institutions reported that they rely on EOL systems for critical processes, which is the same as in previous years (see Chart 31). Change management for the EOL systems is a concern since the suppliers no longer maintain these solutions (no bug correction and emergency fixes for newly identified vulnerabilities, possible incompatibility with updated system components, etc.). The reported answers of the institutions show that 88% of the institutions with a complex architecture rely on at least one EOL system for business-critical processes (Chart 61).
Chart 61
Percentage of institutions that rely on EOL systems by IT architecture complexity (reference year 2019)
2.4 IT outsourcing risk
2.4.1 General description
IT outsourcing risk is defined, according to the EBA Guidelines (EBA/GL/2017/05), as: “the risk that engaging a third party, or another Group entity (intragroup outsourcing), to provide ICT systems or related services adversely impacts the institution’s performance and risk management […]”[24].
This includes the risk of non-availability of critical outsourced IT services, loss or corruption of sensitive data entrusted to the service provider, and major degradation/failure of the outsourced services. In addition, ineffective outsourcing governance could result in a lack of appropriate skills and capabilities to fully identify, assess, mitigate and monitor the IT risks and could therefore limit an institution’s operational capabilities. Another important aspect in IT outsourcing is the IT security of the service provider’s IT systems, with a possible direct impact on the outsourced services or critical/confidential data handled by the service provider.
2.4.2 Methodology
The outcome of the ITRQ provides insights into the IT outsourcing risk levels and risk control maturity, and collects general data about IT outsourcing, such as the reference year expenses for external, intragroup outsourcing and cloud services, as well as an IT outsourcing budget forecast.
The self-assessment for IT outsourcing risk levels focuses on assessing the relevance of outsourced IT services for critical activities in IT operations, IT development and IT security. This includes reliance on intragroup and extra-group service providers, based on the total value of all outsourced IT services, and the total amount of monetary losses caused by the unavailability or poor quality of outsourced services. Furthermore, the self-assessment gathers data about main categories of IT outsourcing (intragroup and extra-group), the number of (IT) outsourcing contracts (intragroup and extra-group) and the number of critical findings related to IT outsourcing risks that have not been addressed for more than one year. Finally, several questions are dedicated to the usage of cloud computing and the number of critical services provided by cloud service providers.
The effectiveness of outsourcing risk controls is assessed by analysing indicators that consider
- the existence of a comprehensive risk framework and outsourcing policies;
- the existence of outsourcing risk assessments as well as the definition of individual contingency plans and exit strategies;
- information provided to and decisions made by the management body and senior management;
- requirements for contractual agreements with the service provider, including supervisors’ right to access and to audit the complete outsourced chain;
- design of monitoring processes, including bank personnel and technical resources;
- maintenance of an outsourcing register.
IT outsourcing is an area of specific focus because it often represents a major part of an institution’s overall outsourced activities. IT outsourcing requires effective measures to be implemented by the institutions in order to manage related risks. Outsourcing activities does not mean outsourcing the institution’s responsibilities. It is important that institutions ensure continuous compliance with all regulatory requirements via their providers as outlined in the EBA Guidelines on outsourcing arrangements[25].
Additionally, a defined process is required comprising the identification, assessment and monitoring of possible concentration risk related to third-party providers that deliver services to the institution in line with paragraph 46 of EBA/GL/2019/02.
2.4.3 Main results and observations
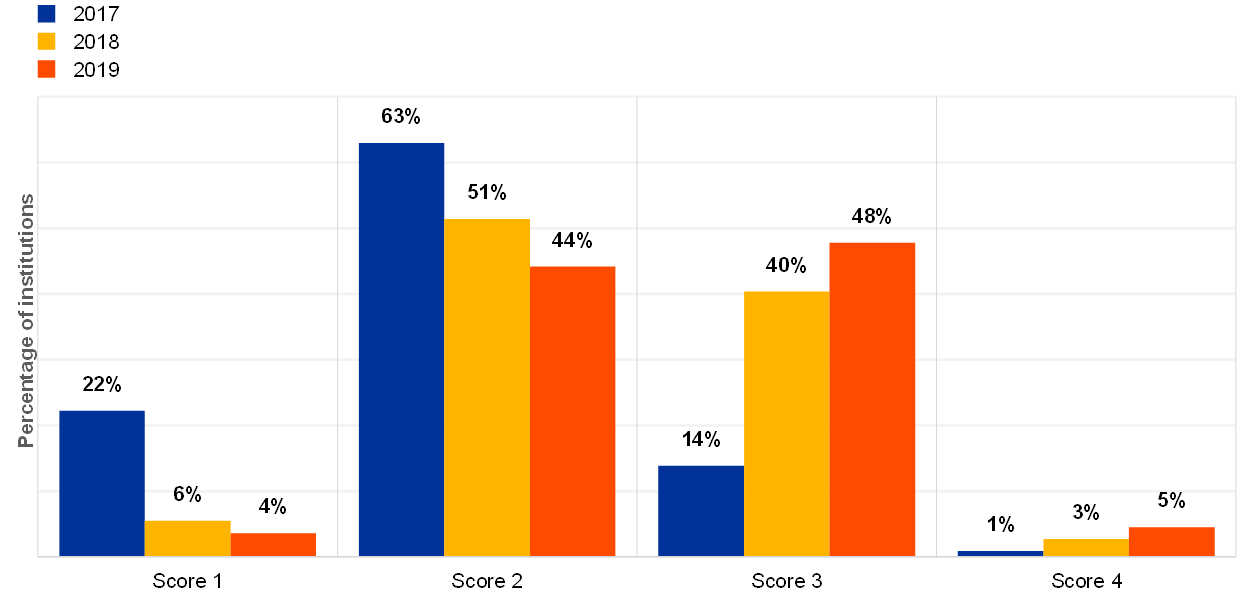
The institutions seem to be more aware of the risk related to IT outsourcing, which is shown by an increase in the highest score (4) compared with 2018.
Chart 62
Distribution of the IT outsourcing risk level self-assessment scores across years
The institutions provided self-assessment scores for the controls they have implemented for the IT outsourcing risk. The figure below shows a deterioration compared with the previous years for IT outsourcing aspects.
Chart 63
Distribution of the IT outsourcing maturity risk control self-assessment scores across years
IT outsourcing continues to be a key pillar for institutions as 98% of them outsource (at least some) critical IT activities, while more than 10% have fully outsourced critical activities in IT operations, IT development and IT security. Inadequate outsourcing management increases the risk of disruption of these critical activities. The importance of outsourcing is also reflected in the associated budget, which continues to increase.
Chart 64
Use of outsourcing by institutions (reference year 2019)
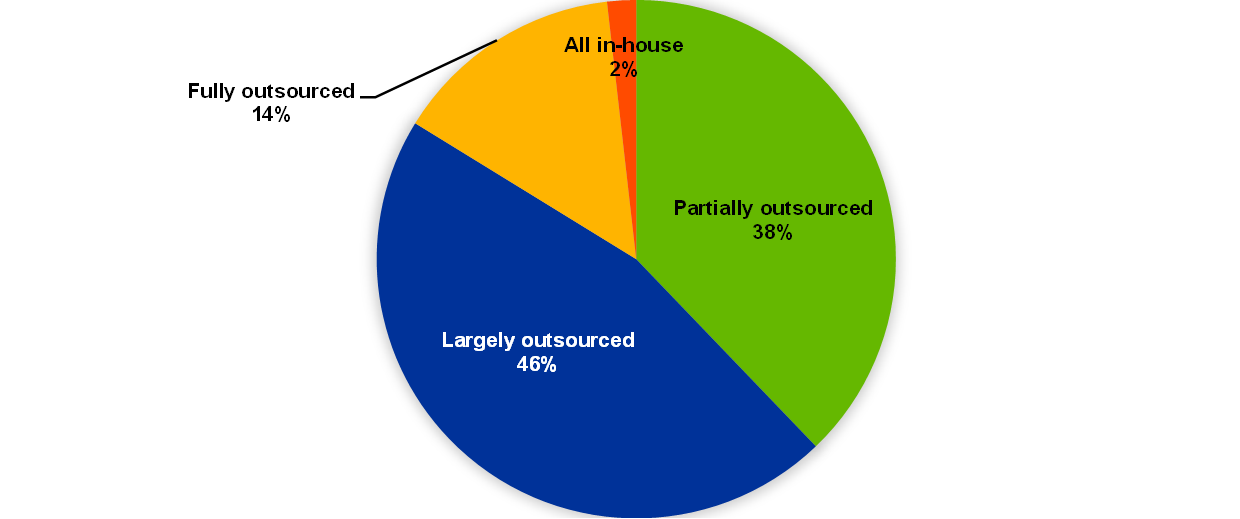
Chart 65
Total IT outsourcing expenses by category over the last three years (the amount for cloud expenses is not available for 2017)
The majority of the institutions (85%) reported that they are using some form of cloud service for their operations; this is reflected in a budget that has nearly doubled.
Chart 66
Percentage of institutions using any form of cloud computing service (reference 2019)
Outsourcing services are provided either by external companies or by internal group entities. The split between intragroup and extra-group seems to be stable. The ECB analysis shows that full outsourcing of all IT activities is mainly done within the parent group.
Chart 67
Percentage of intragroup outsourcing for institutions that declared fully outsourced IT services for critical activities
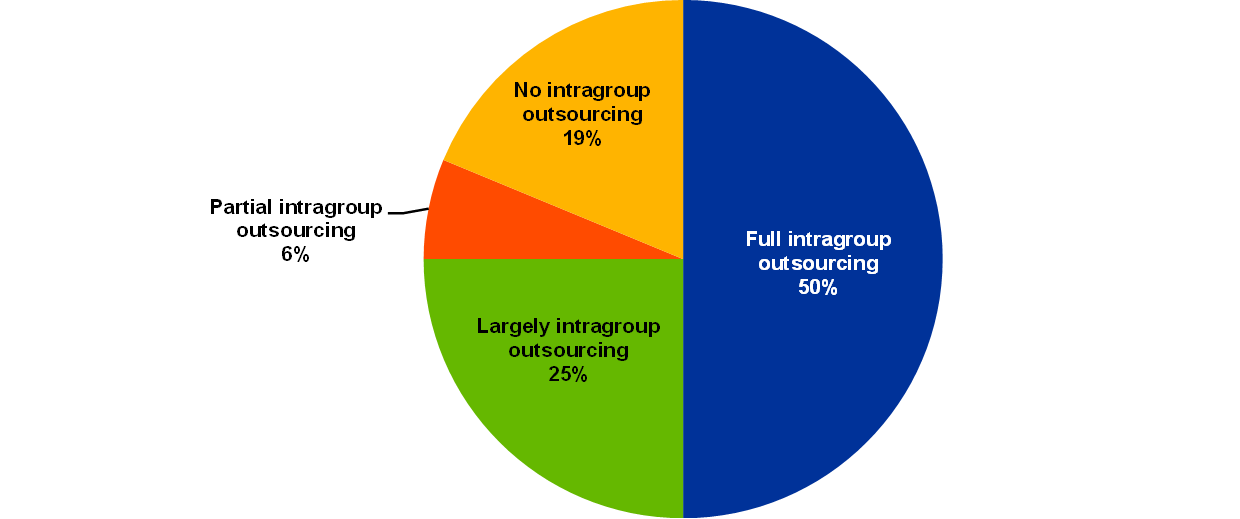
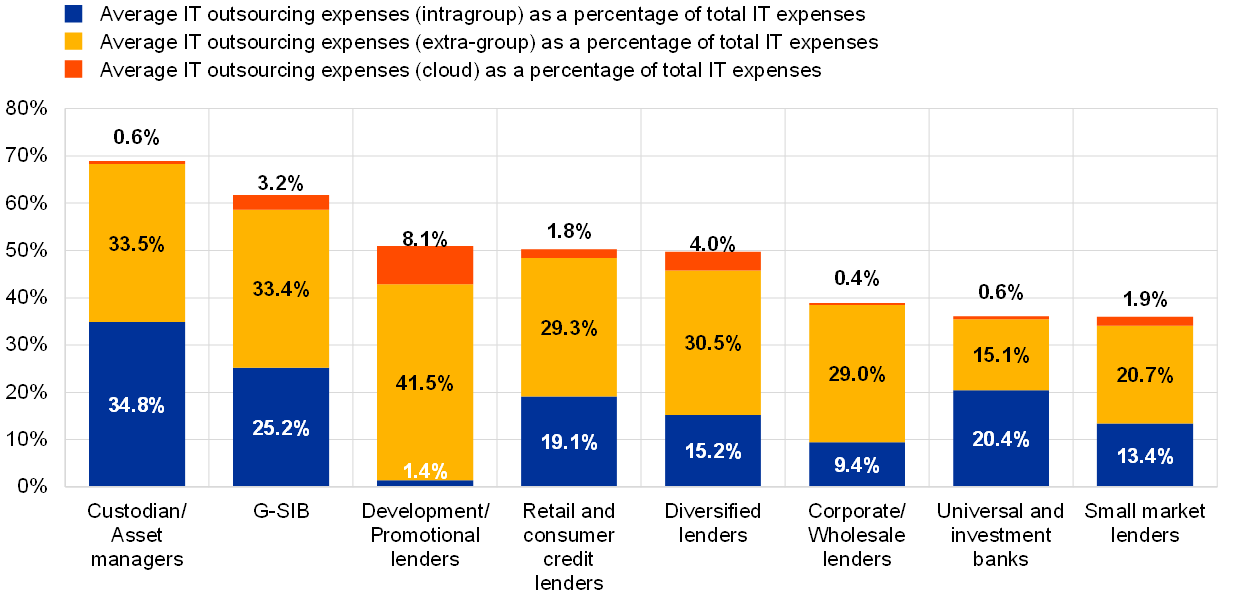
Chart 68
IT outsourcing expenses as a percentage of total IT expenses across business models (reference year 2019)
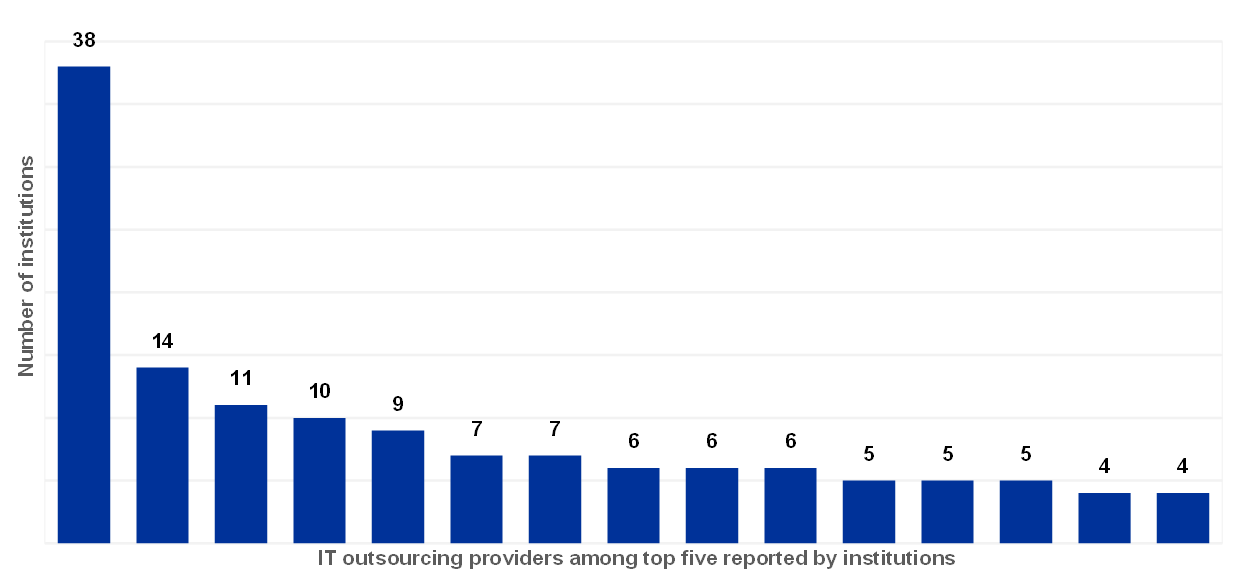
IT outsourcing covers a broad spectrum of services, ranging from IT infrastructure to application development. The institutions were asked to list their five most important IT service providers. The ECB analysis shows that the most frequently mentioned IT service provider delivers services to at least 30% of the institutions (Chart 69). The service providers shown in the top 15 below might also deliver services to more institutions but are not within their top five.
Chart 69
Overview of the IT outsourcing providers most frequently mentioned by the institutions (reference year 2019; excluding providers used by three institutions or fewer)
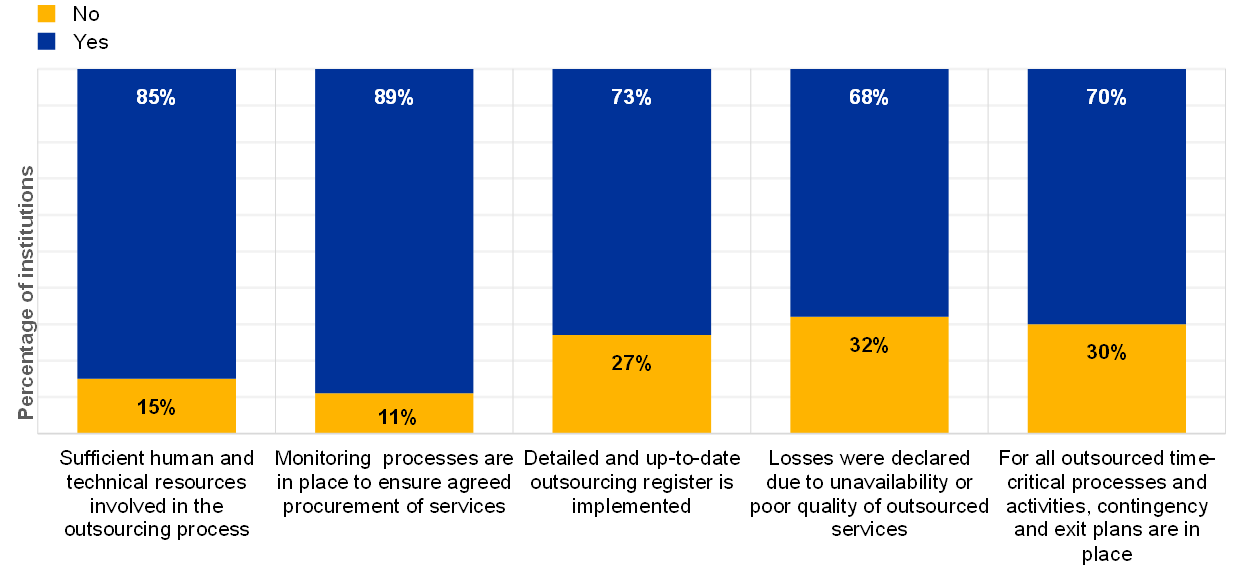
Despite the increasing relevance of IT outsourcing, several institutions reported a lack of adequate processes to control their outsourced services and providers (Chart 70):
- 15% of the institutions reported having insufficient human and technical resources involved in the outsourcing process, which is a slight increase with respect to the previous year (13% in 2018);
- 11% of the institutions reported having no monitoring processes in place to ensure that the level of services procured complies with contractual agreements, which is a slight increase (9% in 2018);
- 27% of the institutions reported that they have not yet fully implemented an outsourcing register as mentioned in the EBA Guidelines on outsourcing[26];
- 32% of the institutions reported losses due to unavailability or poor quality of outsourced services, which is about the same as in 2018 (33%);
- 30% of the institutions reported that they do not have contingency and exit plans in place for their outsourced time-critical processes and activities[27].
Chart 70
Percentage of institutions declaring that they have IT outsourcing risk controls in place (reference year 2019)
2.5 IT data integrity risk
2.5.1 General description
The EBA Guidelines (EBA/GL/2017/05) identified IT data integrity risk as a material IT risk to be subject to a close review by competent authorities. IT data integrity risk is the risk that data stored and processed by IT systems are incomplete, inaccurate or inconsistent across different systems. This could be, for example, a result of weak or absent IT controls during the different phases of the IT data lifecycle (e.g. designing the data architecture, building data models and/or data dictionaries, verifying data inputs and controlling data extractions, transfers and processing, including rendered data outputs). Such weakness could prevent an institution from providing services and from producing risk management and financial information in a correct and timely manner[28].
2.5.2 Methodology
The institutions were asked to assess their risk levels for IT data integrity based on four indicators:
- the number of end-user computing (EUC) solutions that support critical activities;
- the number of invalid data modification incidents in critical IT systems;
- the number of findings related to IT data integrity which have not been remediated for more than one year;
- known cases of incorrect data submission in their supervisory reporting due to IT issues.
EUC (also called EUDA, standing for end-user developed application) refers to IT services developed and managed by the business functions’ end-users outside the IT organisation (e.g. often the use of MS Excel or MS Access to consolidate accounting data for reporting purposes). These EUC services often lack proper quality assurance, backup and testing, which can lead to inaccurate data quality. In addition, as soon as patterns of incorrectly submitted data occur in an institution’s supervisory reporting, or if a number of invalid data modification incidents and findings have not been addressed for more than one year, a higher level of IT data integrity risk could be indicated.
The effectiveness of the risk control framework for identifying, understanding, measuring and mitigating IT data integrity risk is self-assessed in two areas: data quality management and data architecture models.
Data quality management refers to processes for defining roles and responsibilities for managing the integrity of the data in IT systems (e.g. data architects, data officers, data custodians and data owners/stewards) in order to provide guidance on which data are critical from an integrity perspective. Data quality management should be subject to specific IT controls (e.g. automated input validation controls, data transfer controls and reconciliations) in the different phases of the IT data lifecycle, in order to identify and resolve IT data integrity issues, and also to properly manage EUC solutions[29]. The term “data architecture models” refers to the management of data models, flows and dictionaries in order to support data consistency and integrity across IT systems. Moreover, this closely relates to expectations published by ECB Banking Supervision in the letter of June 2019[30] and with the Basel Committee on Banking Supervision principles on the same subject (BCBS 239)[31].
2.5.3 Main results and observations
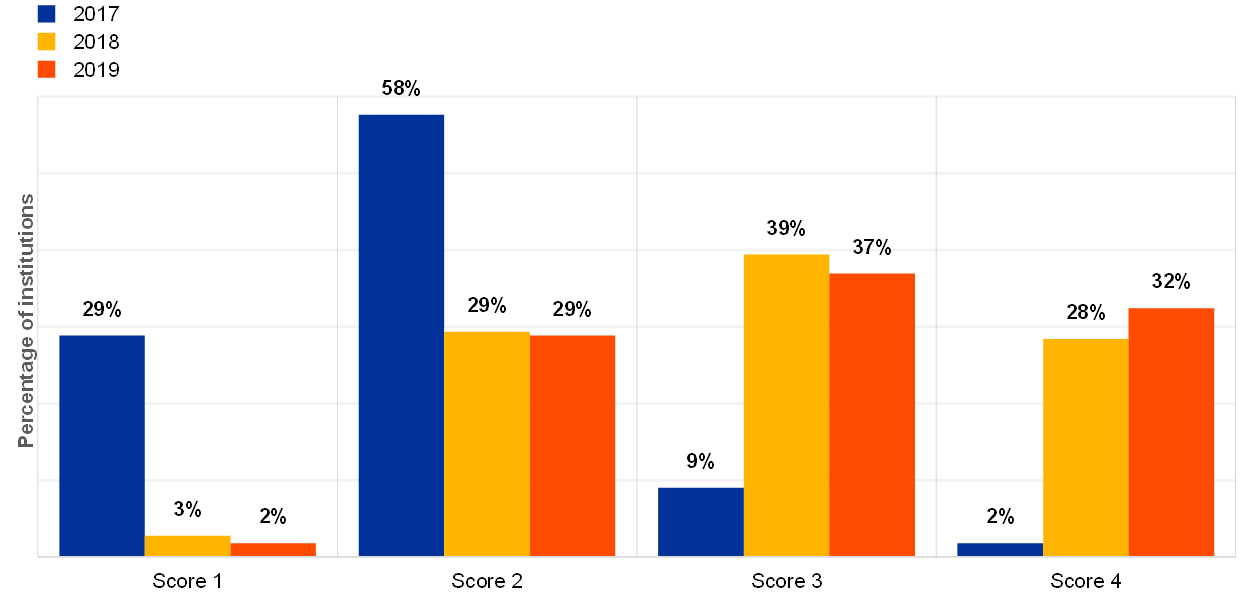
The IT risk level reported by the institutions shows a steady increase compared with 2018.
Chart 71
Distribution of the IT data integrity risk level self-assessment scores across years
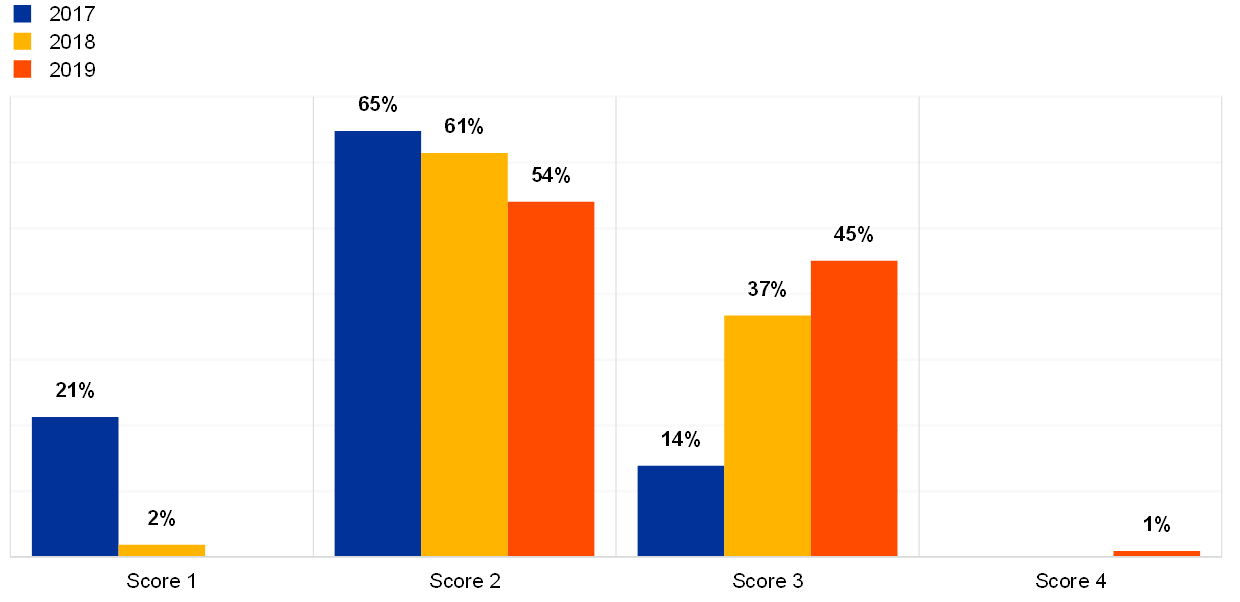
The institutions provided self-assessment scores for the controls they have implemented for the IT data integrity risk. The figures below show a positive trend compared with the previous years for IT data integrity aspects:
- data quality management (see Chart 72);
- data architecture model (see Chart 73).
Chart 72
Institutions’ self-assessment scores for the IT risk control category “data quality management”
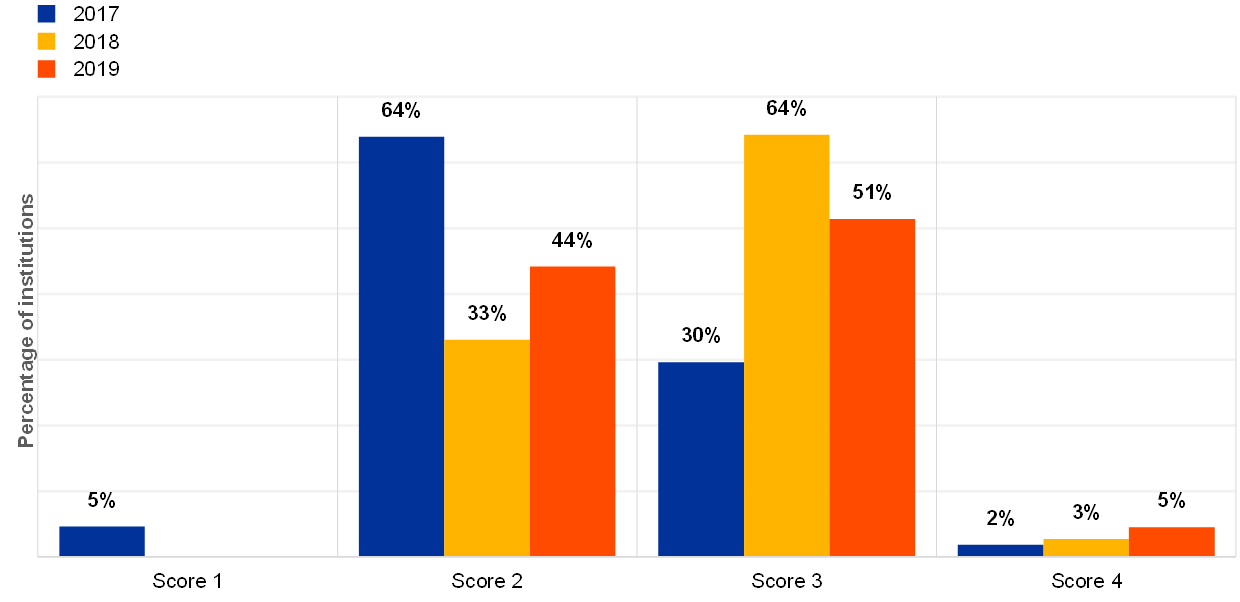
Chart 73
Institutions’ self-assessment scores for the IT risk control category “data architecture model”
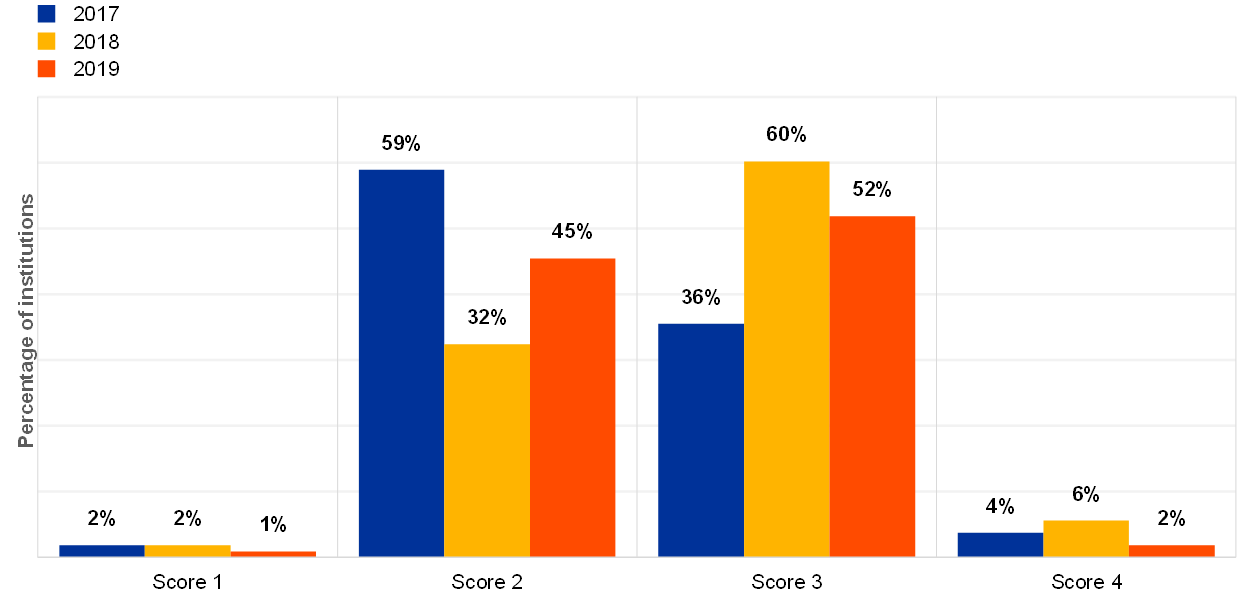
Data quality management is one of the cornerstones of data integrity. However, it is the domain which is the least mature compared with the other risk controls, according to the institutions’ self-assessment (see Chart 74). The trend shows that around 29% of the institutions have not implemented data quality management controls, or do not cover all business areas/entities within these institutions. In the institutions’ qualitative feedback, several reported lacking the human resources to implement these controls correctly.
Chart 74
Percentage of controls not implemented by the institutions, grouped by IT risk control category, for the last three years (percentage of “No” answers over total answers)
Regarding the data architecture and data models[32], 27% of the institutions reported that implementation has not yet achieved (Chart 75).
Chart 75
Percentage of institutions for which data architecture model risk controls are in place
The institution has defined and documented its data architecture, data models, data flows, golden sources and data dictionary, and validated them with relevant business and IT stakeholders
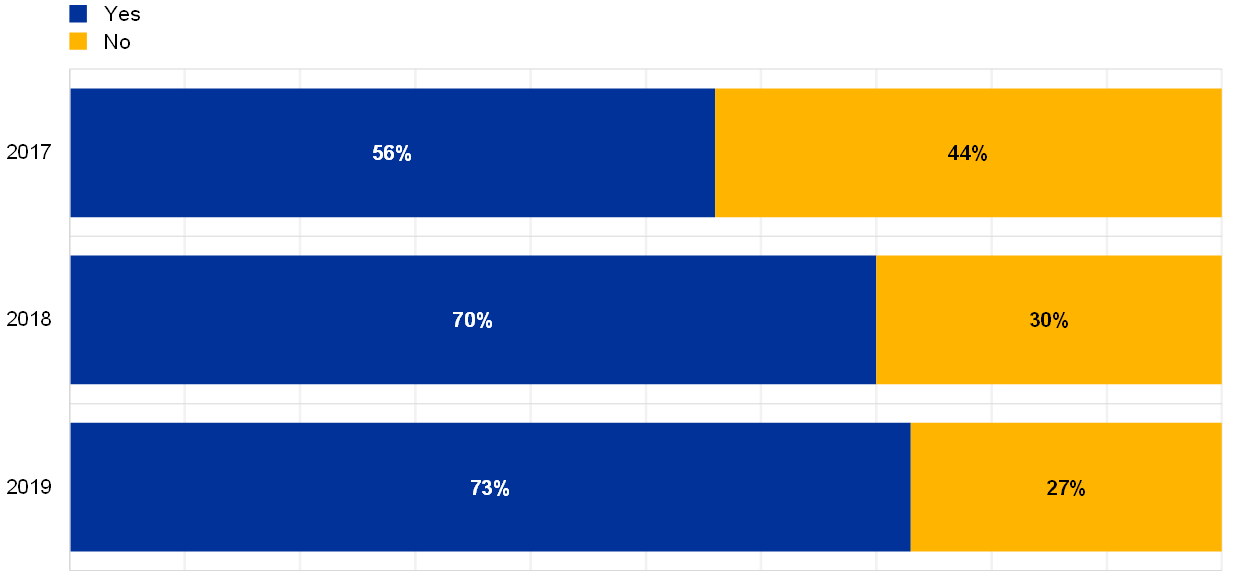
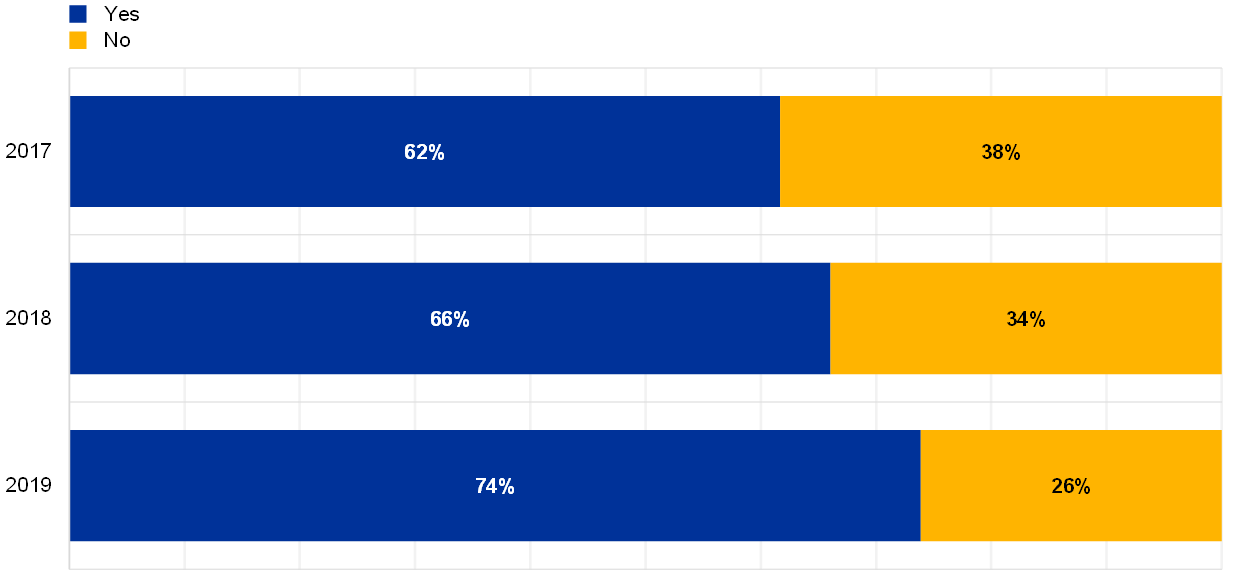
Data classification consists in assessing the risk level of data based on three criteria: Confidentiality, Integrity and Availability. This is a prerequisite for implementing proper controls that can ensure data integrity in the IT environments. Data classification is widely applied across the institutions directly supervised by the ECB. In 2019, the majority of the institutions (74%) reported that they carry out data classification and that they have appointed data owners (Chart 76).
Chart 76
Percentage of institutions for which information owners are determined
In order to properly conduct the data classification, clear owners of the information (categories) are determined
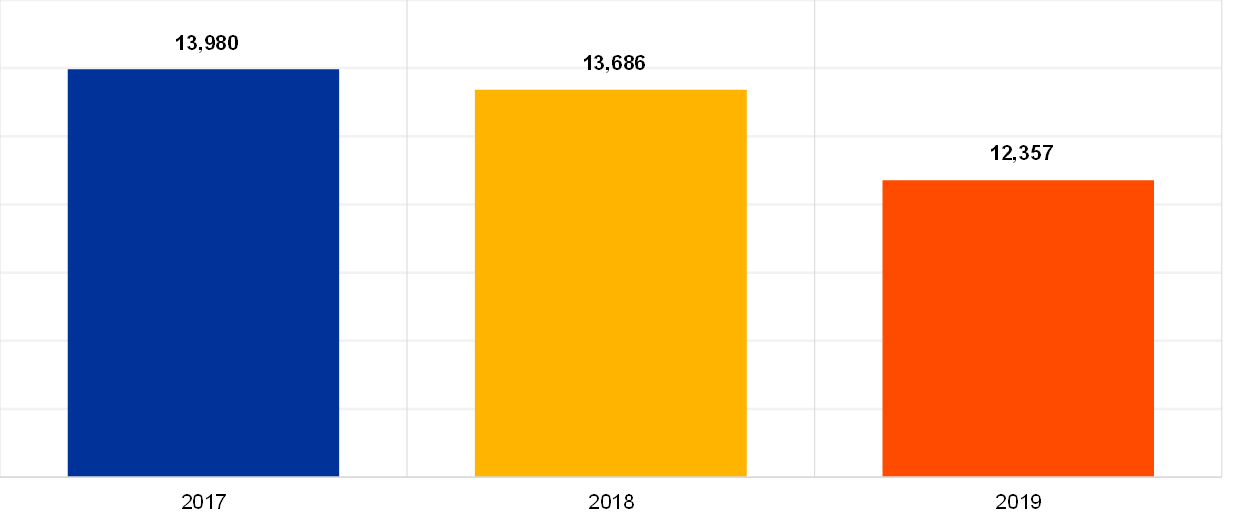
The total number of EUC solutions supporting critical activities has decreased (see Chart 77) as well as the number of institutions reporting having at least one EUC solution supporting critical activities (from 80% in 2018 to 70% in 2019). The decrease could be explained via the more detailed questions which were introduced in the 2019 ITRQ, making clearer the distinction between non-critical and critical EUC solutions. Many institutions reported that their EUC inventory does not cover all business areas/entities.
Chart 77
Total number of EUC solutions supporting critical activities (four outlier institutions excluded)
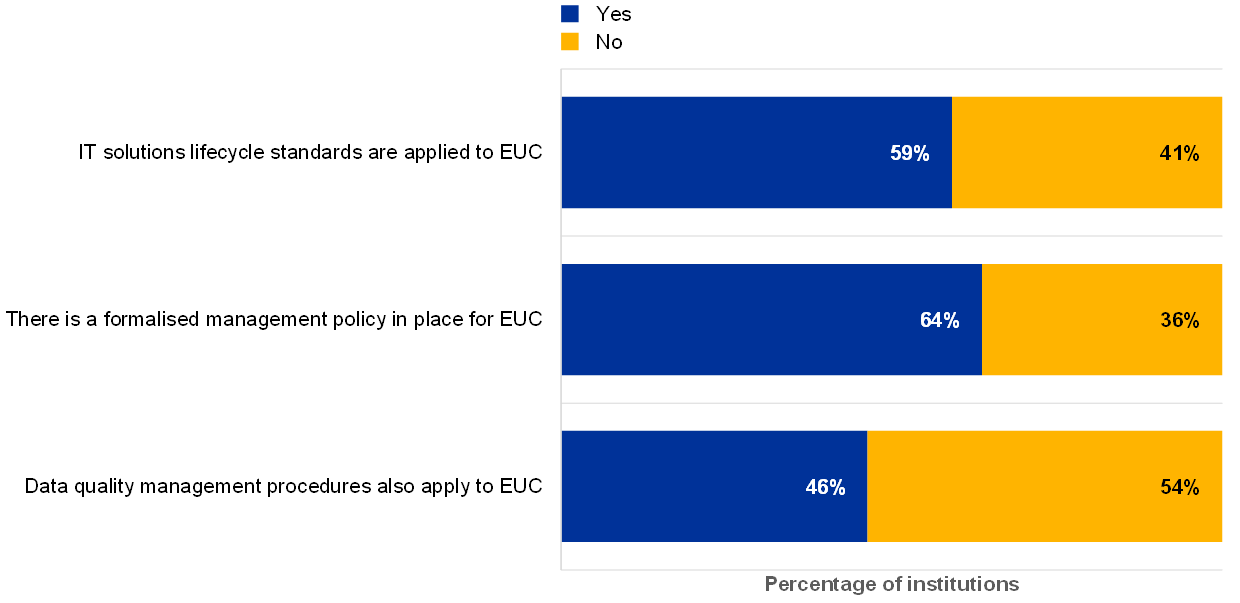
Many institutions commented that governance for their EUC solutions could be improved (Chart 78).
Chart 78
Percentage of institutions for which IT solutions lifecycle standards also apply to EUC, of institutions with a formalised management policy for EUC and of institutions for which data quality management procedures also apply to EUC (reference year 2019)
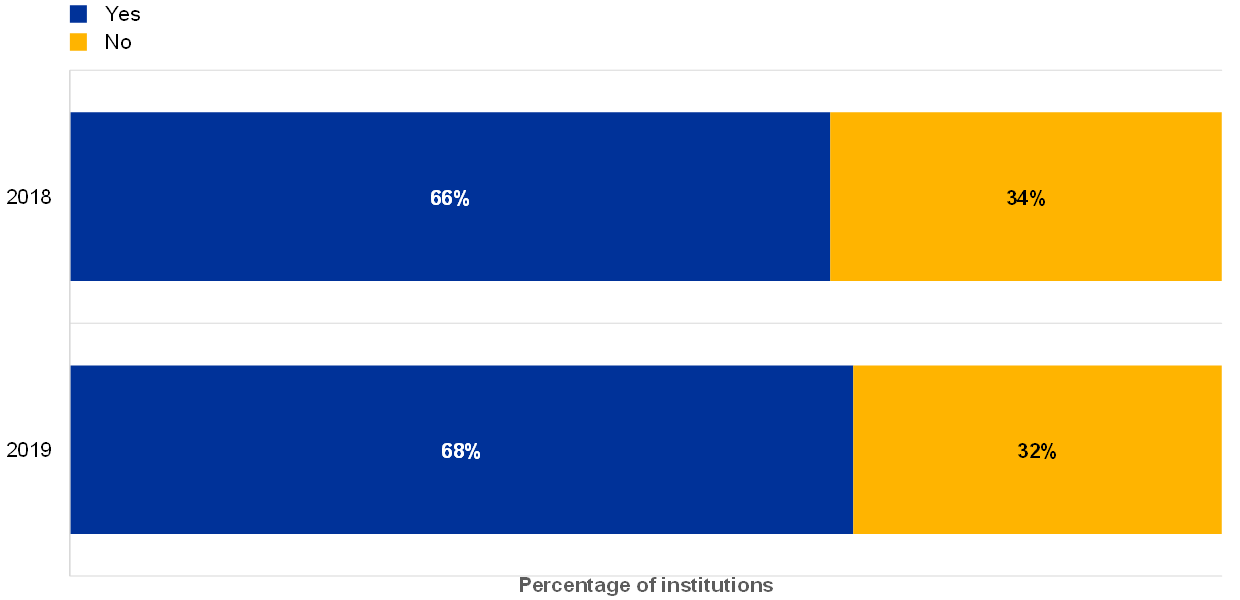
Most of the institutions that reported having at least one EUC supporting critical activities have a formalised policy in place. There is a small increase compared with the previous year (Chart 79).
Chart 79
Percentage of institutions, among those having at least one EUC supporting critical activities, which have a formalised management policy for EUC in place, for example to correctly identify, classify and protect all critical EUC assets and EUC-generated data
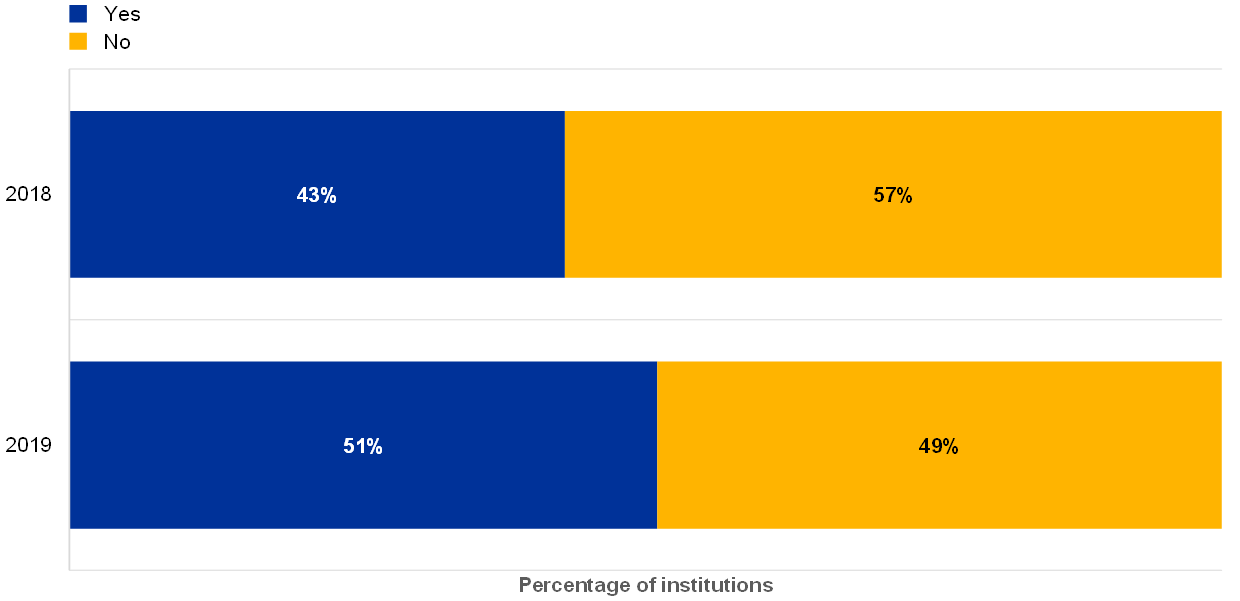
Compared with the previous year there is an upward trend on the implementation of data quality procedures for the EUC (Chart 80).
Chart 80
Percentage of institutions, among those having at least one EUC supporting critical activities, for which data quality management procedures also apply to EUC
2.6 IT internal audit
2.6.1 General description
The EBA Guidelines on ICT risk assessment include internal audit and refer to “[…]internal audit functions to provide assurance that the risks associated with ICT strategy implementation have been identified, assessed and effectively mitigated and that the governance framework in place to implement the ICT strategy is effective […]”[33]. The EBA Guidelines on ICT risk assessment should be read in conjunction with other EBA Guidelines, especially those on internal governance, which require institutions to implement an internal audit function[34]: “The independent internal audit function, as the third line of defence, conducts risk-based and general audits, and reviews the internal governance arrangements, processes and mechanisms to ascertain that they are sound and effective, implemented and consistently applied […]”[35].
Internal governance is commonly implemented by setting up a three lines-of-defence model. The aim of this part of the ITRQ is to obtain information on the quality of the internal audit function itself (the third line of defence), as well as the audit work performed within the institutions.
2.6.2 Methodology
The ITRQ collects general information on the IT audit work performed by the institutions, including an overview of the number of IT audits and the percentage of IT areas not assessed during the last three years, as well as about the audit universe coverage in general. The audit universe within the institutions is of great importance, and it is desirable that it be comprehensive, covering the full range of activities including IT risk.
The ITRQ also collects information on the number of new critical IT findings identified during the year, the number of closed critical IT findings and the number of outstanding critical IT findings that have been open for more than one year. This information provides an indication of IT audit focus areas and trends over time. Nevertheless, analysing the number of audits on a stand-alone basis does not provide an indication of the quality and comprehensiveness of the respective audits. The coverage of IT functions in the audit plans provides an indication of the capacity available to independently assess (critical) IT areas, but a lack of competent IT auditors or an insufficient number of qualified IT auditors may lead to situations in which the audits cannot be of the required frequency, quality and depth.
Trends in the number of findings can provide useful insights, particularly into the handling of audit findings by the institution over a longer period, taking into account the fact that resolving IT findings may require multi-year projects.
The level of involvement of the management body and senior management in the internal audit process, the audit quality and the reporting to the management body are also self-assessed by the institutions. The management body needs to be adequately involved in the internal risk control framework of the institutions. Therefore, the members need to be informed of the (critical) IT internal audit findings, as well as of any action plans and programmes to address the findings.
2.6.3 Main results and observations
IT internal audit is the risk control domain for which the institutions have been reporting the highest maturity risk level since 2017. Chart 81 provides an overview of the trend over the past three years regarding the IT audit risk controls put in place by the institutions.
Chart 81
Distribution of the IT internal audit maturity risk control self-assessment scores across years
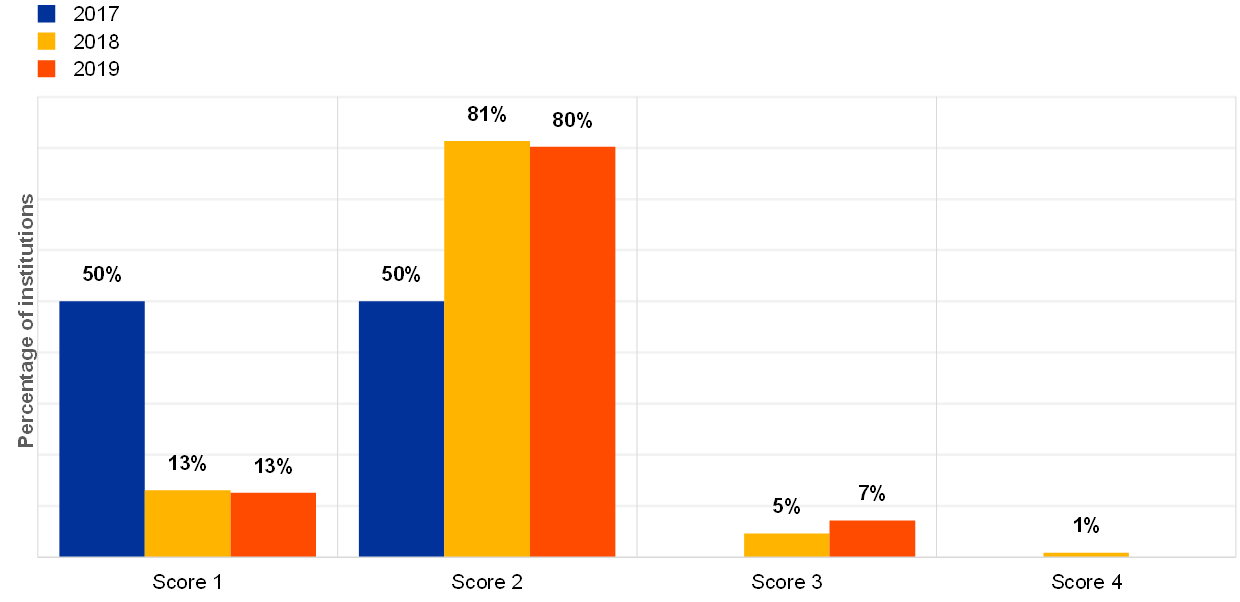
All institutions but one covered at least 50% of the IT functions during the audit cycle in the previous three years. Additionally, the percentage of IT functions reviewed by internal audit increased slightly within the reference year (74.3% in 2019 against 72.5% in 2018) and in the three-year cycle (91.8% in 2016-17-18 against 89.6% in 2017-18-19).
Chart 82
Breakdown of institutions by coverage of IT functions reviewed by internal audit between 2017 and 2019

Chart 83
Average percentages of IT functions assessed by internal audit within the reference year and within the three-year cycle
The overall number of critical IT findings (audit and supervisory) not remediated for longer than one year continued to decrease, with IT security findings remaining the majority (see Chart 84).
Chart 84
Total number of critical IT findings not remediated for more than one year across IT risk level categories
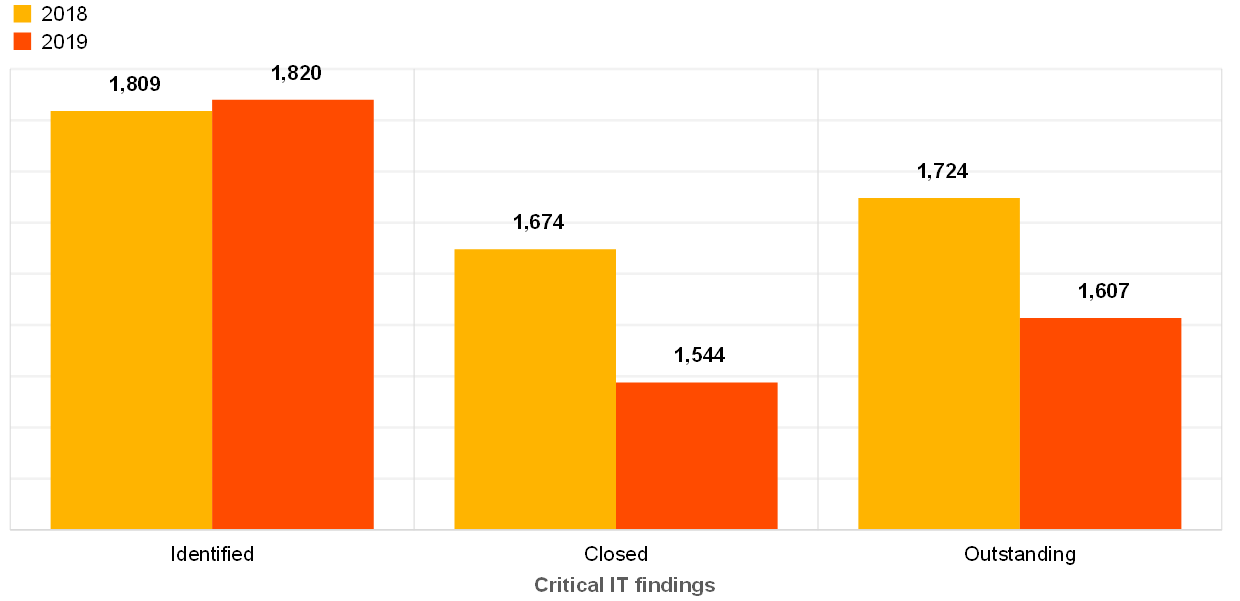
The number of critical IT internal audit findings identified during the year remained almost stable, while the number of critical IT internal audit findings closed during the year decreased by around 8% (see Chart 85).
Chart 85
Total number of critical IT findings identified, closed and outstanding in the reference year
The institutions reported that out of all the IT findings issued by internal audit, 12% are critical. Out of all the overdue IT findings[36], 17% are critical.
As for previous years, in 2019 most of the institutions likewise reported that they have adequate resources to perform the IT audit activities (Chart 86).
Chart 86
The internal audit function has adequate resources, in terms of both number of staff and competences/skills, to properly perform IT audit activities
2.7 IT governance
2.7.1 General description
According to the EBA Guidelines, internal governance must include “all standards and principles concerned with setting an institution’s objectives, strategies and risk management framework; how its business is organised; how responsibilities and authority are defined and clearly allocated; how reporting lines are set up and what information they convey; and how the internal control framework is organised and implemented, including accounting procedures and remuneration policies. Internal governance also encompasses sound information technology systems, outsourcing arrangements and business continuity management”[37].
2.7.2 Methodology
In order to assess the IT governance of the institutions, the ECB analysis considered amongst other things the indicators below.
- Staffing: total number of IT employees, vacant positions and staff turnover in the IT department. Additionally, the number of employees in the first, second and third lines of defence have been analysed.
- IT expenses: notably with breakdowns for IT run and IT change, IT security, IT innovation and IT outsourcing expenses.
- Management oversight of IT topics and the number of board members with IT expertise.
- Project management and innovations, including number of projects planned, in progress or completed or in the “innovation” area[38].
Additionally, the analysis took into account the institutions’ self-assessment maturity level scores for IT governance in three sub-categories: IT strategy, IT policies and IT budget as explained below.
- The IT strategy section checks that the institution has a well-defined and forward-looking IT strategy which is also closely monitored by the management. An undefined or inconsistent IT strategy might lead to misalignment across the different business areas.
- In the IT policies section it is checked whether the institution has appropriate and updated IT policies supporting the implementation of the IT strategy. Missing policies or guidelines might affect the ability of IT systems to support business areas and might compromise data security.
- Finally, the IT budget section checks that the institution has an appropriate process in place for estimating, allocating and approving the IT budget that should also support IT strategy implementation. If the budgeting process is not transparent or not properly defined, it might compromise an institution’s ability to react to unexpected expenses.
2.7.3 Main results and observations
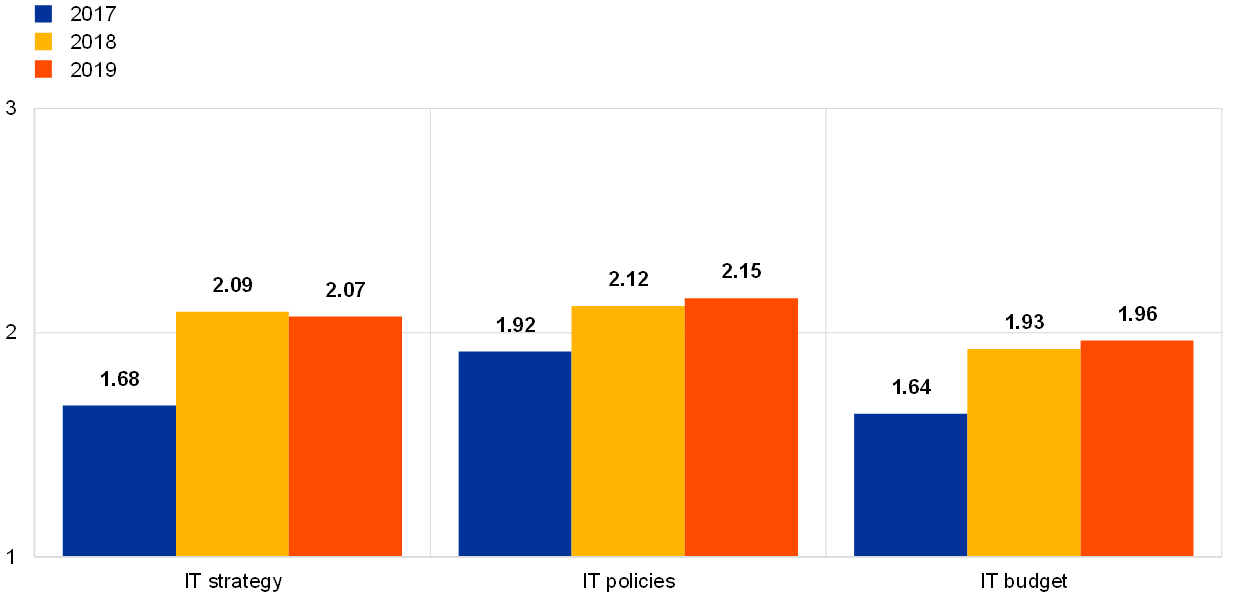
The institutions’ self-assessment scores remained fairly stable over the years for IT governance risk controls relating to IT strategy, IT policies and the IT budget.
Chart 87
Average self-assessment maturity level scores for the three IT governance risk control sub-categories
The institutions reported that overall they have around 1,800 full-time equivalents (FTEs) for both the third and the second lines of defence (Chart 88). The trend shows that there is an increase in staff compared with 2018 for both lines of defence. Not surprisingly, the increase is higher for the second line, given the maturity level of the third line, since, as stated in Section 2.6.3, IT internal audit is the risk control domain for which the institutions have been reporting the highest maturity level since 2017.
Chart 88
Total number of IT second and third line of defence FTEs for the last two reference years (excluding two outlier institutions)
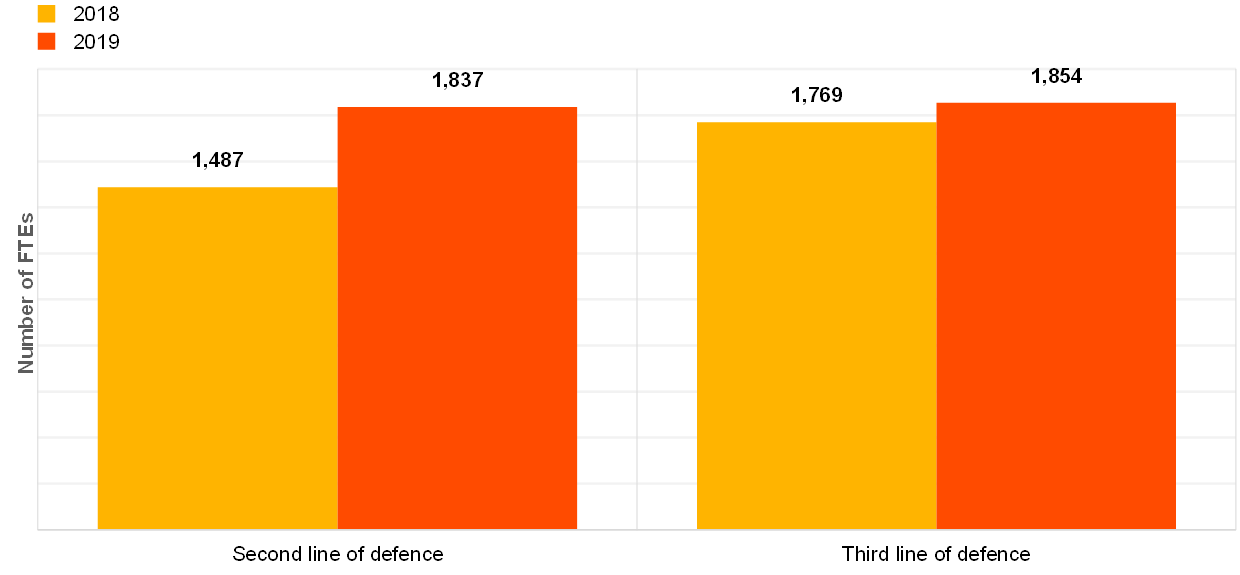
Chart 89
Average IT staff turnover by business model (reference year 2019)
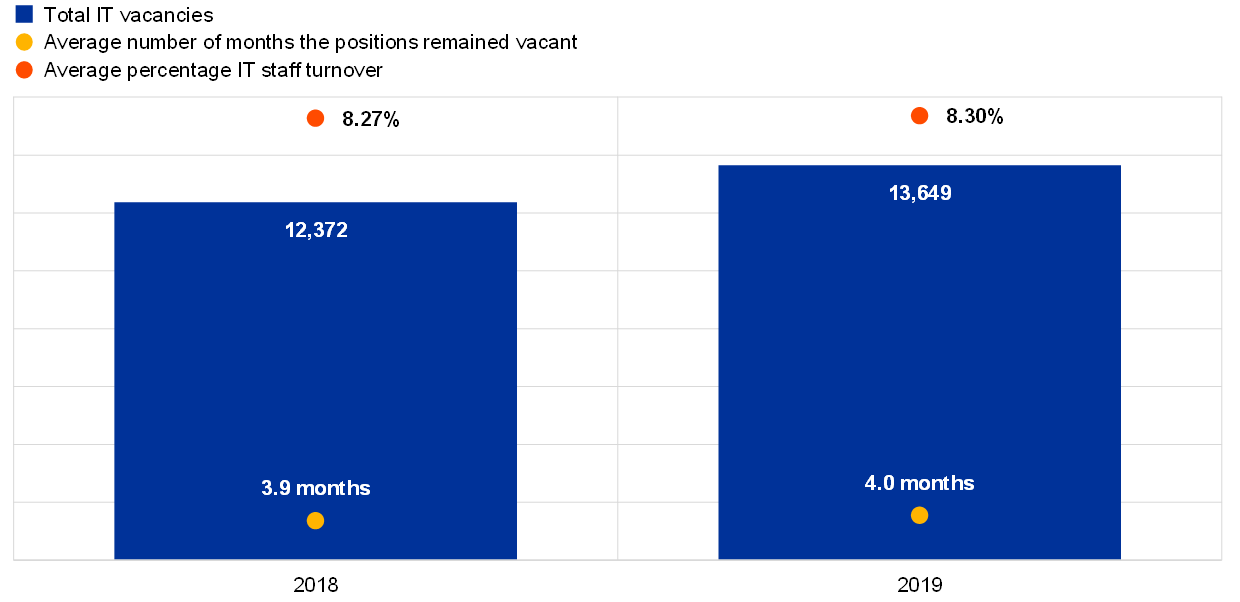
On average, IT staff turnover is reported as being around 8%, though differences are observed across business models (Chart 89). The overall average number of months the IT positions remained vacant is reported as four months. Both indicators remained stable compared with 2018 (see Chart 90).
Chart 90
Total number of IT vacancies, average number of months the positions remained vacant and average IT staff turnover
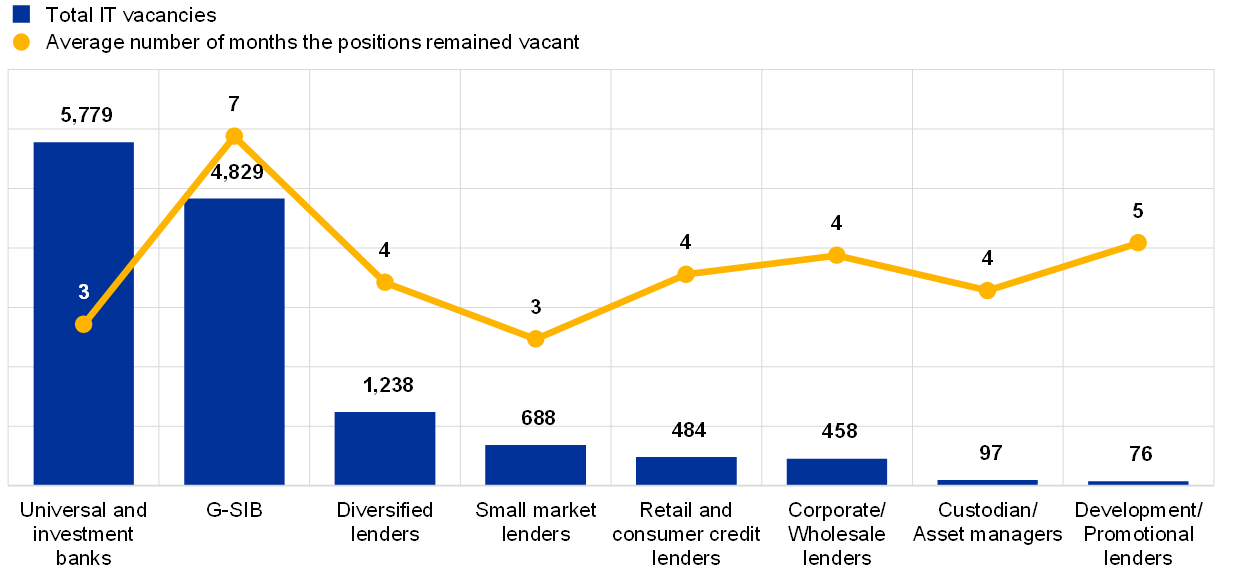
Universal and investment banks show the highest number of IT vacancies while their average period for vacant IT positions is three months (Chart 91). The highest average number of months for vacant IT positions is found within the G-SIB institutions (seven months).
Chart 91
Distribution of total IT vacancies and average number of months the positions remained vacant across business models (reference year 2019)
The reported maturity level of staffing, technical resources, qualification and training is also quite stable (see Chart 92). Meanwhile, there has been a slight increase in the implementation of clear roles and responsibilities as well as for segregation of duties within the IT organisation (see Chart 93), indicating that institutions have assigned more explicit functions to their employees.
Chart 92
Institutions’ self-assessment scores for the IT risk control category “staffing, technical resources, qualification and training”
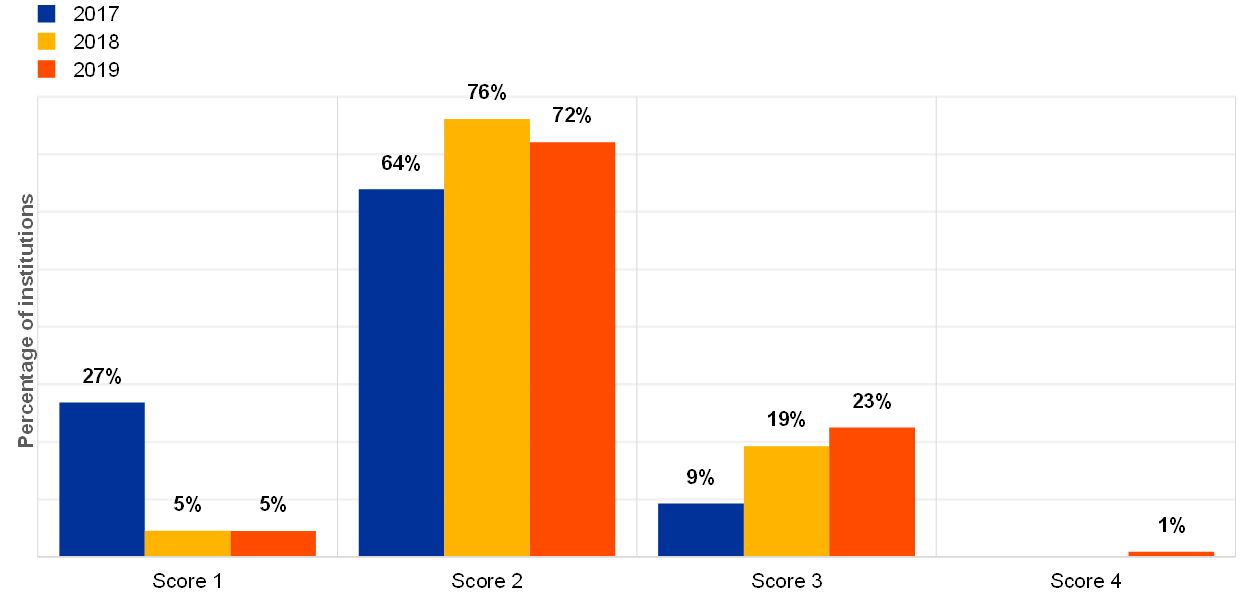
Chart 93
Institutions’ self-assessment scores for the IT risk control category “clear roles and responsibilities and segregation of duties within IT”
Although independence between the first and second lines of defence is mandatory[39], 5% of the institutions reported that they had not implemented this independence between the first and second lines of defence (Chart 94).
Chart 94
Percentage of institutions for which there is functional independence between the first and second lines of defence in the IT risk area (reference year 2019)
Is there a functional independence between 1st and 2nd Line of Defence (LoD) in the IT risk area?

On average, IT run expenses[40] represented 60% of the overall IT expenses for the reference year 2019 (see Chart 95). This is a stable percentage over recent years. Based on the forecasts provided through the ITRQ, the overall IT budget is expected to slightly decrease in 2020.
Chart 95
Distribution of IT run and change expenses across years (estimated figures for 2020)

In 2019, the 30 institutions with at least three board members with IT expertise reported to have on average (see Chart 96 and Chart 97):
- spent more on IT security (as a percentage of total IT expenses 8.7% vs. 4.3%);
- higher IT outsourcing expenses for cloud services (as a percentage of total IT outsourcing expenses 17% vs. 6%);
- a lower number of hours for detecting cyberattacks, both including and excluding DDoS (3 hours vs. 14 hours).
Chart 96
Overview of average IT expenses, IT change expenses, IT innovation expenses (*one outlier excluded) and IT security expenses as a percentage of total expenses and different IT outsourcing expenses as a percentage of total IT outsourcing expenses for institutions with at least (or fewer than) three board members with IT expertise (reference year 2019)
Has the institution at least three board members with IT expertise?
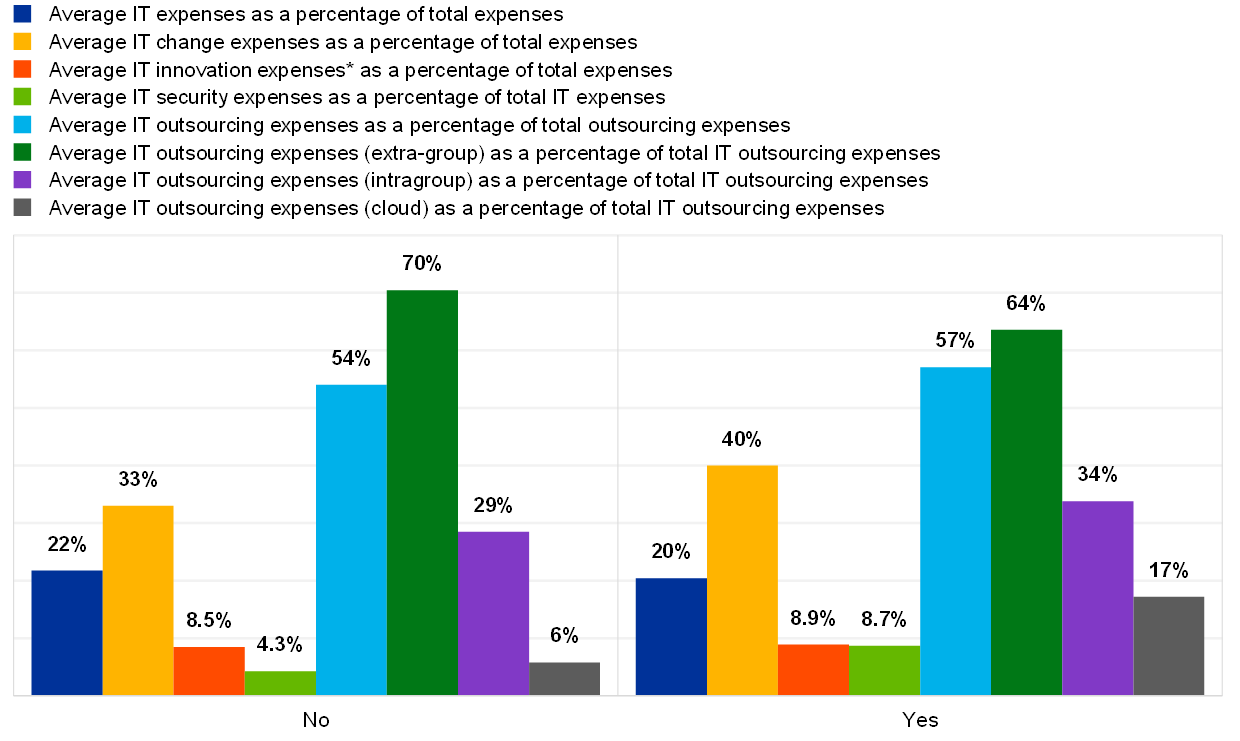
Chart 97
Overview of institutions with at least (or fewer than) three board members with IT expertise and their average time of detection (reference year 2019)
Has the institution at least three board members with IT expertise?
The IT landscape is changing, as shown by the reported expenses for projects with an impact on the IT landscape/architecture (€8.1 billion), which represent 68% of the total expenses for critical projects (see Chart 98). Regarding the projects related to EOL systems, the expenses are significant, with €3.2 billion in investment.
Almost half of the critical projects (44%) had an impact on the IT landscape, which means, for instance, major changes in the architecture (new hardware, new operating systems, new software, etc.), and 16% were related to EOL systems (either replacement or mitigation measures).
Chart 98
Overview of critical projects with significant IT undertaking (planned, in progress or completed in the reference year) and related expenses
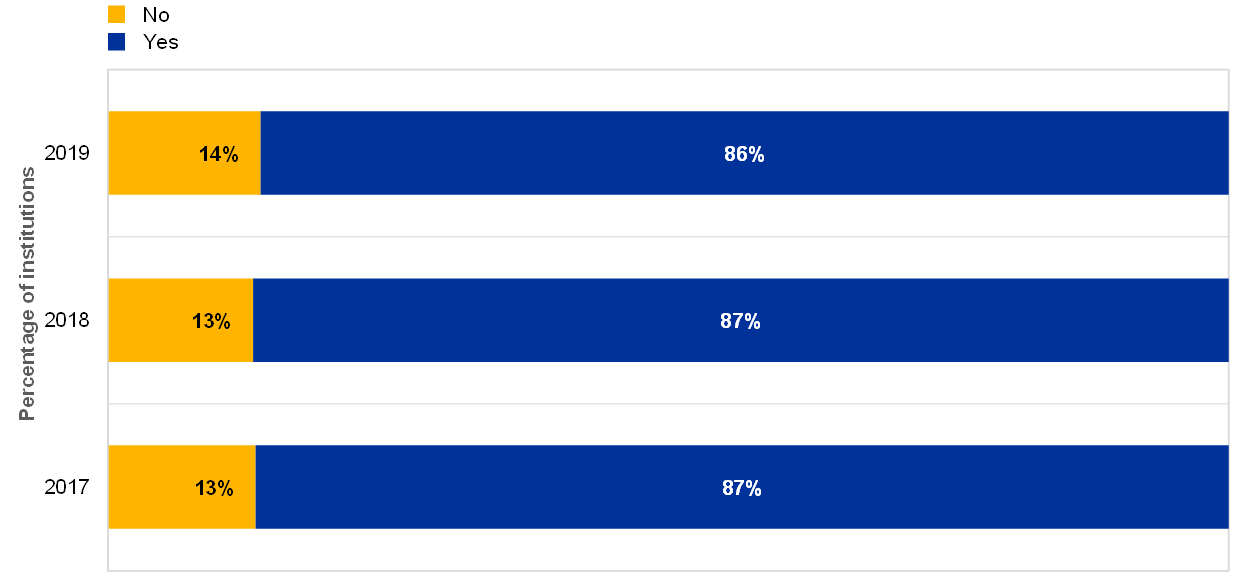
Furthermore 86% of institutions declared that they are undertaking projects or research in the area of innovation, e.g. big data, use of artificial intelligence, moving core functions to the cloud, implementing blockchain technologies, PSD2 and fintech companies (Chart 99).
Chart 99
Percentage of institutions declaring that they are undertaking projects or research in the area of “innovation”

© European Central Bank, 2021
Postal address 60640 Frankfurt am Main, Germany
Telephone +49 69 1344 0
Website www.bankingsupervision.europa.eu
All rights reserved. Reproduction for educational and non-commercial purposes is permitted provided that the source is acknowledged.
For specific terminology please refer to the SSM glossary (available in English only).
PDF ISBN 978-92-899-4769-5, ISSN 2600-3449, doi:10.2866/811406, QB-CP-21-001-EN-N
HTML ISBN 978-92-899-4770-1, ISSN 2600-3449, doi:10.2866/75837, QB-CP-21-001-EN-Q
- EBA/GL/2017/05 EBA Guidelines on ICT Risk Assessment under the Supervisory Review and Evaluation Process (SREP). These Guidelines are addressed to competent authorities and are intended to promote common procedures and methodologies for the assessment of information and communications technology (ICT) risk under the Supervisory Review and Evaluation Process (SREP) referred to in Article 97 of Directive 2013/36/EU (the Capital Requirements Directive (CRD IV)). In particular, they were drawn up pursuant to Article 107(3) of Directive 2013/36/EU in order to supplement and further specify criteria for the assessment of ICT risk as part of operational risk set out in the EBA Guidelines on common procedures and methodologies for the Supervisory Review and Evaluation Process (SREP) (EBA/GL/2014/13). The ECB complies with the Guidelines from the date of notification within the limit of, and without prejudice to, national provisions implementing Directive 2013/36/EU.
- EBA/GL/2017/05 EBA Guidelines on ICT Risk Assessment under the Supervisory Review and Evaluation Process (SREP). These Guidelines are addressed to competent authorities and are intended to promote common procedures and methodologies for the assessment of information and communications technology (ICT) risk under the Supervisory Review and Evaluation Process (SREP) referred to in Article 97 of Directive 2013/36/EU (the Capital Requirements Directive (CRD IV)). In particular, they were drawn up pursuant to Article 107(3) of Directive 2013/36/EU in order to supplement and further specify criteria for the assessment of ICT risk as part of operational risk set out in the EBA Guidelines on common procedures and methodologies for the Supervisory Review and Evaluation Process (SREP) (EBA/GL/2014/13). The ECB complies with the Guidelines from the date of notification within the limit of, and without prejudice to, national provisions implementing Directive 2013/36/EU.
- As defined in Article 97 of the CRD IV (Directive 2013/36/EU).
- The ITRQ is reviewed and updated every year to reflect the evolution of regulation and best practice in the domain of IT risk.
- The ECB cyber incident reporting process was introduced in 2017. The decision was adopted by the Supervisory Board under Article 26(8) of Council Regulation (EU) No 1024/2013 of 15 October 2013 conferring specific tasks on the European Central Bank concerning policies relating to the prudential supervision of credit institutions (OJ L 287, 29.10.2013, p. 63), pursuant to the powers conferred in accordance with Article 10(1)(a) of Regulation (EU) No 1024/2013 and Article 141(1) of Regulation (EU) No 468/2014 of the European Central Bank of 16 April 2014 establishing the framework for cooperation within the Single Supervisory Mechanism between the European Central Bank and national competent authorities and with national designated authorities (SSM Framework Regulation) (ECB/2014/17) (OJ L 141, 14.5.2014, p. 1) to require supervised entities to report significant cyber incidents to the ECB.
- Also sometimes referred to as the 2020 ITRQ, as the banks’ self-assessments contribute to the IT risk assessment as part of 2020 SREP.
- All scores use the same scale, from “1” to “4”. In particular, for IT risk level “1” indicates the lowest risk level and “4” the highest risk level.
- For IT risk control, “1” indicates the highest IT risk control maturity and “4” the lowest IT risk control maturity.
- EBA/GL/2019/04 EBA Guidelines on ICT and security risk management.
- EBA/GL/2019/02 EBA Guidelines on outsourcing arrangements, overall entry into force September 2019. This is without prejudice to national regulation.
- Each institution should: “complete the documentation of all existing outsourcing arrangements [...] in line with these guidelines following the first renewal date of each existing outsourcing arrangement, but by no later than 31 December 2021”.
- EBA/GL/2017/11 EBA Guidelines on internal governance, (paragraphs 204 and 205), and the standards established by the Institute of Internal Auditors.
- EBA/GL/2017/05 EBA Guidelines on ICT Risk Assessment under the Supervisory Review and Evaluation Process (SREP).
- “End-of-life system” refers to a product (software or hardware) that is not supported any longer by the vendor, meaning no bug correction, no vulnerability patches, no evolution, etc.
- Critical findings not remediated for longer than one year (one year from the disclosure of the finding) include findings from internal audit, supervisory findings from on-site inspections and internal model investigations, and external audits.
- The data refer to the reference year 2019. However, in January 2020, for example, many Windows systems became EOL systems, therefore the number of EOL systems might increase in the 2021 SREP.
- EBA/GL/2017/05 EBA Guidelines on ICT Risk Assessment under the Supervisory Review and Evaluation Process (SREP), paragraph 8.
- BCPs and DRPs are both continuity measures. While the BCP takes into account the business needs, the DRP takes into account the technical aspects (IT).
- A service level agreement is an internal or external contract defining IT services in terms of availability, recovery, capacity, etc. Whenever objectives are not met, this is called an SLA breach.
- EBA/GL/2017/05 EBA Guidelines on ICT Risk Assessment under the Supervisory Review and Evaluation Process (SREP), paragraph 8.
- E.g. networks, infrastructures, critical applications and technologies supporting major business products or services.
- The question regarding changes leading to issues for critical IT systems was introduced in 2018.
- EBA/GL/2017/05 EBA Guidelines on ICT Risk Assessment under the Supervisory Review and Evaluation Process (SREP), paragraph 56(i).
- EBA/GL/2017/05 EBA Guidelines on ICT Risk Assessment under the Supervisory Review and Evaluation Process (SREP), paragraph 8.
- EBA/GL/2019/02 EBA Guidelines on outsourcing arrangements, paragraph 5.
- EBA/GL/2019/02 EBA Guidelines on outsourcing arrangements, paragraph 52.
- Since this is a new question, introduced for the first time in the 2020 ITRQ with reference year 2019, no comparison with previous years is available.
- EBA/GL/2017/05 EBA Guidelines on ICT Risk Assessment under the Supervisory Review and Evaluation Process (SREP), paragraph 8.
- EBA/GL/2017/05 EBA Guidelines on ICT Risk Assessment under the Supervisory Review and Evaluation Process (SREP), paragraph 57.
- “Supervisory expectations on risk data aggregation capabilities and risk reporting practices”, June 2019.
- Basel Committee on Banking Supervision Standard 239, “Principles for effective risk data aggregation and risk reporting”, January 2013.
- EBA/GL/2017/05 EBA Guidelines on ICT Risk Assessment under the Supervisory Review and Evaluation Process (SREP), paragraph 57.
- EBA/GL/2017/05, EBA Guidelines on ICT Risk Assessment under the Supervisory Review and Evaluation Process (SREP), paragraph 27(c).
- EBA/GL/2017/11, EBA Guidelines on internal governance, paragraph 179.
- EBA/GL/2017/11, EBA Guidelines on internal governance, paragraph 31.
- Overdue findings are those which are still open past the due date and those which were closed with a delay.
- EBA/GL/2017/11 EBA Guidelines on internal governance, paragraph 18.
- The “innovation” area includes projects involving big data, use of artificial intelligence, moving core functions to the cloud, implementing blockchain technologies, PSD2, cryptocurrencies or fintech companies.
- EBA/GL/2017/11 EBA Guidelines on internal governance, paragraph 32.
- IT run expenses are the costs for operating and maintaining the current IT systems and services, whereas IT change expenses are for the development and the implementation of IT systems (business application and IT infrastructure) and services.