Risk report on less significant institutions
Executive summary
The risk report on less significant institutions (LSIs) is an annual assessment of the conditions in the LSI sector, conducted collaboratively by the European Central Bank (ECB) and the national competent authorities (NCAs). It combines a comprehensive quantitative analysis of the current LSI risk profile with forward-looking considerations of the main risks and vulnerabilities facing LSIs. The report draws on both the day-to-day supervisory work done by NCAs, and the ECB's oversight activities. Furthermore, the report incorporates findings from dialogues with LSIs and their banking associations.
The LSI sector is composed of more than 2,400 institutions that are relatively small in size and mainly characterised by a traditional lending-oriented business model. In the first half of 2019 the LSI sector witnessed a major structural change: the reform of credit cooperative banks in Italy (Banche di Credito Cooperativo – BCCs) led to the incorporation of 228 BCCs into two significant institution (SI) groups.[1] Overall, the number of LSIs is down by 316 (or 11.4%) compared to end-2017, and the number of LSIs has decreased by more than 600 banks since European banking supervision began.
Despite this consolidation, poor profitability remains a major vulnerability for LSIs, which raises questions about the overall sustainability of certain business models. The sector continues to witness a persistent decline in profitability: in 2018 the average return on equity (ROE) for LSIs stood at 4.7% in comparison to 5.8% in 2017 – both these figures are below the 6.2% average ROE level of SIs. In 2018 core income sources for LSIs, such as net interest income (NII) and net fees and commission income (NFCI), remained broadly stable, with the decline in net profits mainly driven by adverse developments in financial markets.
Nonetheless, the stability of NII conceals shrinking lending margins on the back of relatively strong credit growth, with gross LSI interest income steadily declining despite the expanded lending book. Alongside their consolidation efforts, LSIs are reacting to shrinking income by containing expenses. In particular, staff expenses and other administrative costs remained stable over the course of 2018, which contrasts with the annual growth of 2-3% seen between 2015 and 2017. Furthermore, certain business models seem to suffer more from persistent low profitability – in particular LSIs classified as corporate or wholesale lenders and investment banks.
LSIs are gradually moving into digitalisation; while this move presents many opportunities, it also presents several risks. As with larger banks, the digitalisation of business by LSIs requires consistent upfront investments in IT but the expected returns usually materialise much later on. Generally, banks are attempting to form alliances with digital platform providers, so as to avoid being relegated to the role of simple service providers, while also being able to partake in the whole value added chain with the customer. Section 2.1 of this report looks specifically at whether the radically different business models of digital-only LSIs can provide a viable solution to the low profitability trap currently affecting most of the European banking sector. This section shows that, among digital-only LSIs, the purely retail-oriented banks are struggling to make profits. These banks are stuck between the low interest revenues on their assets and the need to offer competitive accounts that are cheap and easy to use (thereby incentivising customers to switch from more established banks). The high non-staff related expenditures necessary for digitalised business models (e.g. IT and marketing costs) can also put a high burden on a bank's current finances. Nevertheless, more specialised digital-only LSIs – such as payment system banks and business to business (B2B) banks that offer financial technology services to other companies – are proving to be very profitable, and they may soon start to put pressure on established banks.
LSIs have continued to expand their loan portfolios at an average rate of around 4-5% over the last three years.[2] Solid lending growth, coupled with more active restructuring of non-performing loans (NPLs), helped to decrease NPL ratios for LSIs to 2.7% in 2018 (core NPL ratio was 3.6%). Nonetheless, there are still about 300 LSIs (that account for around 10% of the sector’s total assets) exhibiting NPL ratios above 5%. Accordingly, as prescribed by European Banking Authority (EBA) guidelines on management of NPLs, enhanced scrutiny of these banks is advisable, including close monitoring of their adherence to credible NPL reduction plans.
Exposures to sovereign counterparties represent a substantial part of LSI balance sheets. Over 10% of LSI assets (around €500 billion in total) consist of exposures to sovereign counterparties, while levels of exposure vary a lot from country to country. For LSIs, more than 80% of such exposures are to domestic counterparties (in contrast to 50% for SIs), with the local sovereign debt market representing an investment alternative for funds in excess. While this is understandable for more domestically-focused banks such as LSIs, in some cases the share of domestic sovereign exposure is very high – for around 140 LSIs (representing around 11.8% of the sector’s total assets) over 20% of their total assets are sovereign bonds or loans to the government of the country where they are based. The vast majority of these exposures are booked at amortised costs, which mitigates the impact of adverse fluctuations in market prices for LSIs. Developments in sovereign exposures should be closely monitored, including the effects they may have on LSI profitability.
LSIs enjoy a comfortable liquidity position because they hold large amounts of deposits. Banks in the LSI sector have ample liquidity buffers and display a combined average liquidity coverage ratio (LCR) of more than 200%. However, maturity mismatch (which is, on average, higher for LSIs than for SIs) could be a source of vulnerability in the future.
Almost all national LSI sectors are, to varying degrees, affected by low profitability and business model issues. Credit risk is more prominent in the national LSI sectors that are more exposed to issues relating to the legacy of the financial crisis. In some countries, certain risks remain relevant, though country specific. For instance, in terms of interest rate risk in the banking book (IRRBB), most LSIs would be vulnerable to sudden rises in interest rates, but the issue remains more severe in countries where LSIs have a high proportion of fixed interest rate assets. Other country-specific risks include legal risk, conduct risk and risks related to Brexit.
With these risks in mind, LSIs, on average, maintain levels of capitalisation comfortably above minimum requirements – for example, their average Common Equity Tier 1 (CET1) ratio is 17% – consolidating on the stable growth they have experienced in the previous three years. Excess CET1 capital (i.e. fully loaded CET1 capital above minimum requirements) is, on average, between 3% and 6% of total LSI risk exposure amount (REA).[3]
Introduction
Findings from the LSI risk report help to identify risks and vulnerabilities affecting the euro area banking system, with a specific focus on issues related to small and medium-sized banks.[4] These findings then feed through to the supervisory priorities of NCAs. The report consists of two main parts.
The first part delivers a comprehensive quantitative analysis of the LSI sector at the European level on the basis of end‑2018 data. A comparison with past data as well as benchmarking – both across countries and with SIs – helps to further our understanding of the developments in key risk metrics across the whole LSI sector. Where appropriate, the analysis also makes use of benchmarking across individual institutions to detect potential outliers that might provide useful insights. Annex I details further information on the methodologies adopted in this report in relation to data management and the compilation of summary statistics.[5]
The second part is a deep dive, presenting a thematic analysis of digital-only LSIs i.e. innovative banks using primarily digital channels, such as online services, mobile apps, etc., to cater for existing and new clients.
1 Part 1 – Developments in the LSI sector in 2018
1.1 Key developments in the structure of the LSI sector under European banking supervision
- The number of LSIs dropped to 2,453 entities in 2018, reflecting the reform of Italian BCCs, with some 228 banks merging into two new banking groups classified as SIs.[6]
- In the rest of the LSI sector the ongoing consolidation trend continued, with 92 mergers and acquisitions (M&As) taking place during 2018, involving 184 banks.
- The LSI sector continues to grow, as total assets increased by 3.2% in 2018, with the average LSI size reaching €2 billion.
The number of LSIs reduced by 11.4% during the period 2017 to 2018: there were 2,453 LSIs as of December 2018 – that is 317 fewer institutions than in December 2017. The decline in LSI numbers reflects a major structural change in the Italian LSI sector, as a result of reforms that led to the incorporation of 228 BCCs into two new banking groups that are classified as SIs.
Chart 1
Changes in the number of LSIs (2014-18)
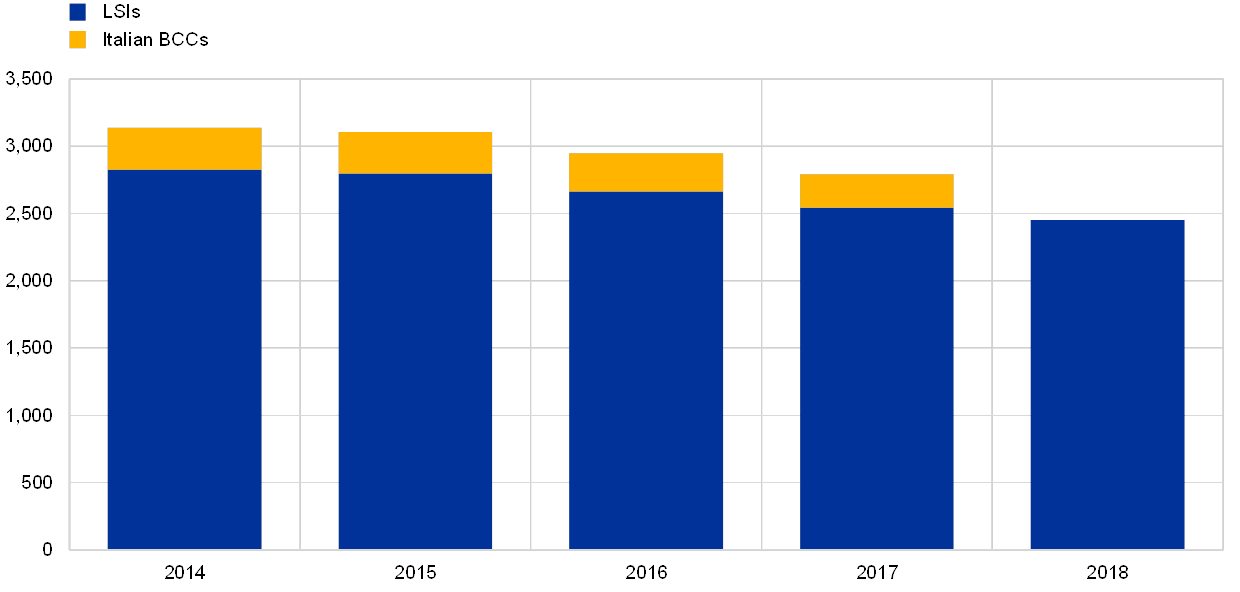
Source: ECB list of supervised entities.
Notes: Figures include branches and FMIs. For the purpose of this chart, the Italian BCC merger was assumed to have taken place in 2018.
Chart 2
Changes in the number of LSIs in 2018
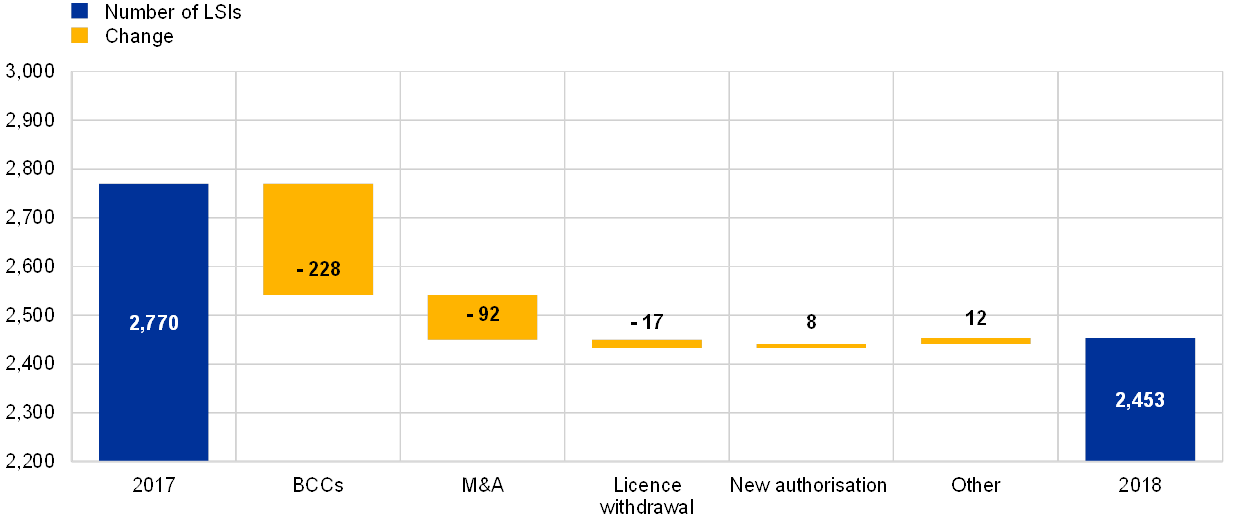
Source: ECB list of supervised entities.
Notes: Figures include branches and FMIs. For the purpose of this chart, the Italian BCC merger was assumed to have taken place in 2018. The category “Other” includes non-credit institutions that are new or recently removed from banking supervision (branches, financial holdings, etc.).
Despite these changes, the LSI sector continues to represent a relevant share of the wider European banking industry; the LSI sector holds roughly 19% of total assets of the banking sector in the euro area (see Table 1). Considering LSI assets as a share of a country’s total banking assets can provide an indication as to the relative importance of the LSI sector for that particular country. This perspective also helps to clarify differences in the composition of the various domestic banking systems across the euro area. In Luxembourg, Germany, Austria and Ireland, the importance of the LSI sector is relatively high; in these countries, LSIs account for over one-third of assets held in the domestic banking sector. In contrast, the LSI sector is relatively small in countries where the banking sector is more concentrated, such as in France (7.7% of total banking sector), Spain (4.8% of total banking sector) and Greece (2.6% of total banking sector). In absolute value, the LSI sector in Germany is by far the largest, hosting over 1,400 institutions (which together represent around 55% of total LSI assets at the European level). The LSI sector also includes some institutions that are classified as financial market infrastructures (FMIs) – these are typically central counterparties (CCP) with banking licences.[7]
Table 1
Relevance of the LSI sector in each euro area country
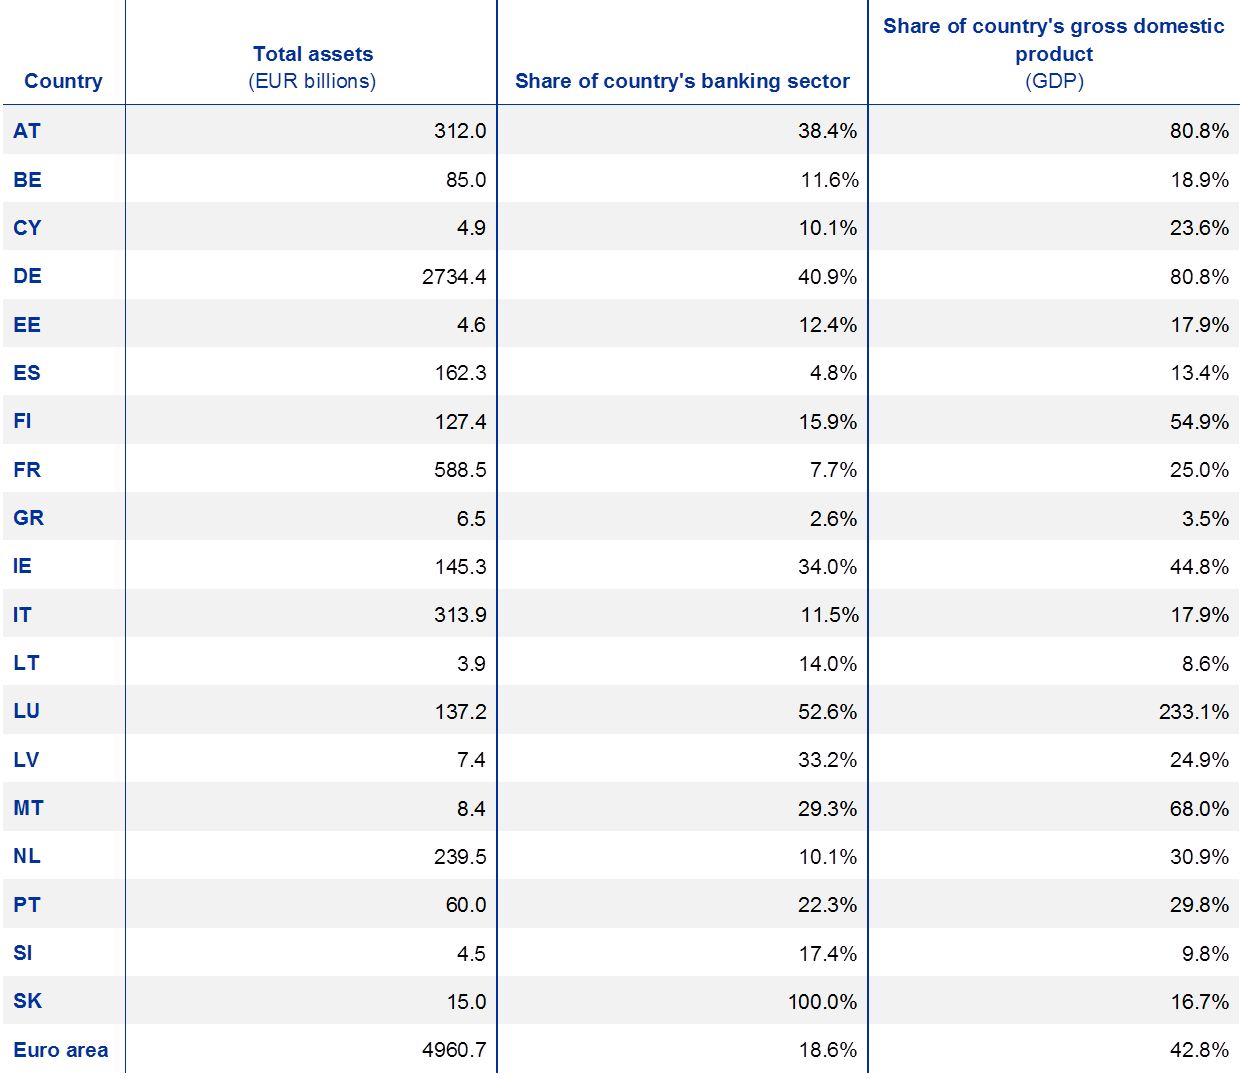
Sources: Banks' supervisory reporting and ECB calculations.
Notes: Based on LSIs at the highest level of consolidation, including branches and FMIs. For further details see Annex I.
Figure 1
Location of LSIs across Europe
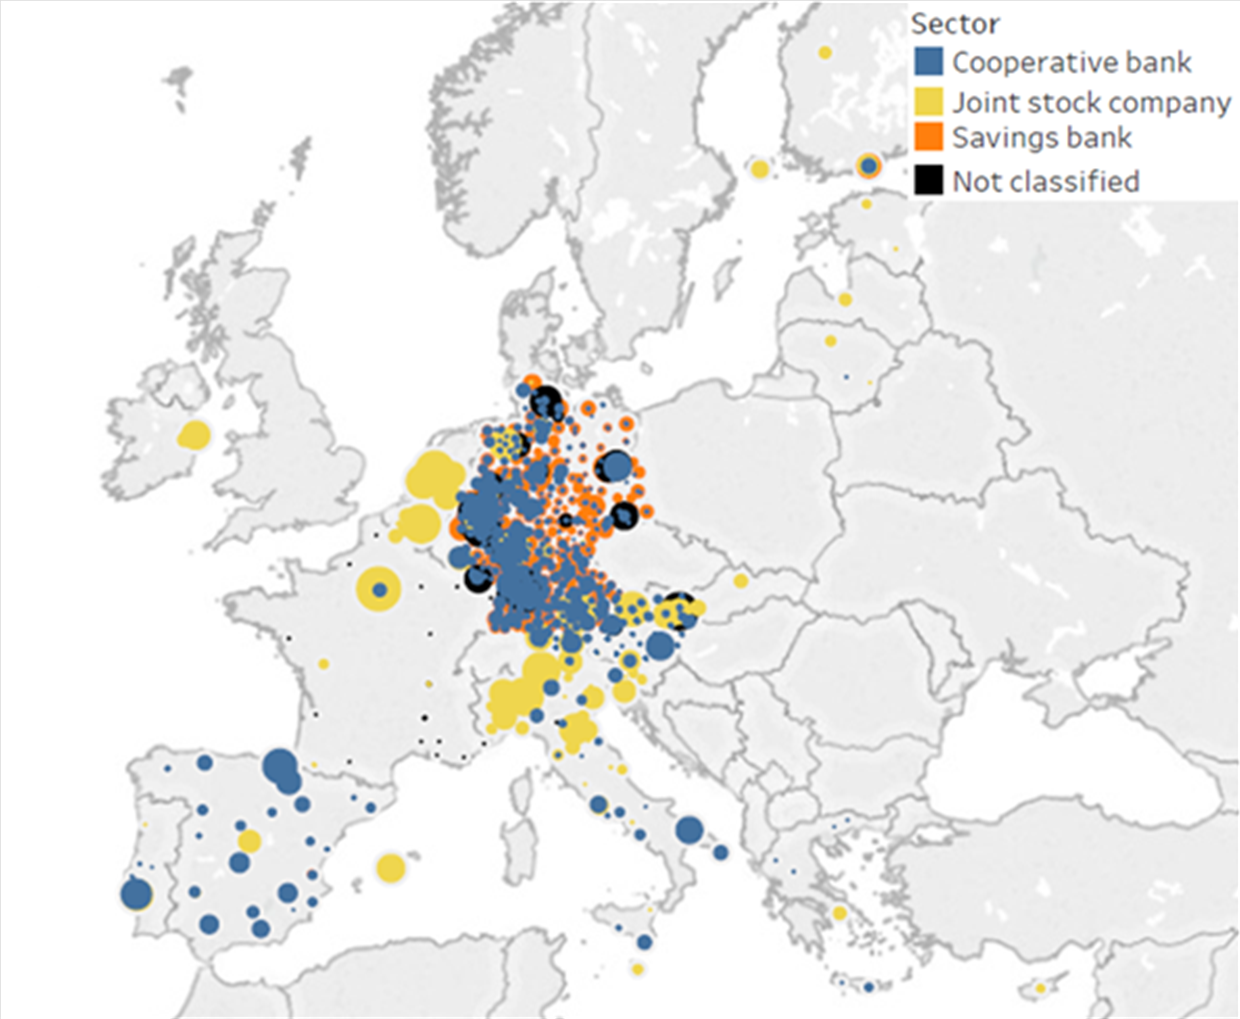
Sources: ECB list of supervised entities and ECB calculations.
Notes: Based on the longitude and latitude of LSI headquarters in Europe. The size of the bubbles is a function of the total assets of each LSI.
M&As continue to be the main driver of changes in LSI numbers. During 2018 there were 92 M&A transactions involving 184 LSIs; this signifies a reduction in merging activities when compared to figures for 2016 (111 M&As involving 243 banks) and 2017 (126 M&As involving 269 banks). Most M&A transactions took place in Germany, Italy and Austria – euro area countries with the largest, more fragmented banking sectors. Furthermore, 74% of banks involved in mergers were in the cooperative sector. Most M&As were domestic,[8] involving institutions within the same country and sector. Acquirers tended to be bigger and more profitable than the institutions being acquired.
For most LSIs, mergers and consolidation remain the most effective ways to achieve economies of scale and decrease relative costs. However, banks are aware of the potential hidden consequences of these operations – for example, loss of local focus (particularly when mergers entail the closing of local branches) or risks stemming from the integration of different IT systems. In addition, the cost of implementing regulation is likely to encourage consolidation or at least the centralisation of the regulatory response for banks organised in cooperatives or with a central entity. Finally, the cost of performing due diligence on target banks is a considerable disincentive to acquisitions.
Changes in the number of LSIs since 2014 confirm a trend towards consolidation observable in the LSI sector since the start of European banking supervision. Since December 2014 the number of LSIs has fallen by more than 600 entities (including Italian BCCs that have now joined banking groups classified as SIs).
Chart 3
M&As since 2015
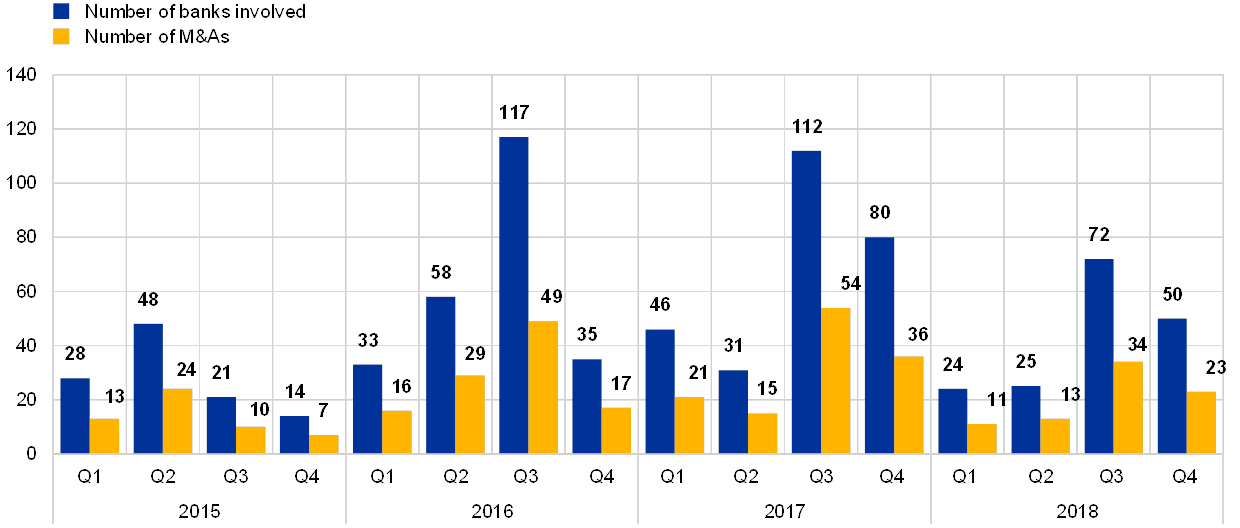
Source: ECB list of supervised entities.
Note: Figures for Italy include the mergers carried out in 2018 before the creation of the SI sector.
Chart 4
LSIs acquired through M&As in 2018
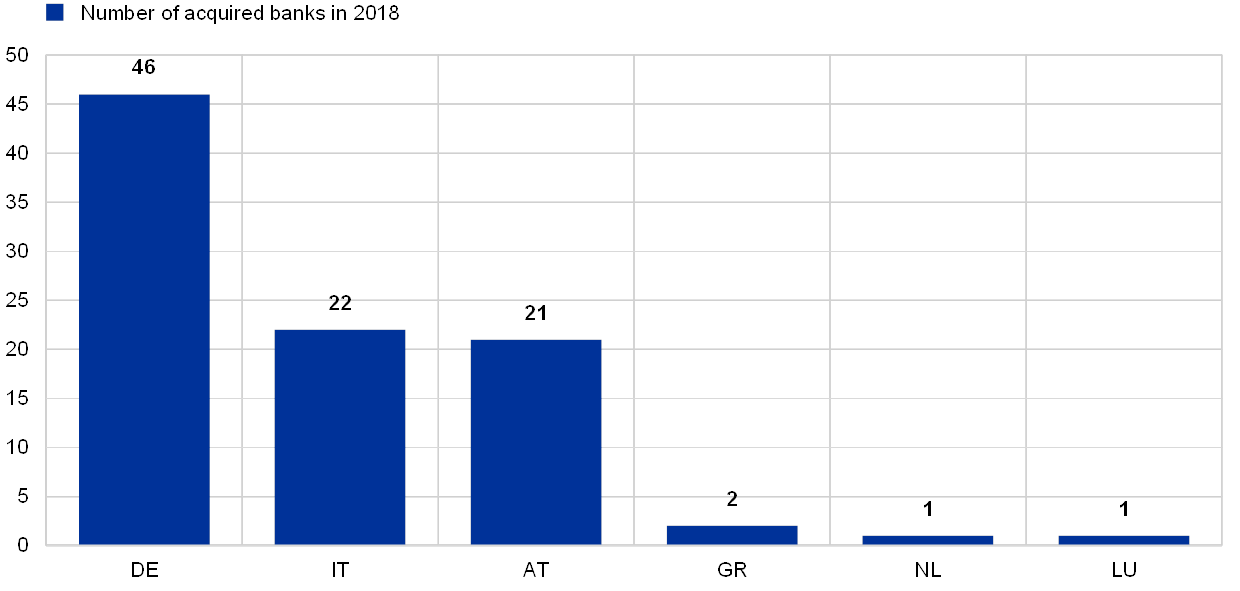
Source: ECB list of supervised entities.
Note: Figures for Italy covers the mergers carried out in 2018 excluding those related to the creation of the two SI sector.
Despite the reduction in the number of entities, total assets continued to grow in 2018 (+4%) (see Table 2), thus leading to an increase in the overall size of the LSI sector. Consequently, the average LSI size reached €2 billion at the end of 2018. This is an increase from around €1.5 billion in 2014.[9] The LSI sector nevertheless remains dominated by small banks with a median size of just €0.6 billion, representing an increase from €0.4 billion in 2014.
Chart 5
Total LSI sector assets and average LSI size
(EUR billions)
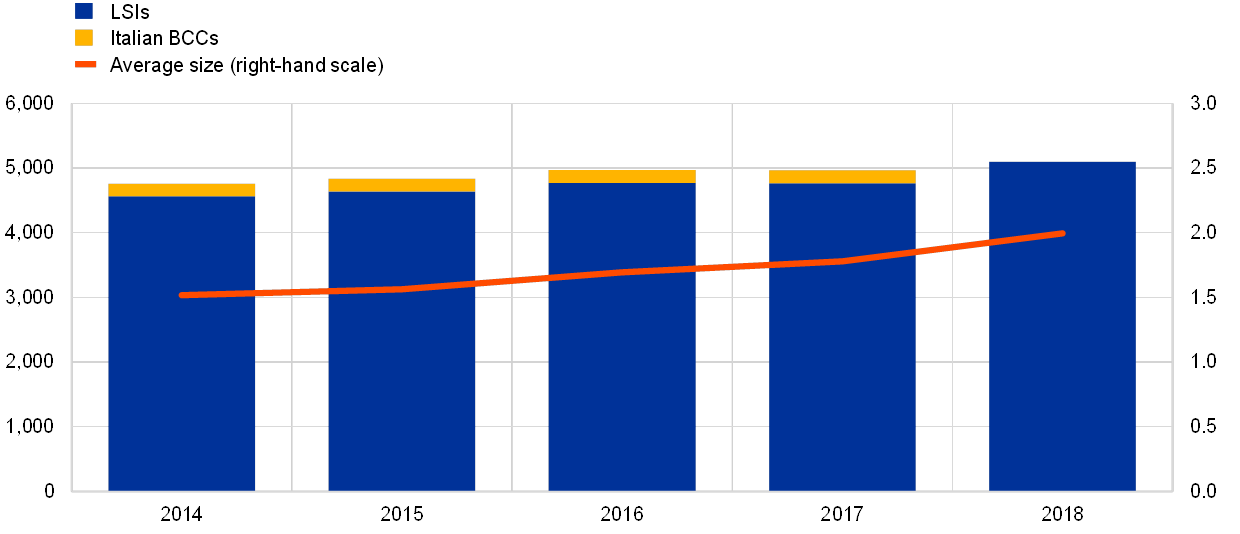
Sources: NCAs' and banks' reporting and ECB calculations.
Note: Including branches and FMIs.
Chart 6
Distribution of LSIs by size
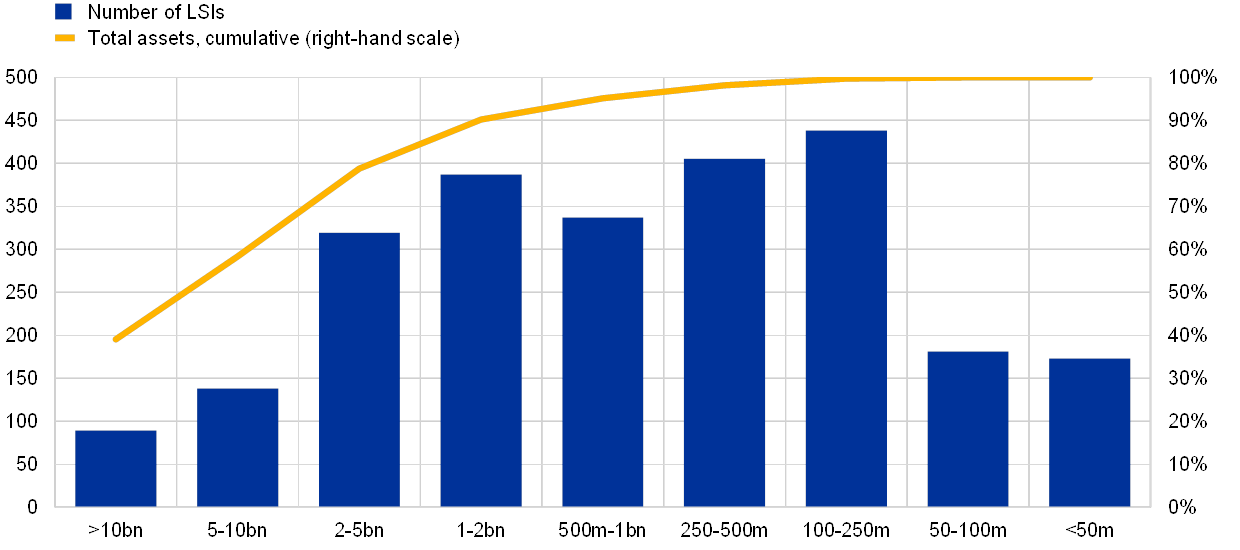
Sources: NCAs' and banks' reporting and ECB calculations.
Note: Including branches and FMIs.
Regarding balance sheet composition, the asset side still mainly consists of customer loans – primarily to retail customers and small and medium-sized enterprises (SMEs). Also, holdings of debt securities constitute a relevant and growing (by almost 4% during 2018) part of LSIs’ assets (see Table 2). Sovereign bonds are one of the prevailing asset classes listed on LSI balance sheets (see Box 1 for an overview of LSI exposure to sovereign counterparties). In 2018, loans and advances also increased by 4% at the consolidated level, totalling more than €3 trillion (see Table 2).
Table 2
Aggregated LSI balance sheet
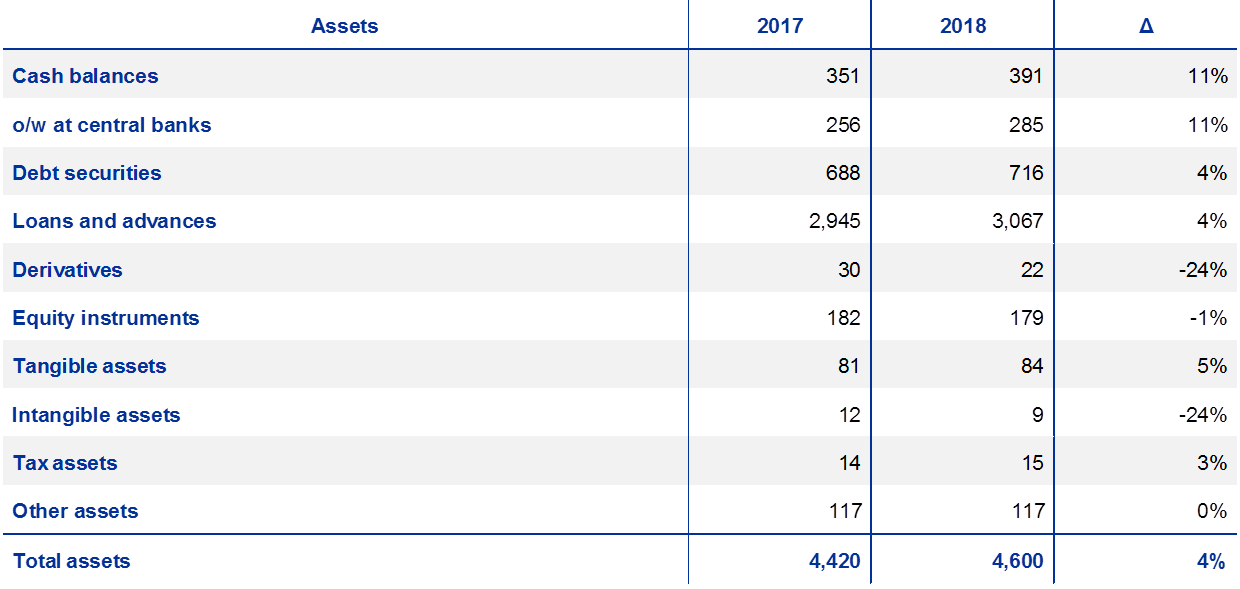
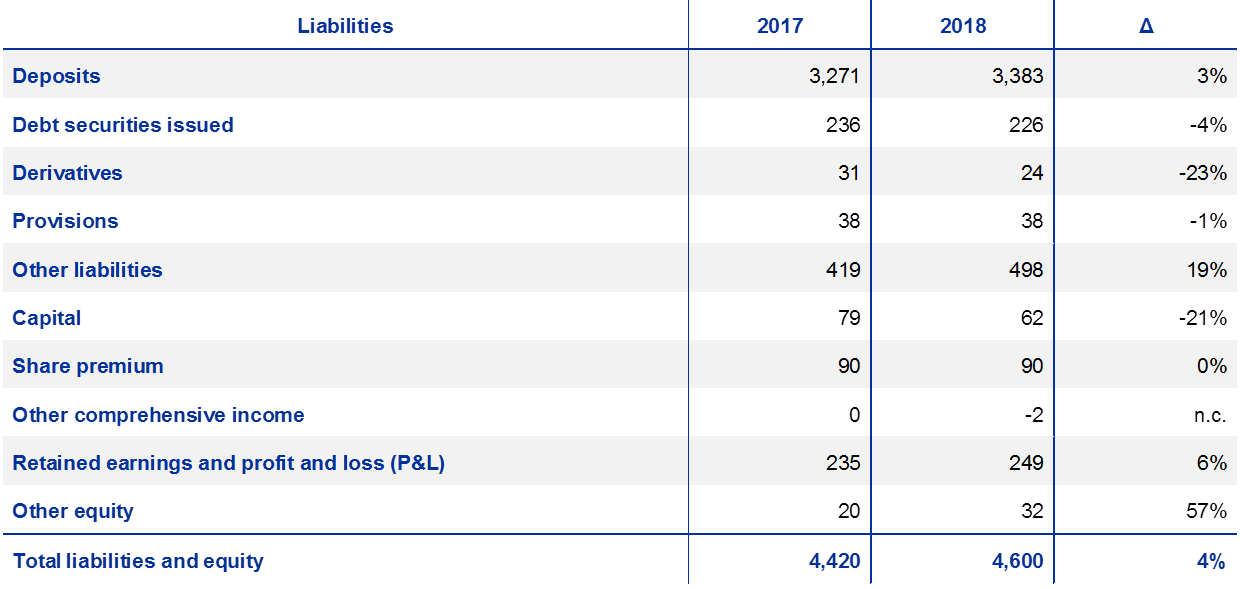
Sources: Banks' supervisory reporting and ECB calculations.
Notes: FMIs are included, while branches are excluded. Furthermore, data on assets for 2017 on “loans and advances” and on “other assets” have been reclassified following a change to reverse repo reporting that occurred in the course of 2018.
On the liability side, customer deposits represent by far the largest source of funding, while the issuance of debt securities as well as the trading of derivatives remains only of minor importance for LSIs. LSI equity is primarily composed of retained earnings and reserves, the latter are mainly due to German and Austrian institutions having an additional dedicated reserve bucket linked to end-of-year profits.
Most LSIs still follow the traditional business model (i.e. collection of deposits and granting of loans).[10] The LSI sector is dominated by retail banks and diversified banks (the latter have a higher percentage of exposures to corporate clients, including SMEs). These LSIs belong mainly to the cooperative and savings bank sectors. They are institutions that are typically focused on their connections to the territories that they operate in, and to their local customers. Furthermore, they typically minimise information asymmetries and have strong cultures of social engagement.
The LSI sector is mostly composed of retail and diversified banks (together they make up nearly 90% of all LSIs, representing around 65% of total LSI assets). The remainder of the LSI sector is markedly heterogeneous: a relatively large number of institutions are classified as asset managers (96) or corporate/wholesale lenders (70), while all remaining business models are spread across 120 banks.
Table 3
LSI business model classifications

Sources: Banks' supervisory reporting and ECB calculations.
Notes: Taken from data referring to the fourth quarter of 2018 – excluding branches and FMIs.
Box 1
LSI exposures to sovereign counterparties
In a context of declining exposures to the government sector (see Chart B), the LSI sector portfolios of sovereign exposures amounted to a total of €486 billion as of December 2018, representing approximately 10% of their total assets (versus 12.9% for SIs).However, some LSIs do have significantly higher shares of exposures to sovereign counterparties (see Chart A).[11] This is approximately 12.7% of the euro area banking sector’s total exposure to sovereign debt, with the remainder held by the much larger SI sector.
Chart A
Share of sovereign exposure over total assets
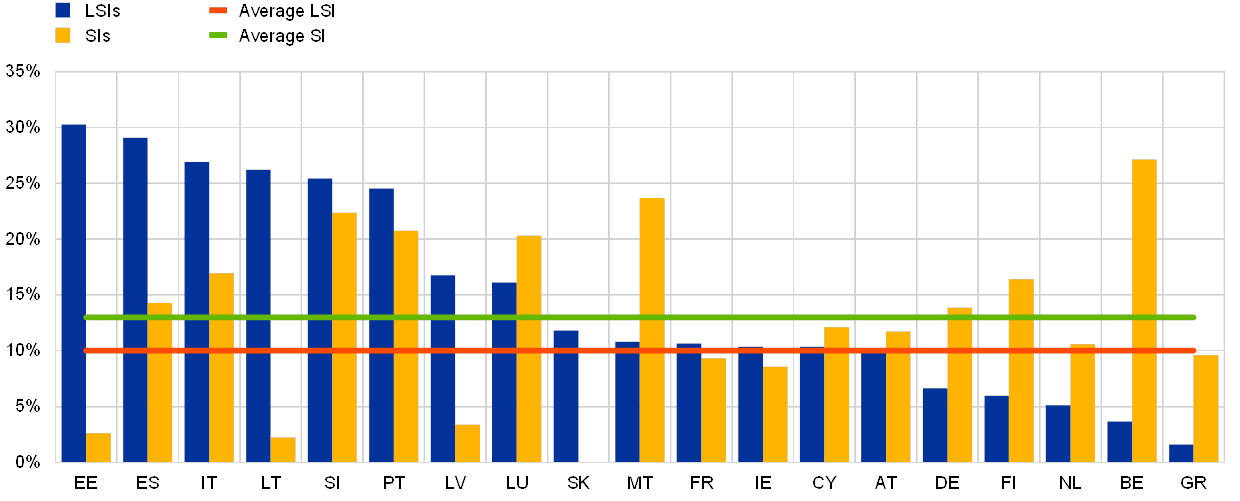
Sources: Banks' supervisory reporting and ECB calculations.
Note: Figures at the highest level of consolidation.
Chart B
Share of euro area MFI credit to general government over total assets
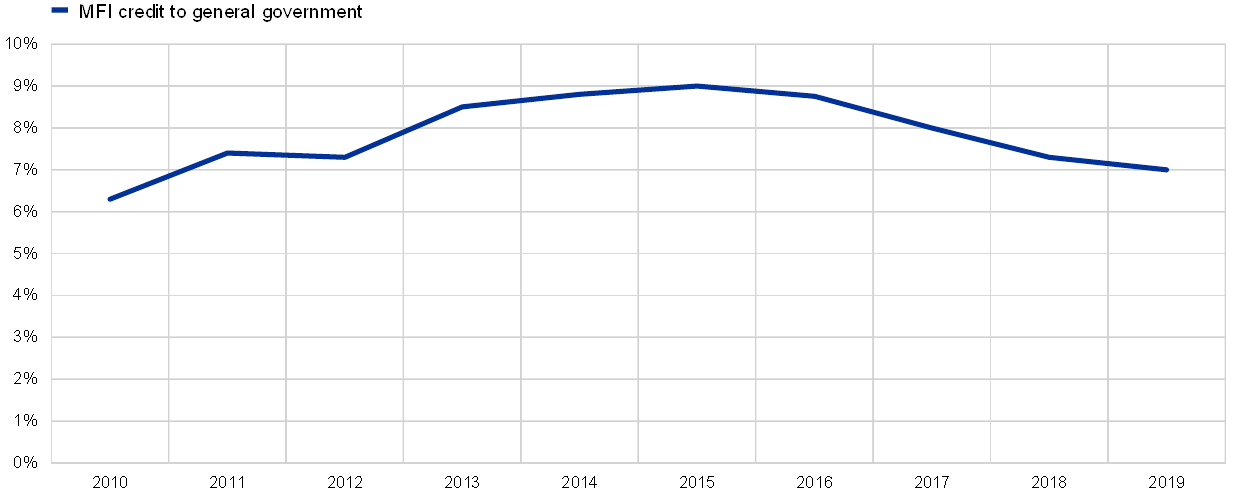
Source: MFI balance sheet statistics.
The vast majority of LSI exposures are to domestic sovereigns (79%), with only 14.2% to other euro area countries, and a negligible percentage to non-euro area counterparties. This contrasts with comparable SI data, which show that exposures to domestic sovereigns represent, on average, less than 50% of total SI exposures. In terms of accounting, 74.1% of the LSI sector total sovereign exposure is held at amortised cost (in contrast to 50.5% for SIs).[12]
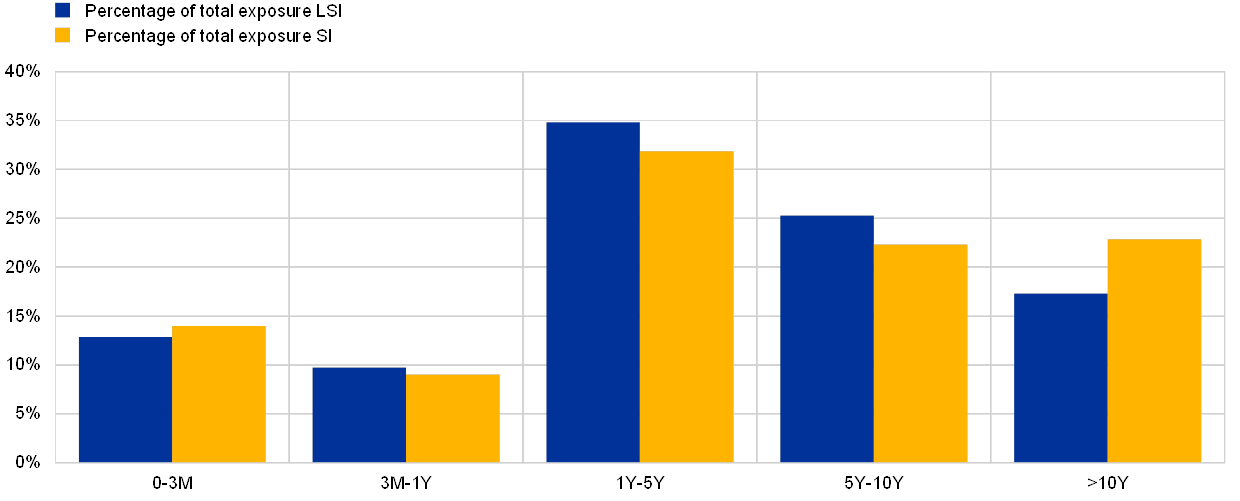
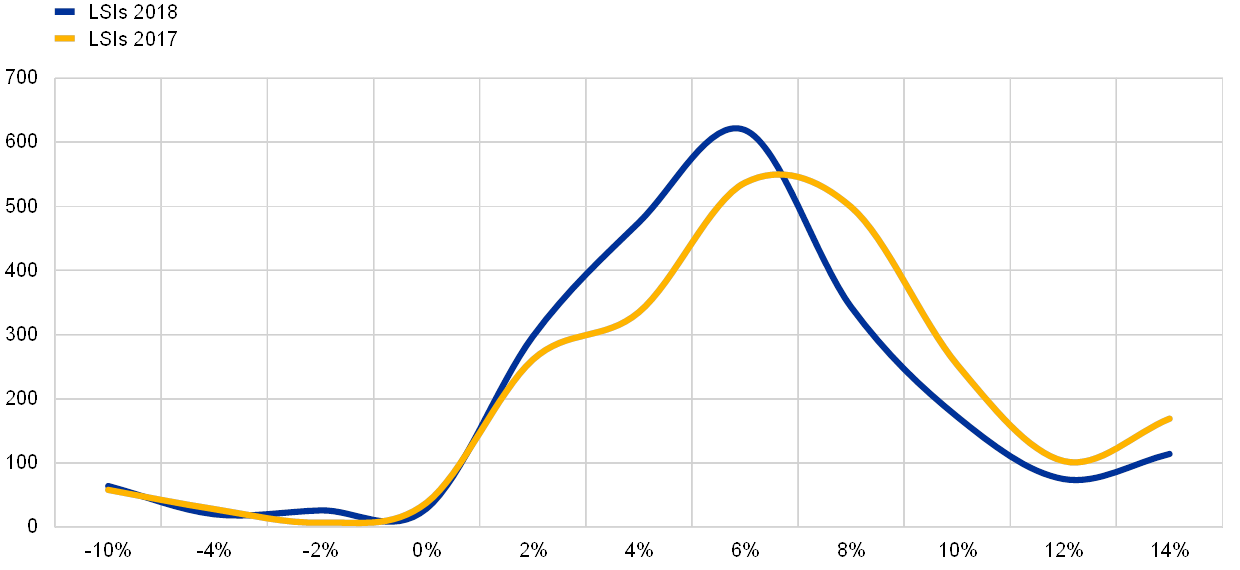
When analysing data on individual banks, 142 LSIs – accounting for 11.8% of LSI sector assets – have domestic sovereign exposures exceeding 20% of total exposures (see Chart C). Finally, in terms of maturities, LSIs seem to withhold their sovereign exposures for medium to long-term purposes, as nearly one-third of the sovereign exposures belong to the maturity buckets from one to five years, while one-quarter have a residual maturity exceeding ten years, which is slightly lower than comparable figures for SIs (see Chart D).[13]
Chart C
142 LSIs with domestic sovereign exposures above 20% of their total assets
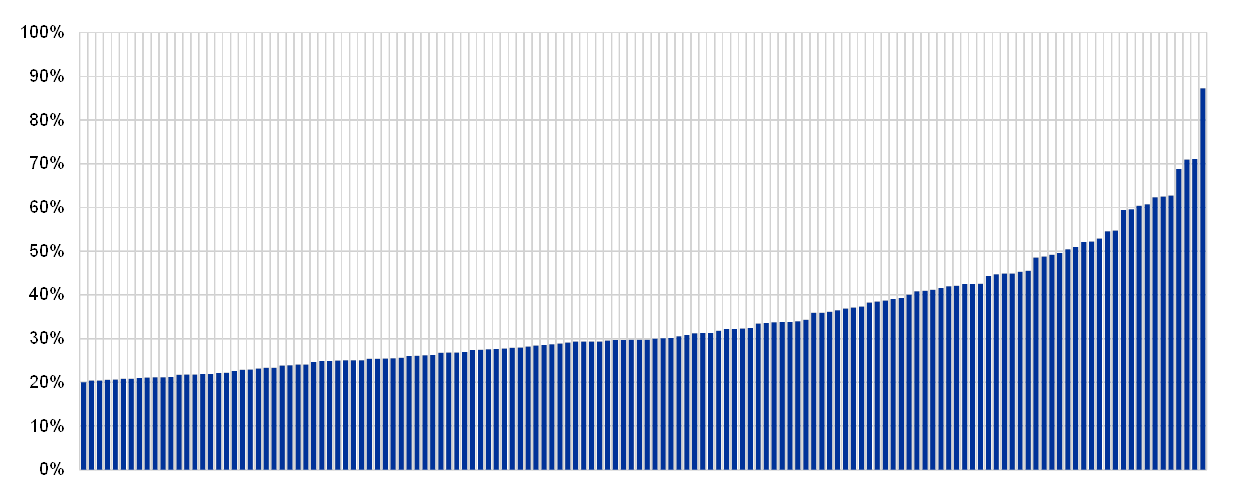
Sources: Banks' supervisory reporting and ECB calculations.
Note: The distribution presents the domestic sovereign exposures as a share of the total assets at bank level.
Chart D
LSI and SI sovereign exposure by residual maturity bucket
Sources: Banks' supervisory reporting and ECB calculations.
1.2 Drivers of business model risk and profitability
- The LSI sector continues to witness a persistent decline in profitability. In 2018 ROE stood at 4.7% against 5.8% in 2017 and below the 6.2% level of SIs.
- Core income components such as NII and NFCI remained stable on a year-on-year basis. A major downward effect on profitability came from financial market developments, namely asset derecognitions and revaluation of financial assets, which alone accounted for a decrease of over 80 basis points in ROE.
- A relatively minor positive contribution to ROE came from a decrease in loan loss provision, which further decreased by 50%.
- Business models explain an element of heterogeneity in LSI profitability, with average ROE ranging between around 2% and more than 10%.
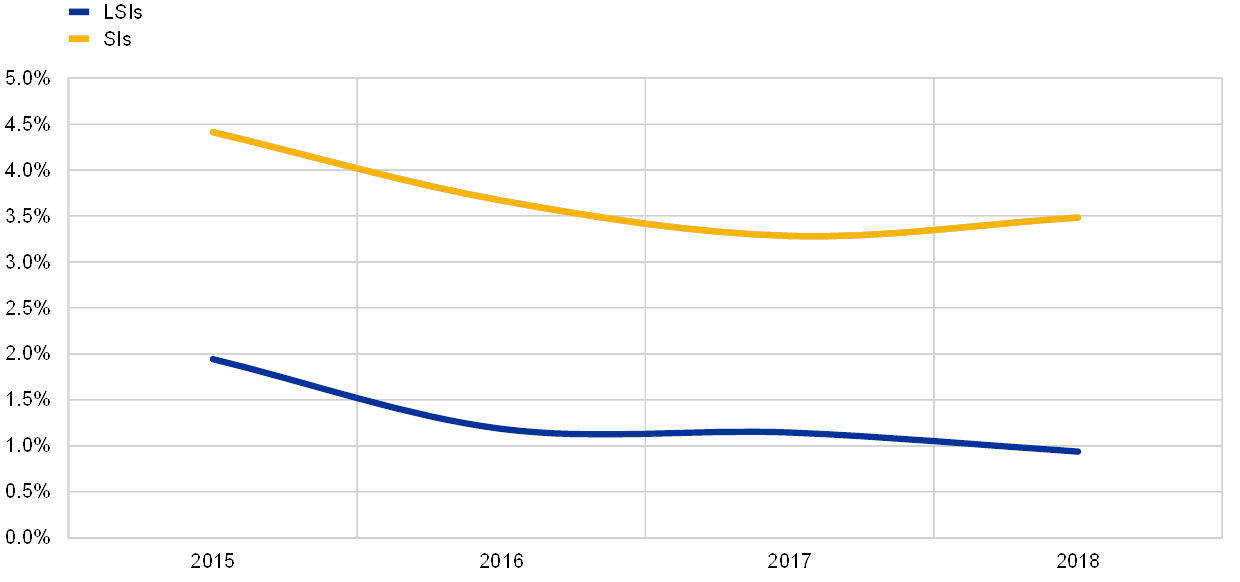
End-2018 figures highlight a decline in LSI profitability, confirming that business model risk and low profitability remain among the key vulnerabilities for the LSI sector. Between 2017 and 2018 the ROE fell by around 110 basis points, from 5.8% reported in 2017 to 4.7% in 2018.[14] Furthermore, LSIs still lag behind SIs, whose ROE stood at 6.2% in 2018 following a small increase compared to 2017 (see Chart 7). The low interest rate environment remains a constant concern for LSIs, as it is a drag on profitability, particularly for those banks more reliant on interest income. Some LSIs have already contemplated the prospect of passing negative rates on to customers, albeit the issue is considered controversial and its feasibility depends on several factors (e.g. customers' elasticity to rate changes, national legal frameworks, etc.). Furthermore, some LSIs face challenges in attracting new, young depositors and clients, while their core customer base is slowly shrinking. Moreover, some LSIs experience considerable difficulties in attracting and retaining younger staff with a deeper understanding of the needs of the younger clientele – this generates a vicious cycle that jeopardises profitability. The problem is even more acute in terms of IT staff, who can prove to be both scarce and costly to hire (particularly for smaller banks).
Chart 7
ROE for SIs and LSIs
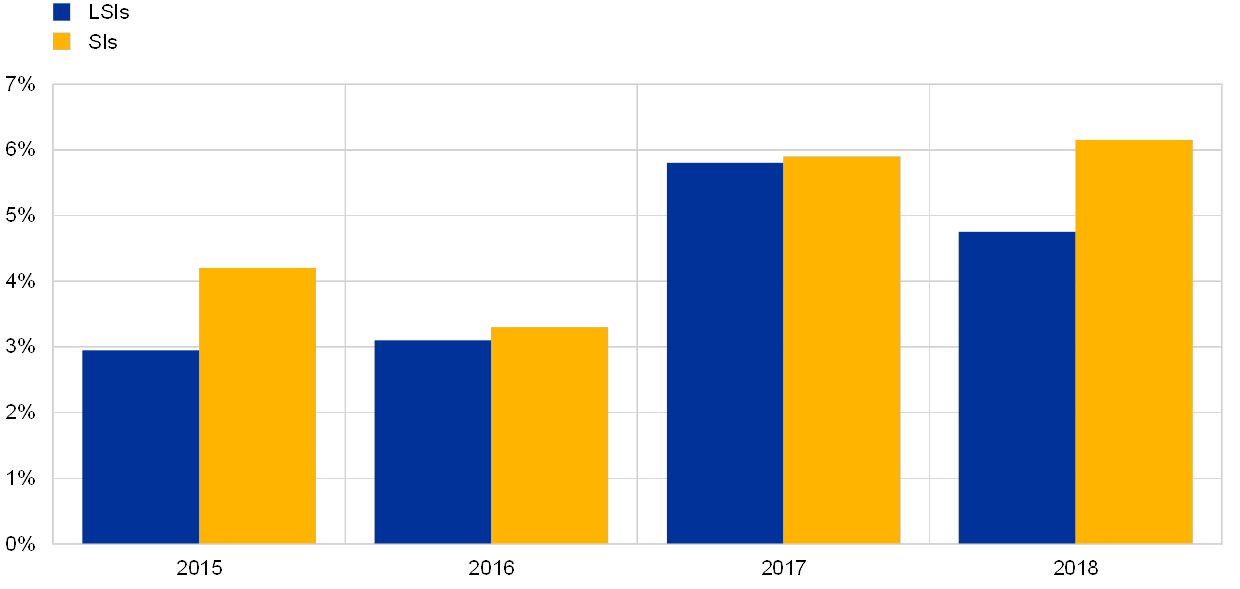
Sources: Banks' supervisory reporting and ECB calculations.
Chart 8
LSI ROE waterfall
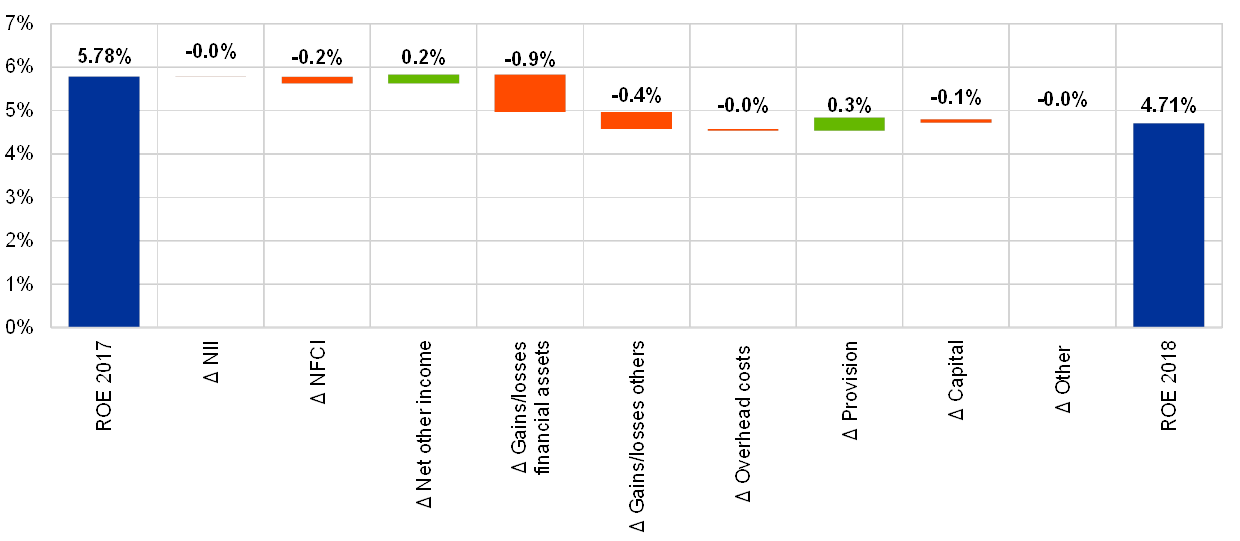
Sources: Banks' supervisory reporting and ECB calculations.
Notes: Variations as a share of LSI 2017 own funds. Changes in provisions include loan loss provisions as well as financial impairment.
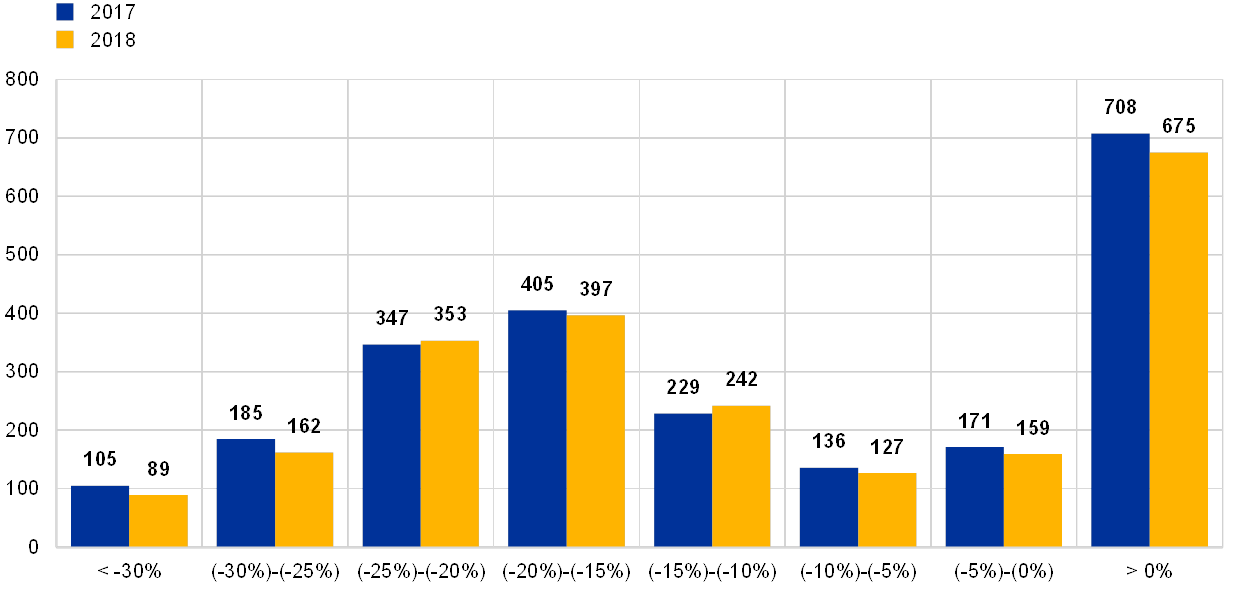
Over the course of 2018, the distribution of ROE by bank (see Chart 9) shifted slightly towards the negative side, indicating a general decrease in ROE across the whole LSI sector. Furthermore, a total of 436 LSIs reported ROE below 2%. While a significant number of LSIs are still reporting low or negative ROE, a total of 361 LSIs have ROE above 10%, indicating significant heterogeneity in the distribution of profitability. Sources of heterogeneity in profitability are further explored in Box 2, which examines different LSI performances through the lens of business model classification.
Chart 9
ROE distribution for LSIs
Sources: Banks' supervisory reporting and ECB calculations.
Box 2
LSI profitability by business model
A simple historical average of ROE by business model reveals huge divergences across the LSI sector (see Chart A), ranging between 2% (for investment banks and corporate/wholesale lenders) and more than 10% for institutions such as car financing banks, consumer credit institutions and custodians. It is possible to further understand the drivers of some of these divergences by leveraging on the ROE decomposition approach described in the EBA Methodological Guide on risk indicators and risk analysis tools.[15]
Chart A
LSI ROE by business model for the period from 2015 to 2018
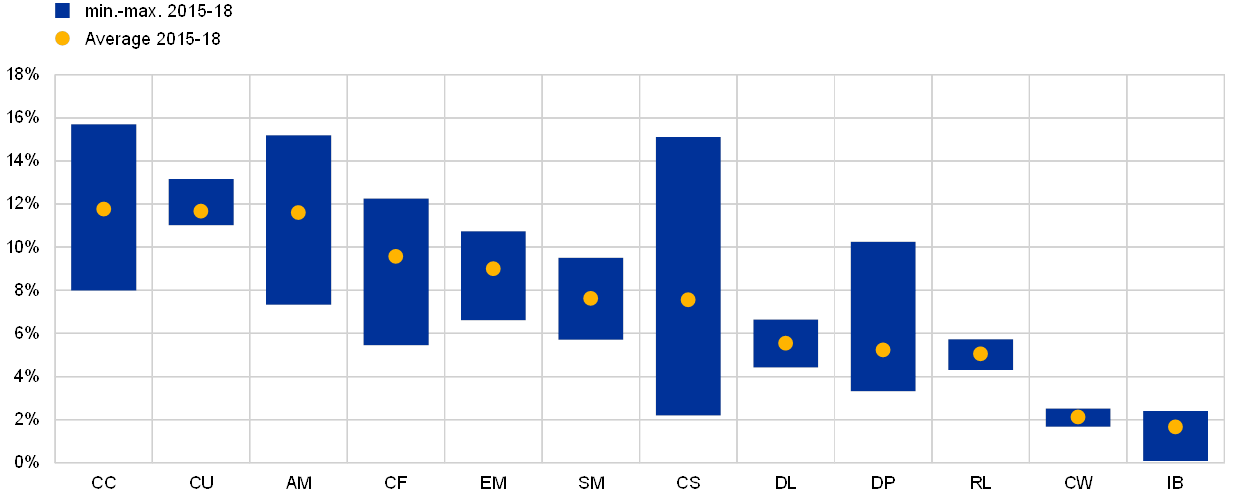
Source: ECB calculations.
Notes: Average of yearly ROE (by business model group) for the period from 2015 to 2018. For a full definition of all business models, see Annex II.
Following this approach, which is similar to the DuPont analysis, it is possible to break down the ROE into five subcomponents:
ROE = Asset profitability * Operating CE * Risk CE * Non-operative items impact * Leverage (1)
Where:
Asset profitability = Operating income/Total assets (2)
Operating cost efficiency = Operating profits/Operating income (3)
Risk cost efficiency = Net operating profits/Operating profits (4)
Non-operative items impact = Net profits/Net operating profits (5)
Leverage = Total assets/Equity (6)
Accordingly, asset profitability (2) considers the impact of operating income over total assets, operating cost efficiency (3) adds the impact of costs and risk cost efficiency (4), and also incorporates provisions. Adding the impact of all non-operative items (5) enables the numerator of (4) to net profits to be simplified. The final ratio is therefore exclusively the bank’s leverage.
On the basis of the ROE decomposition, the assets’ profitability (i.e. the ratio of operating income over total assets) of consumer credit lenders and car financing banks is by far the highest, with values of 8.2% and 6.2% respectively, which is more than twice as high as most other banks (see Table A). This is due to the specificities of their business activities, characterised by higher margins but also a higher level of credit risk. On the other side of the spectrum, retail and diversified lenders are among the least profitable, with assets' profitability trending down to around 2.4%, squeezed by compressing margins and competition.
Table A
LSI profitability by business model
(Averages 2015‑18)
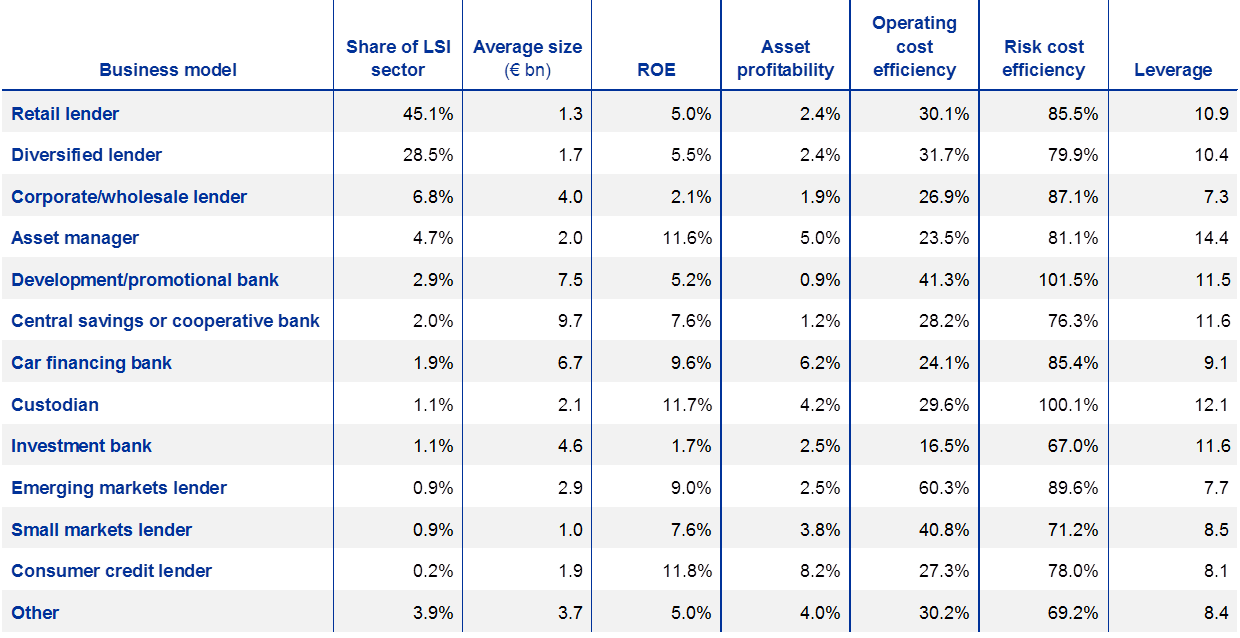
Source: FinRep.
Notes: For operating cost efficiency, risk cost efficiency and non-operating cost efficiency, a ratio close to 100% implies a higher level of efficiency. Leverage is measured as total assets over total equity.
Operating cost efficiency, measured as the ratio between operating profits and operating income, incorporates the effect of overhead costs into the profitability indicator; the higher the ratio, the more efficient the bank. The business model perspective reveals heterogeneity across LSIs, with values for this indicator ranging between slightly more than 16% and over 60%. Retail and diversified lenders fall somewhere in between, at around 30%. Emerging market lenders, on the other hand, show the highest level of operating cost efficiency, at 60.3%, making them among the most profitable LSIs.
An important factor for ROE is bank leverage, with high levels of leverage pushing up this ratio. Asset managers and custodians are the most leveraged institutions in the LSI sector. They are also among the most profitable in terms of ROE (11.6% and 11.7% respectively), however, with higher leverage being a strong driver. Despite this, LSIs classified as investment banks – in total nine institutions – have reported the lowest average ROE over the past four years despite being among the most leveraged of all LSIs.
Core income components such as NII and NFCI remained stable on a year-on-year basis. However, this stability conceals some weaknesses, mainly related to the composition of NII. The overall increase in loan volumes – on average around 4% a year since 2015 at the consolidated level (see Section 1.3) – did not lead to an increase in interest income. On the contrary, NII could only be sustained by further cuts to interest expenses, which were already at their lowest level ever recorded for the LSI sector (see Chart 10). Furthermore, continued pressure on interest margins led to a further shrinkage of gross interest income.
Chart 10
Developments in interest income and expenses in LSIs
(EUR billions)
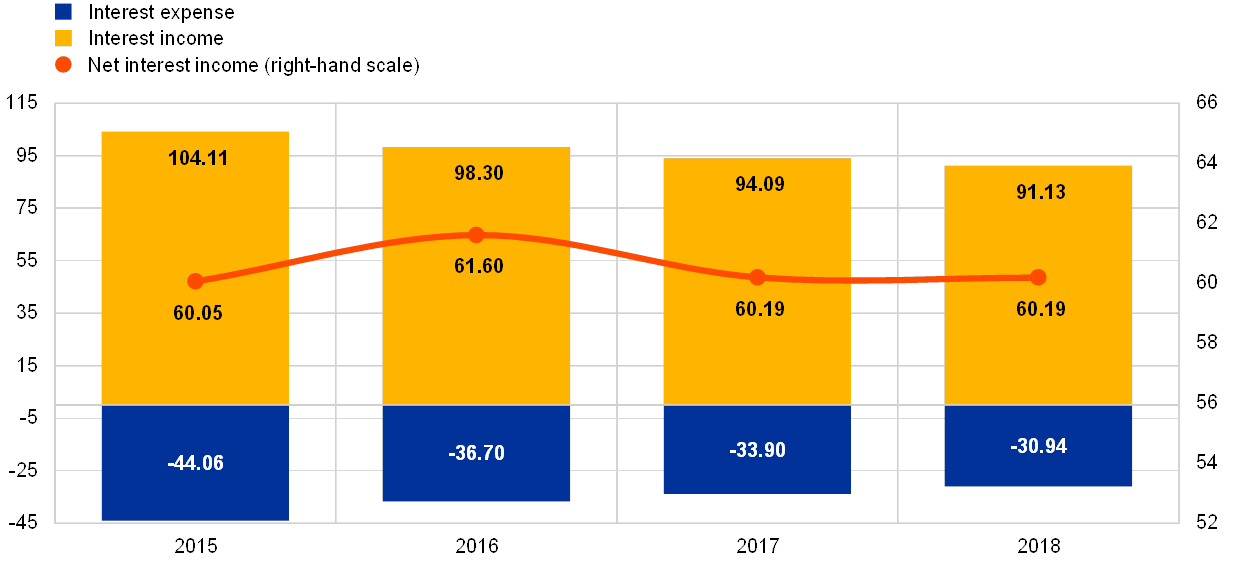
Sources: Banks' supervisory reporting and ECB calculations.
Table 4
Aggregated P&L in the LSI sector
(EUR millions)
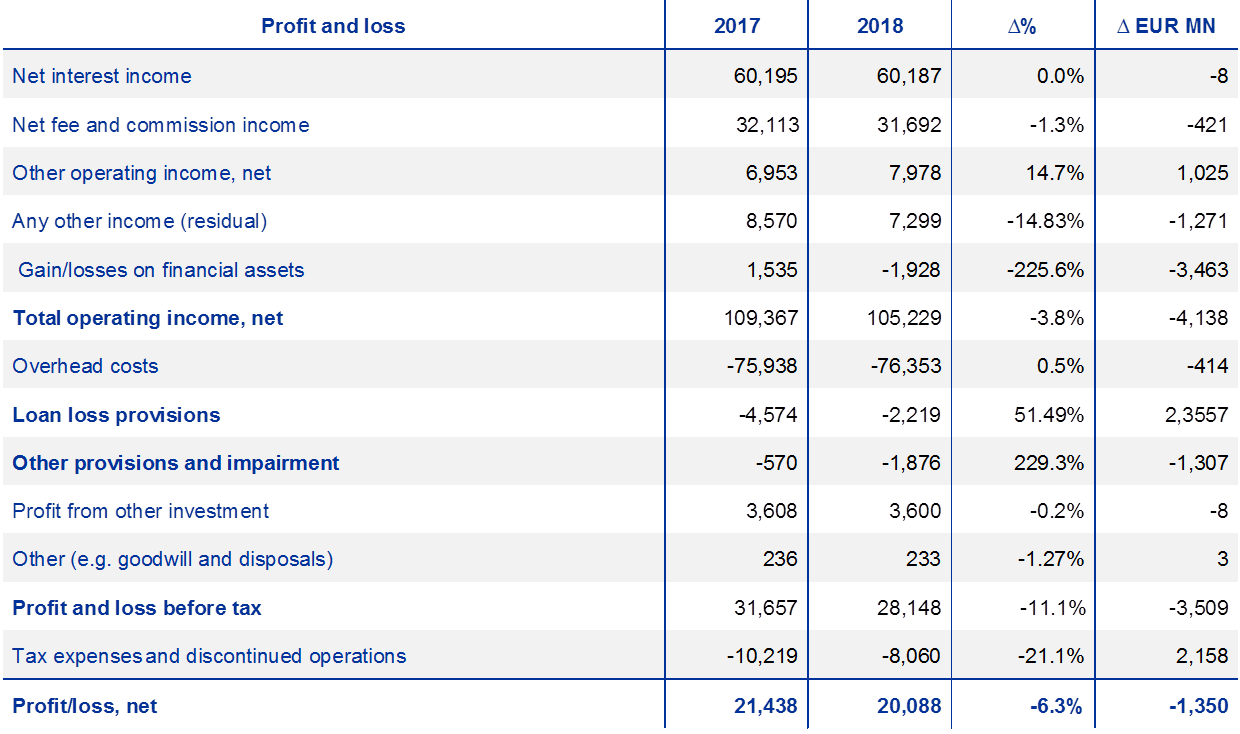
Sources: Banks' supervisory reporting and ECB calculations.
Note: FMIs are included, while branches are excluded.
As far as NFCI is concerned, the continued growth observed in the years 2015, 2016 and 2017 came to a halt in 2018; nevertheless, a greater number of LSIs reported higher NFCIs compared to the previous year. However, fees income dropped significantly in 2018 at those LSIs that most rely on it. Notably, investment banks experienced a 46% aggregate decrease in NFCI year-on-year (see Table 5). Retail and diversified lenders, on the other hand, reported a 2.5% increase in NFCI compared to 2017. This is in line with the current strategy of “shifting to fees”. NFCI at SIs increased by 3.5% year-on-year in 2018, registering a positive trend for the fourth consecutive year.
Table 5
NFCI by business model
(EUR millions)
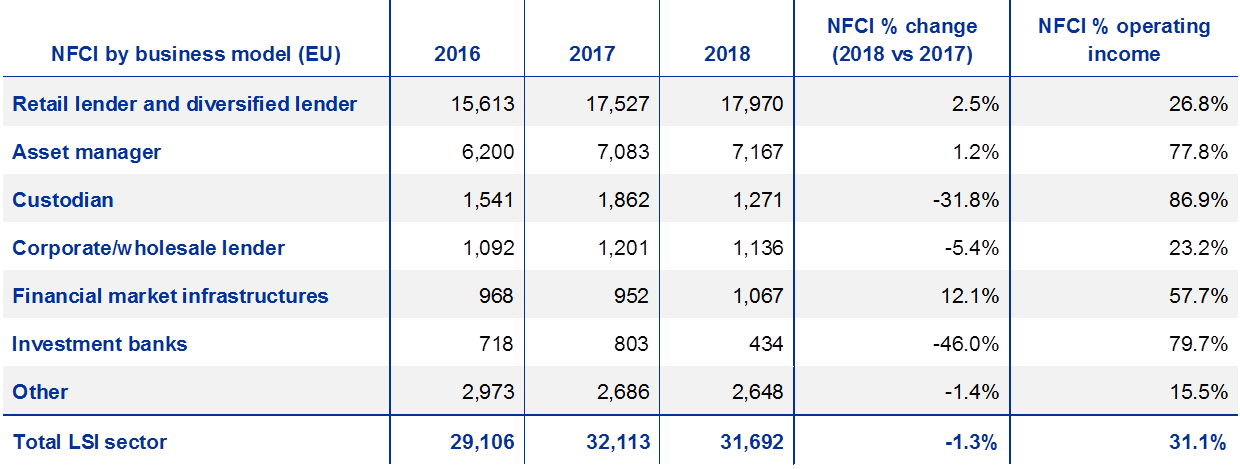
Sources: Banks' supervisory reporting and ECB calculations.
Notes: The decrease in NFCI at custodian banks is partially driven by one institution that left the LSI sector in 2018.
In 2018, alongside stagnating core income results, LSI revenues suffered losses on financial assets. In particular, Spanish and German LSIs have seen the most significant reduction in net profit from financial assets. This major downward effect on profitability came from financial market developments, namely asset derecognitions and the revaluation of financial assets, which alone accounted for a decrease of approximately 80 to 90 basis points in ROE.
On the cost side, LSIs find it difficult to reduce operating expenses (e.g. by avoiding the closure of branches) for fear of losing customers and market share. Notwithstanding, LSIs managed to limit administrative expenses, which increased only slightly with respect to previous years (+0.4% in 2018 against an annual average increase of around 3% over the period 2015‑17 – see Chart 11). By analysing the breakdown of overhead expenses (see Chart 12), staff costs have been relatively constant in recent years, whereas administrative expenses and depreciation costs have steadily increased since 2015.
Chart 11
Gains/losses from financial assets at LSIs and SIs
(EUR millions)
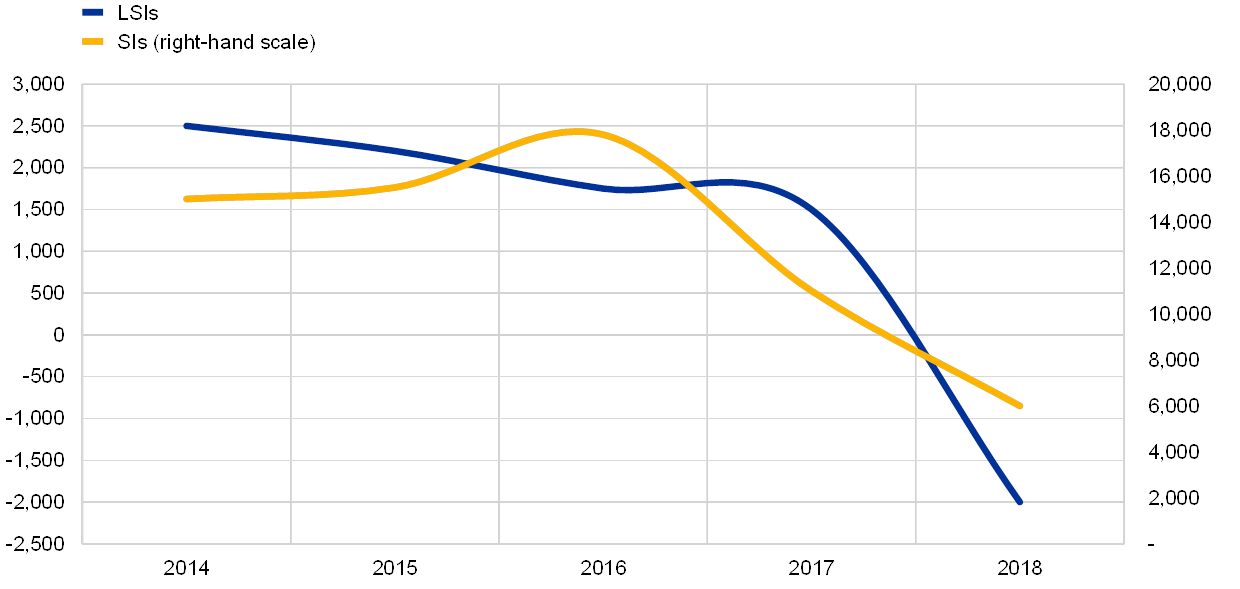
Sources: Banks' supervisory reporting and ECB calculations.
Chart 12
Breakdown of overhead costs at LSIs
(EUR billions)

Sources: Banks' supervisory reporting and ECB calculations.
Developments on both the costs and the revenues sides have led to an increase in LSI cost/income ratio to the highest value since European banking supervision started (73.1% in 2018) – this is significantly above the comparable value for SIs (66%), which has also slightly increased from 64.3% since 2017. Furthermore, the cost/income ratio of LSIs still exhibits strong heterogeneity across countries, with values ranging from around 50% to more than 80%. Additionally, nearly all banks in the LSI sector witnessed a deterioration in this ratio in the course of 2018 (see Chart 14), with some 600 banks now having a cost/income ratio of around 80% or more (up from 465 at the end of 2017).
Chart 13
Developments in the cost/income ratio for LSIs and SIs
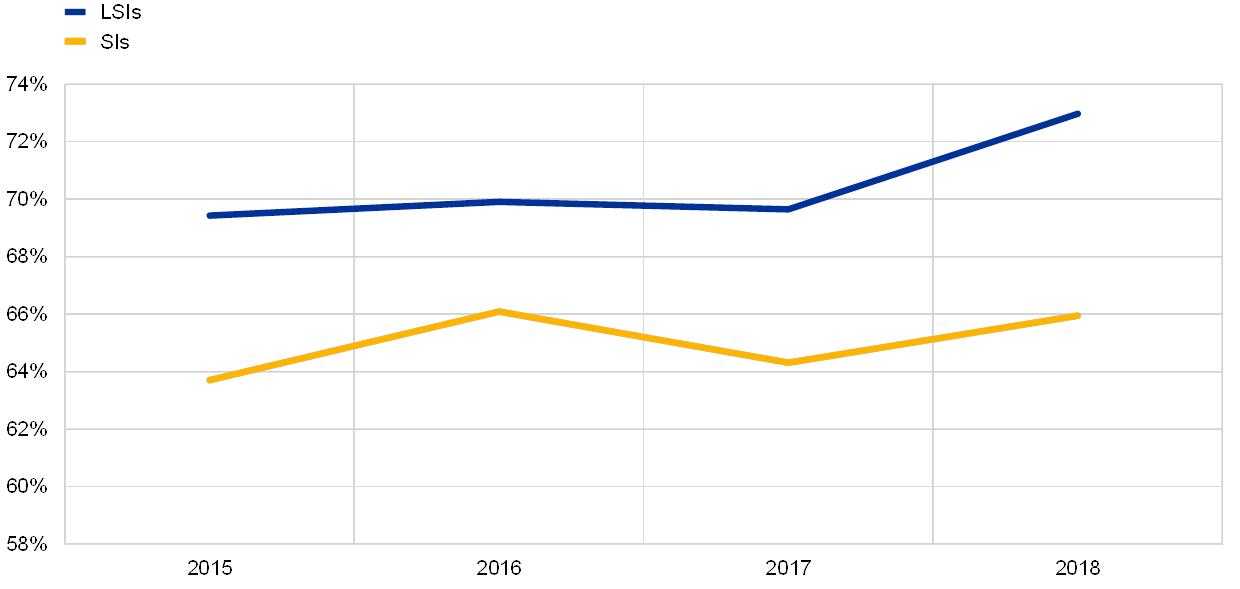
Sources: Banks' supervisory reporting and ECB calculations.
Chart 14
Distribution of the cost/income ratio by LSI
Sources: Banks' supervisory reporting and ECB calculations.
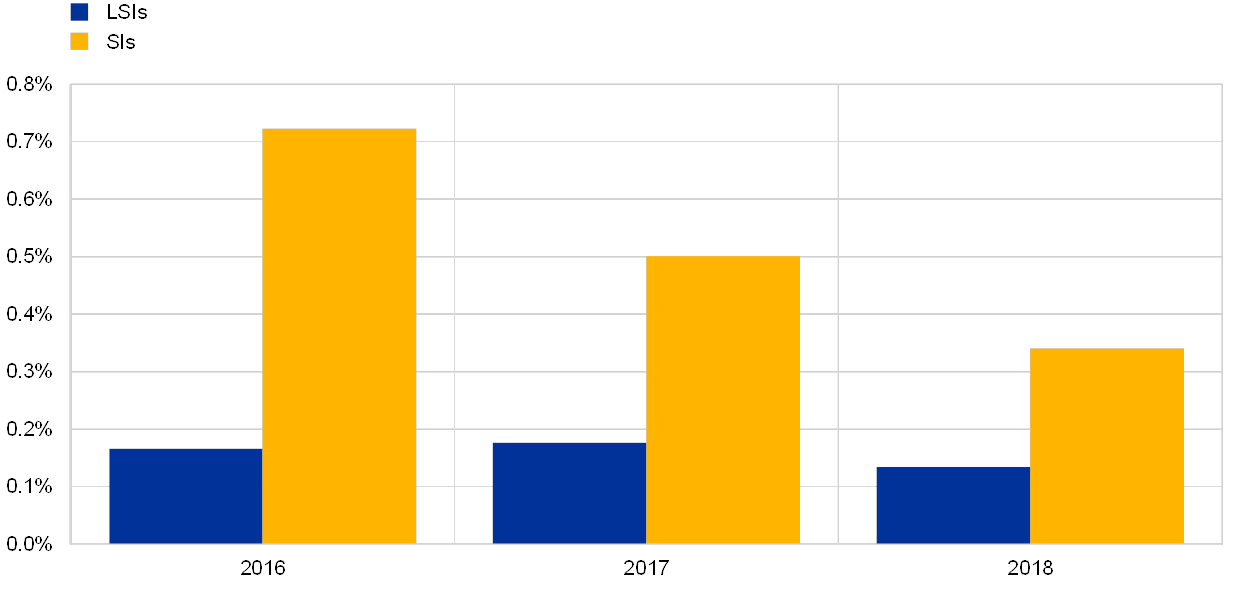
Impairments remain another important driver of LSI profitability. During 2018 LSIs set aside 35% fewer provisions (relative to the total stock of loans) to face potential loan losses than they did in 2017 (see Chart 15). Such a low level of provision casts doubt on the sustainability and the reliability of banks’ credit risk projections, and leaves little room for future improvements, as the economic recovery is still slow-paced.
Chart 15
Developments in loan loss provisions as a share of loan stock between 2016 and 2018
Sources: Banks' supervisory reporting and ECB calculations.
Chart 16
Flow of loan loss provisions as a share of loan stock in 2018
Sources: Banks' supervisory reporting and ECB calculations.
Analysis of LSI profitability indicates that core income components (i.e. NII and NFCI) at LSIs remained broadly stable throughout 2018 – the increasing volume of loans has helped to offset the reduced margin on profits that banks make per unit of loan. However, analysis also shows that non-core income took a toll on bank profitability during 2018, the most relevant being negative financial market developments which put further pressure on already ailing LSI profitability.
1.3 Credit risk
- LSIs continue to show solid credit growth thus close monitoring of underwriting standards is warranted.
- NPL ratios show an overall declining trend, but a substantial number of LSIs still exhibit high stocks of NPLs.
- LSI NPL coverage ratios decreased slightly in 2018 compared to 2017, remaining lower than the NPL coverage ratios of SIs.
Credit risk and risks related to profitability and business models have, for several years, been a key risk area for the LSI sector. Until recently supervisory attention has been mainly focused on the stock of NPLs, whereas now developments in credit growth have started to warrant some supervisory monitoring. Developments in LSI loan portfolios highlight relatively robust credit growth at aggregate level: total LSI loans to the private sector increased by over 4% in 2018 compared to the previous year, reaching €3 trillion in December 2018.
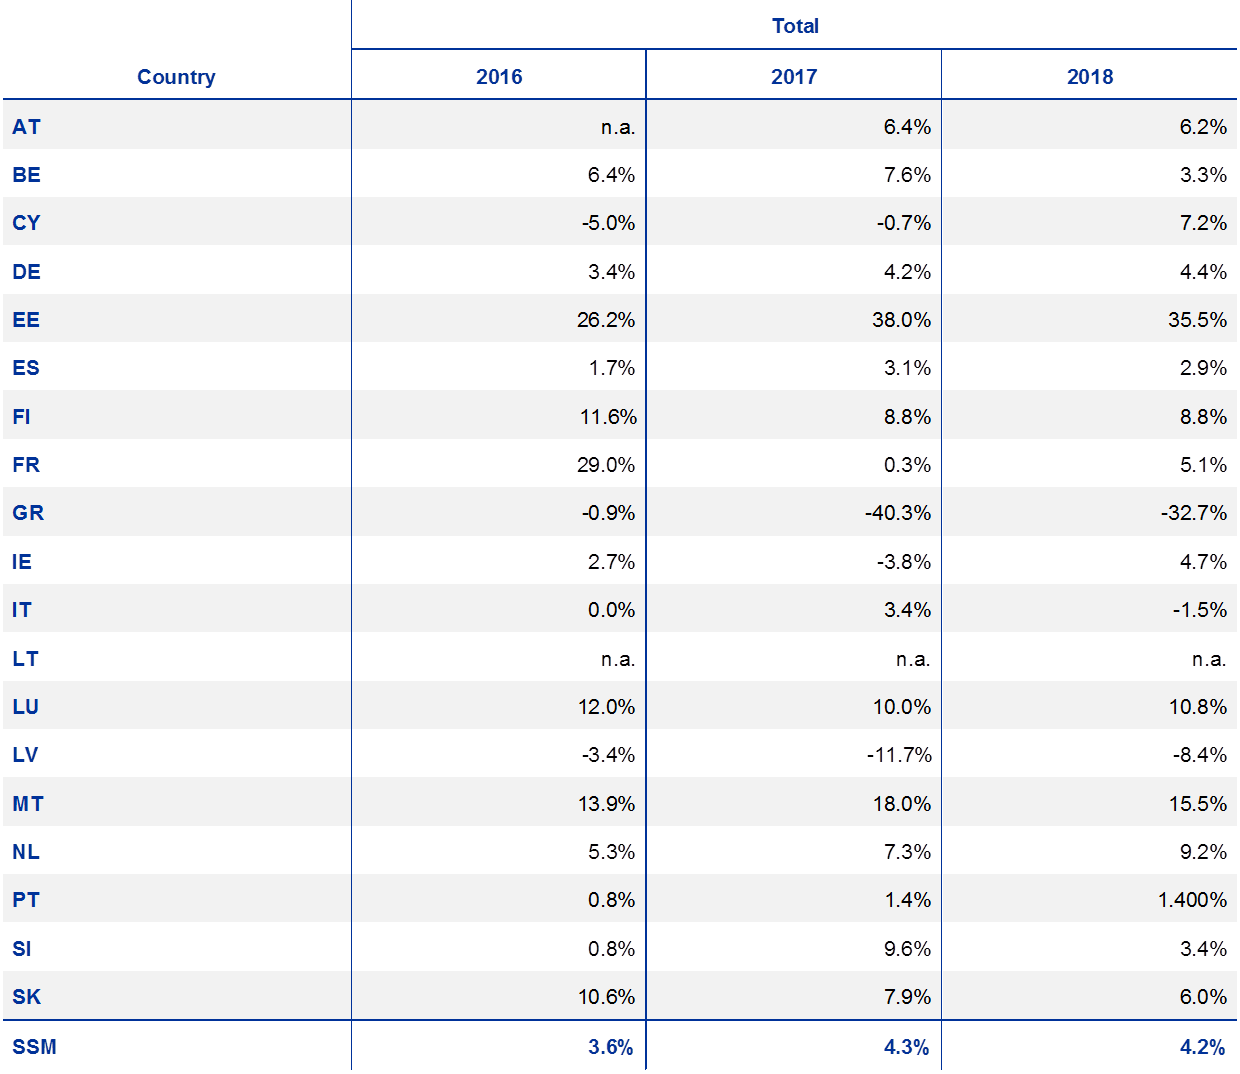
Table 6 shows the evolution of yearly changes in aggregate loans to the private sector based on solo level data for the period 2016‑2018. Growth in LSI lending volumes was primarily driven by the residential real estate and non-financial corporation (NFC) loan portfolios.
Table 6
LSI sector loans to the private sector across countries
(year-on-year percentage change)
Source: Individual MFI balance sheet statistics.
Notes: Data for LSIs at solo level. LSI coverage varies across countries and does not always represent the entire LSI sector. Growth rates computed adjusting for the effects of reclassifications and revaluations.
The solid credit growth displayed by the LSI sector over the last three years raised some concerns regarding a potential excessive loosening of underwriting standards; this triggered a dedicated thematic review on the matter for the LSI sector, which is in line with similar actions taken for SIs (see Box 3).
Box 3
Thematic review of LSI credit underwriting standards
Credit underwriting standards have been identified as one of European banking supervision's priorities for the years 2019 and 2020. This follows efforts to reduce the level of NPLs in the European banking system. The key concern from the supervisory perspective is that search-for-yield behaviour by banks, if not properly matched with robust risk management practices, could lead to a new wave of NPLs in the European banking system. Quantitative metrics obtained from data sources available to the ECB show robust lending growth in the LSI sector overall – reaching double-digit rates in a number of countries and portfolios. Moreover, banks themselves report slight, but continuous easing of lending standards. In line with those observations, a stocktake conducted among NCAs showed increased supervisory focus on LSI lending standards (including lending surveys, deep dives, and targeted on-site inspections).
However, detailed and reliable data on LSI lending standards is not readily available to the ECB due to several factors, such as low coverage of LSIs within the available data sources, short time series and data quality issues. Further analysis is needed to determine whether the credit expansion observed in some markets is predominantly driven by loosening lending standards or by benign macroeconomic conditions. A dedicated project, including an ad-hoc data collection, was launched in early 2019 to conduct a thorough assessment of whether LSIs under the remit of European banking supervision are loosening credit underwriting standards, because this could signal an elevated risk of future NPLs and warrant pre-emptive supervisory measures.
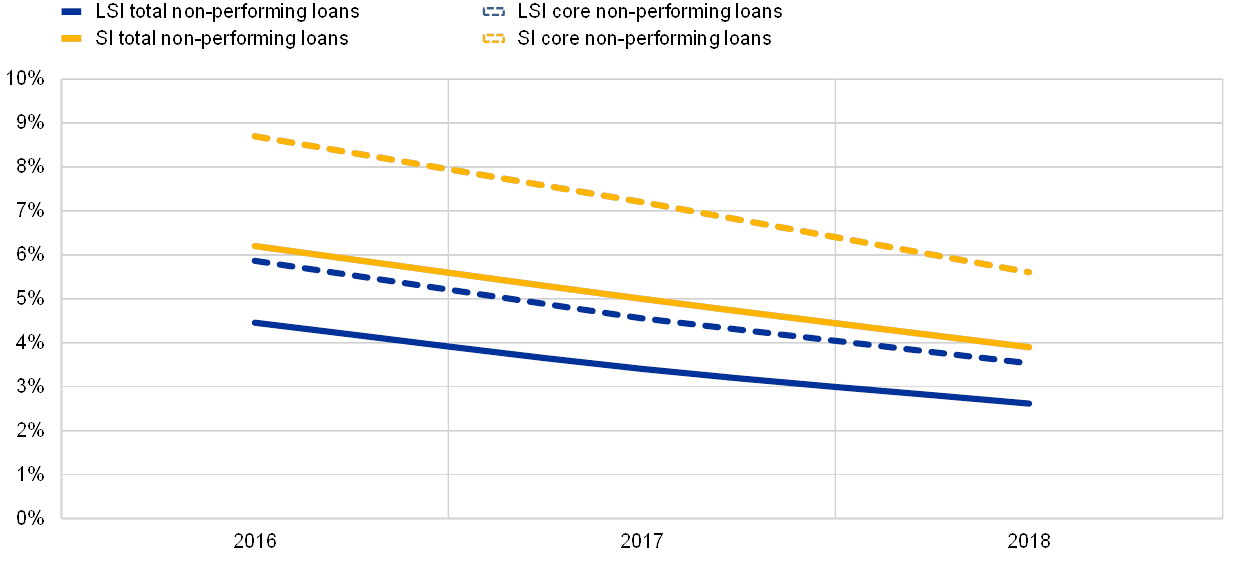
The latest NPL developments confirm the declining tendency observed since 2016 (Chart 17). The average NPL ratio for the LSI sector dropped from 4.4% in 2016 to 2.7% in 2018. The same evidence holds true for core NPL ratio, which considers only loans to households and NFCs; it dropped to 3.6% in 2018 versus 5.9% in 2016).
The reduction of the core NPL ratio was mainly driven by a reduction in the stock of NPLs on LSI balance sheets (down by 22.4% in 2018 to a total of €78.6 billion).
Chart 17
NPL ratios for LSIs and SIs
Sources: Banks' supervisory reporting and ECB calculations.
Despite this declining trend, NPLs still represent an area of vulnerability for the LSI sector. Nearly 300 LSIs (representing around 11% of total LSI assets) reported an NPL ratio of above 5%, which is the threshold set in the EBA guidelines on management of non-performing and forborne exposures (see Table 7).[16]
Table 7
Share of the LSI sector with an NPL ratio above 5% (by country)
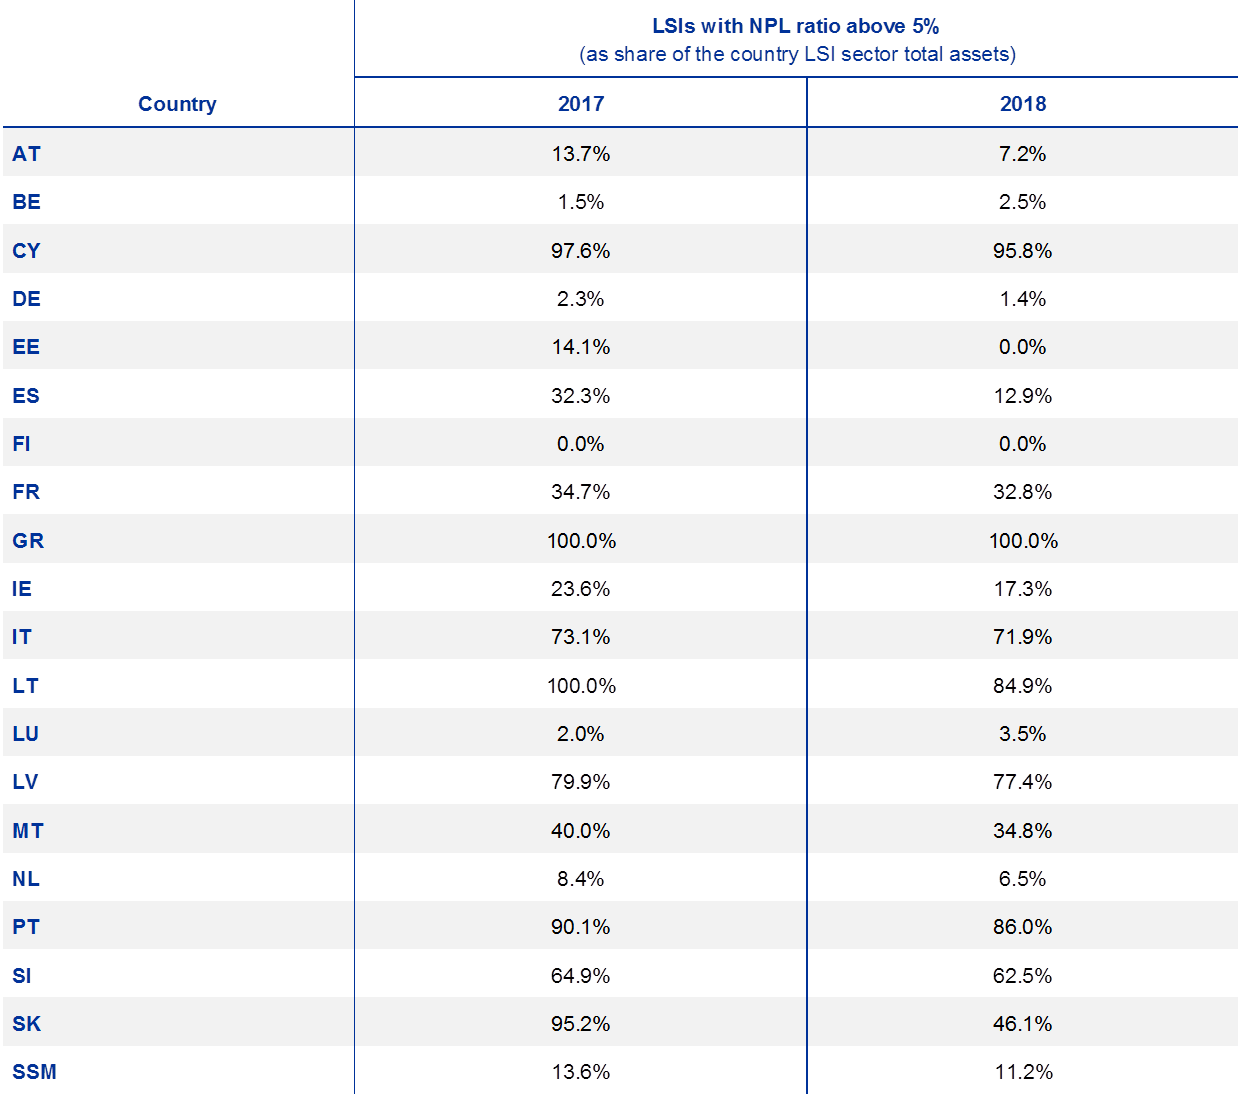
Sources: Banks' supervisory reporting and ECB calculations.
Note: 2017 and 2018 data for Italy excludes the BCCs that joined the two SI groups in 2019.
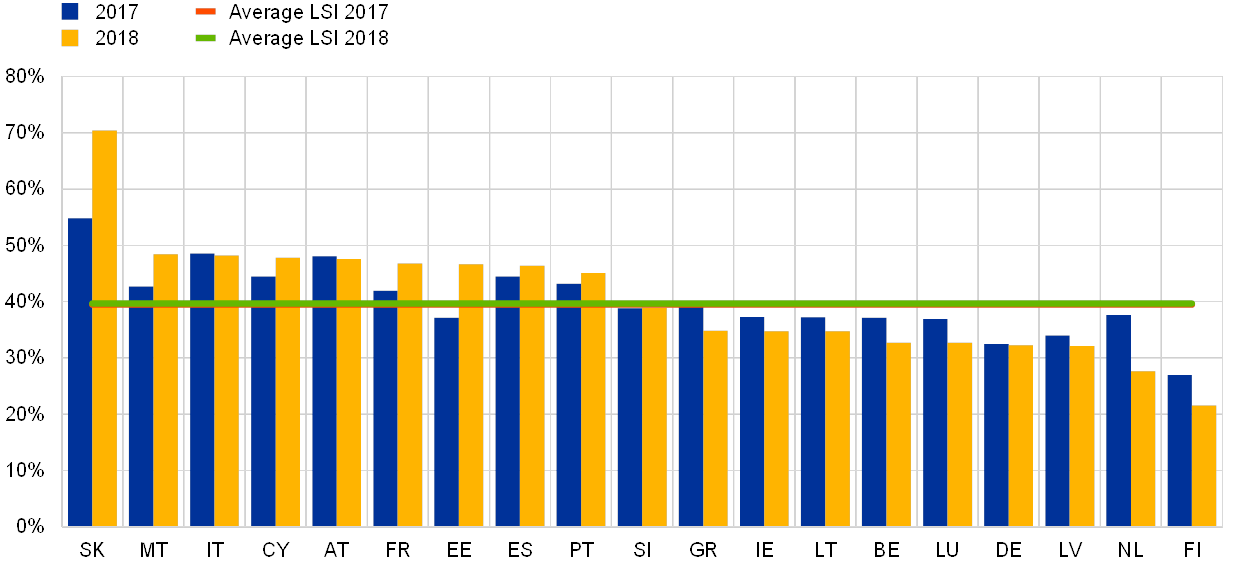
Looking at the evolution of coverage ratios, i.e. the ratio between loan loss provisions and the stock of NPLs, the average figure for the LSI sector decreased slightly in 2018 to just above 40%. Meanwhile, the corresponding ratio for SIs increased to around 47% (Chart 18).
Chart 18
Comparison of coverage ratios between countries
Sources: Banks' supervisory reporting and ECB calculations.
In addition to provisions, it is important to also consider the coverage of NPL stock in terms of capital (as measured by the “Texas ratio”, which considers both provisions and capital). This is key for assessing a bank’s ability to reduce its NPL stock. In 2018, 35 LSIs displayed a Texas ratio above 100%; these institutions are characterised by a below average CET1 ratio (around 10%) and an average ROE of -5% in 2018.
Chart 19
LSIs with NPL ratios above 5% and Texas ratios above 100%.
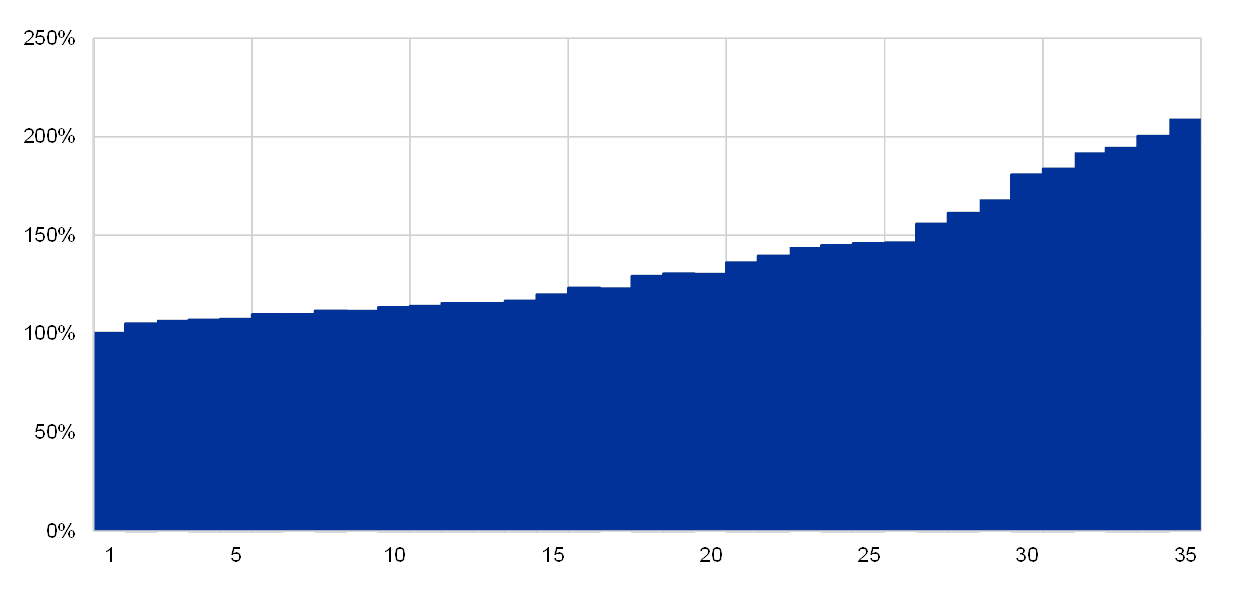
Sources: Banks' supervisory reporting and ECB calculations.
Note: Texas ratio computed as the ratio between total NPLs over the sum of total own funds and loan loss provisions as of December 2018.
1.4 Liquidity and funding risk
- The liquidity position of LSIs remains solid, with banks in the sector showing, on average, ample liquidity buffers.
- Despite the positive situation overall, increasing maturity mismatches between assets and liabilities could represent a source of vulnerability going forward.
The liquidity position of LSIs remains solid overall, with banks still positively benefiting from ample market liquidity coupled with the ECB's accommodative monetary policy. Based on standard metrics, such as the loan-to-deposits ratio (LDR) or the LCR, the LSI sector as a whole shows ample liquidity buffers. However, some pockets of vulnerability remain – these mainly originate from stretched maturity transformation and higher reliance on central bank funding.
At the end of 2018, the LDR was stable at around 90% (see Chart 20). At consolidated level, an expansion of around 4% in the lending book was almost completely offset by the increase of customer deposits. The LDR of LSIs remains well below that of the SI sector (which in 2018 is at around 117%); this difference mainly stems from the fact that SIs have access to a more diversified array of funding sources (for example interbank lending as well as issuance of securities).
Furthermore, the LCR indicates a comfortable liquidity position for LSIs at aggregate level, with the end‑2018 LSI sector average rising by 3% to 212% – this is significantly above the minimum regulatory requirement of 100% (see Chart 20). This increase was driven by a 5.8% growth in high quality liquid assets year-on-year – with several countries showing double-digit increases.
Chart 20
Development over time of the LDR and of the LCR at LSIs and SIs
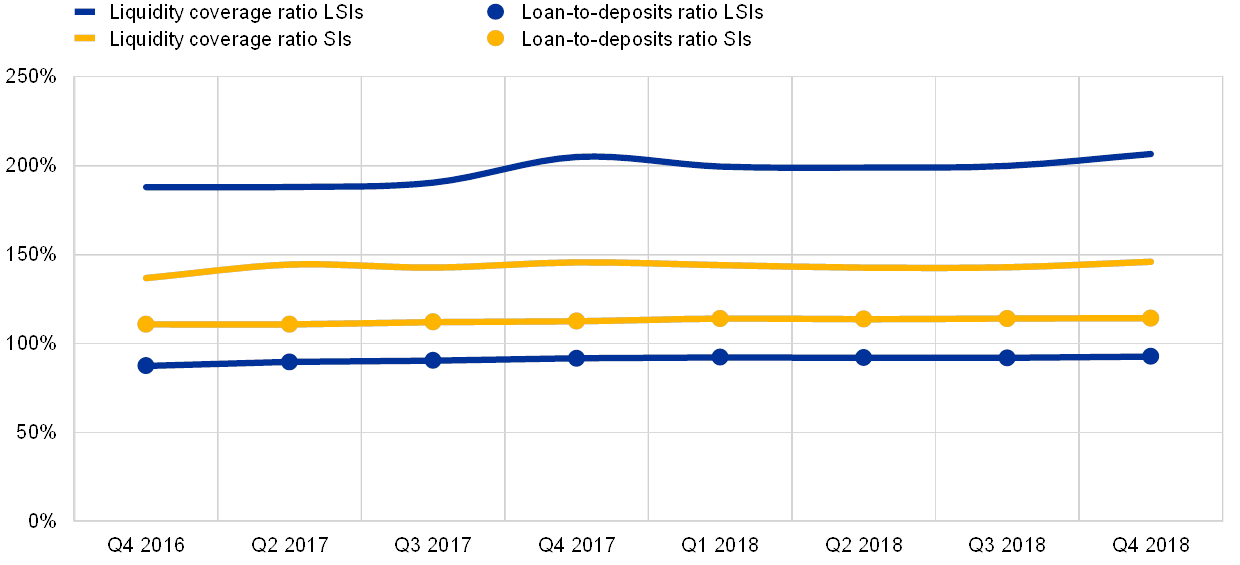
Sources: Banks' supervisory reporting and ECB calculations.
A deeper look at the distribution of the LCR across the banking sector shows that most institutions exceed the minimum regulatory requirement of 100% (see Chart 21). This minimum requirement entered into force as of 1 January 2019 after a three-year phasing-in period (in 2018 the LCR minimum requirement was 80%).
Chart 21
Distribution of LCR in 2018 across LSIs
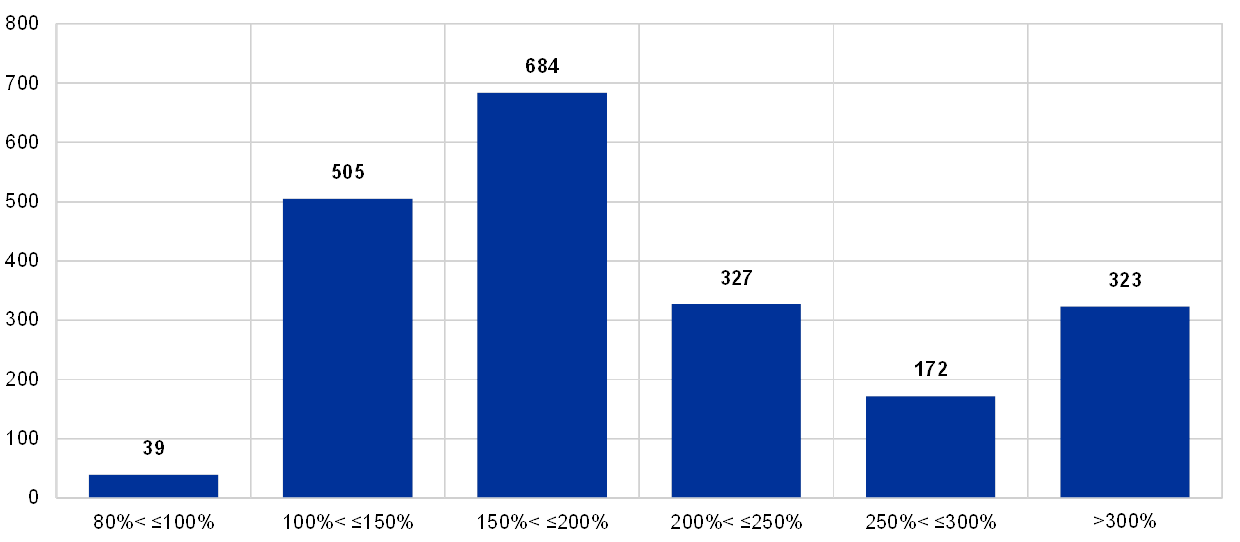
Sources: Banks' supervisory reporting and ECB calculations.
Note: The distribution excludes institutions that present an LCR greater than 300%.
Overall, retail deposits remain a main source of funding of LSIs, making up for 67.7% of total funding on average (-1.5% year-on-year), against 36.9% for SIs. LSIs in Ireland and Luxembourg represent an exception to this pattern, due to the presence of specific business models (for example, specialised lenders, custodians, investment banks, etc.), which make LSI funding sources more diversified in those countries. Moreover, 14% of total LSI funding comes from the top three counterparties – this figure is slightly higher than the equivalent for SIs (Chart 23).
Chart 22
Share of retail funding over total
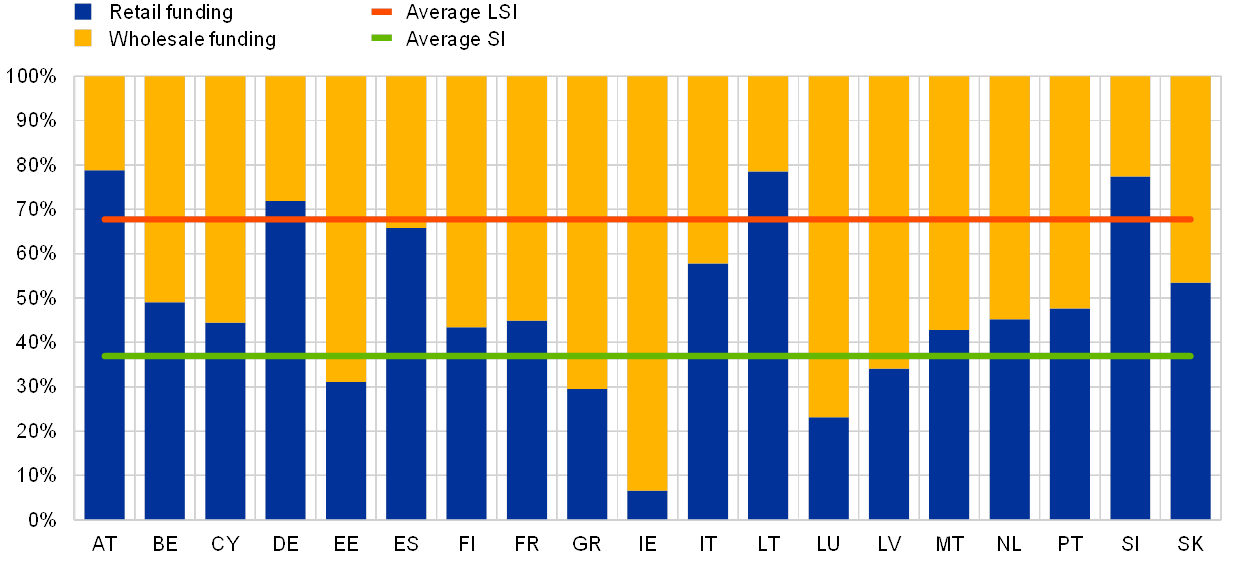
Sources: Banks' supervisory reporting and ECB calculations.
Note: Wholesale funding incorporates all non-retail funding sources.
Chart 23
Top three funding over total
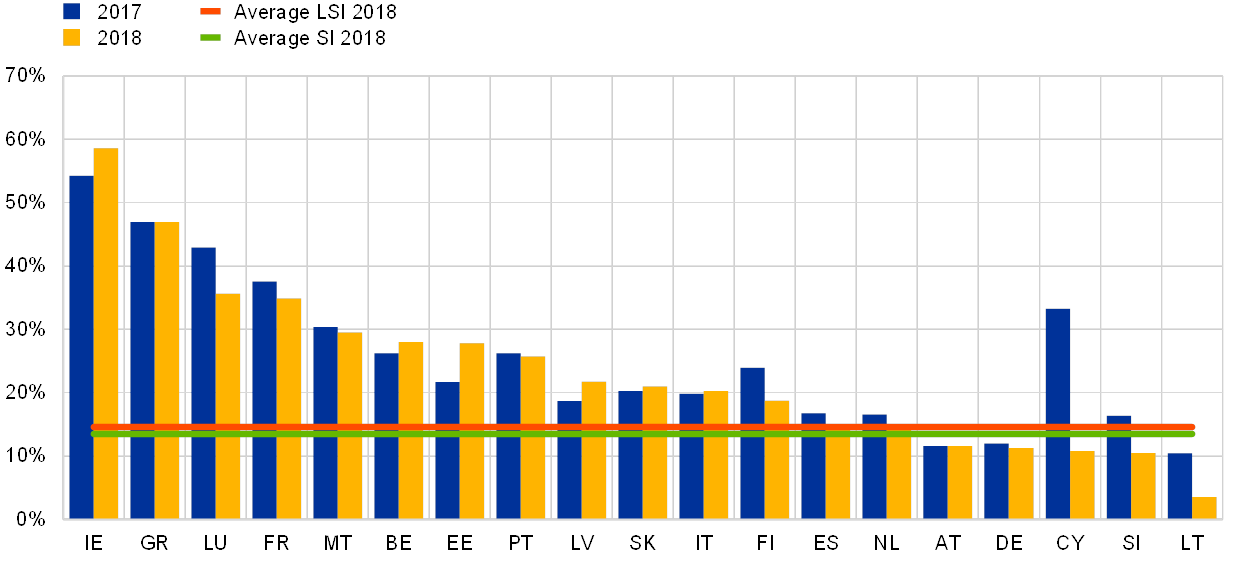
Sources: Banks' supervisory reporting and ECB calculations.
Thanks to newly reported supervisory data on contractual outflows and inflows by maturity buckets, it is now possible to derive a proxy for the contractual maturity profile of the LSI sector and gauge the evolution of LSI maturity gaps (see Chart 24). The data show that LSIs tend to have slightly longer contractual maturity of assets than SIs; this is seen as a response to shrinking interest margins whereby an increase in the maturity mismatch between assets and liabilities represent an immediate way to sustain profitability for LSIs.
Chart 24
Contractual maturity profile of assets and liabilities at LSIs and SIs during 2018
(year)
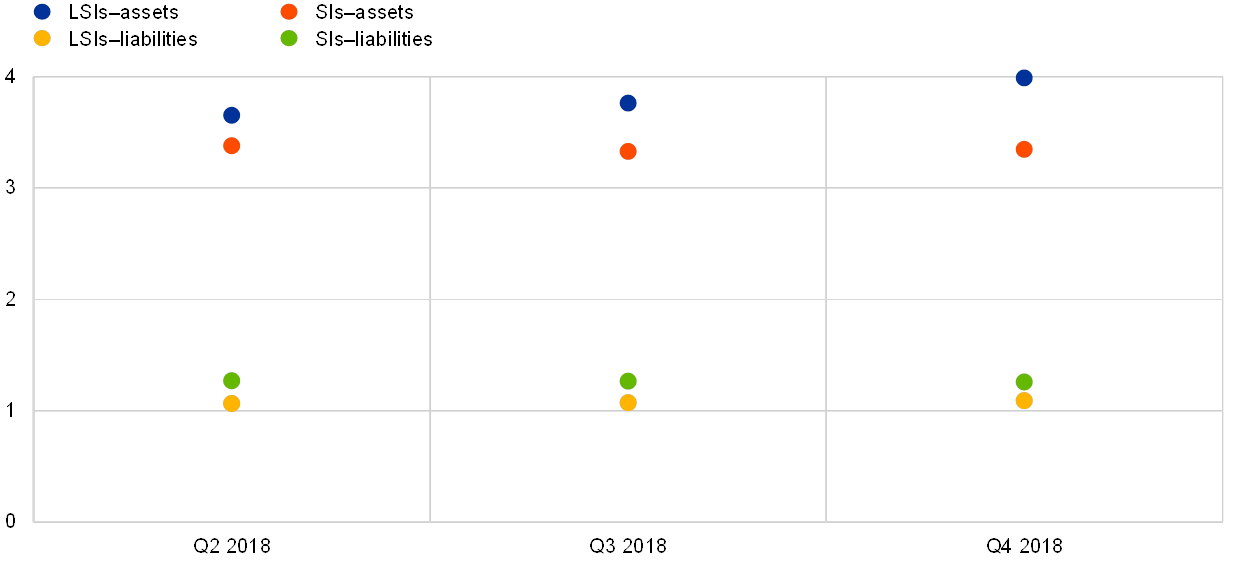
Sources: Banks' supervisory reporting and ECB calculations.
Notes: Average residual maturity computed as the product of contractual inflows (for assets) or outflows (for liabilities) and their residual maturity according to the maturity buckets reported in template COREP 66.01 and divided by total inflows or outflows. Within each time bucket the mid-point is taken as reference (e.g. 1.5 year for the bucket from one to two years). Data are computed as the arithmetic averages for the banks in the respective sample (either SI or LSI) at the highest level of consolidation. In this framework, sight deposits are in the one day maturity bucket, thus no behavioural aspects on the maturity of sight deposits have been considered.
At the end of 2018 total central bank operations in the LSI sector amounted to 2.1% of all LSI funding (compared to 2.8% for SIs).[17]
While the use of central bank funding across the LSI sector is low on average, central bank liquidity for some institutions is more pronounced; a total of around 50 institutions (representing 5.4% of total LSI assets) have shares of central bank funding that exceed 10% of total financial liabilities.[18]
In conclusion, despite a small fraction of LSIs making more use of central bank liquidity, there is no evidence that dependence on central bank funding is a widespread issue within the LSI sector.
1.5 Other risks
- Although new risks (for example, those related to the digitalisation of finance) are increasing operational risk overall, the weight of operational risk in terms of risk exposure amount (REA) is diminishing across all LSIs.
- Interest rate risks in the banking book (IRRBB) have decreased on a year-by-year basis despite strong regional differences.
- Market risk requirements for the LSI sector remain stable and structurally marginal due to business model specificities.
Drivers of operational risk
Operational risk capital requirements[19] are intended to enhance the resilience of banks against risks related to internal and external fraud, employment practices and workplace safety; risks stemming from clients, products and business practices, damage to physical assets, business disruptions and system failures; and risks originating in the execution, delivery and management of processes. On average this risk represents around 9.2% of the total REA at LSIs, a percentage that has been remarkably stable recently (declining by only 40 basis points over the last three years); it is also a percentage that is in line with that of SIs (10.6% in 2018).
Data on frequency distribution (see Chart 25) points to a concentration of LSIs with a share of operational risk over total REA at around 8‑10%. However, the distribution has several outliers, especially on the right tail, owing to – among other things – the existence of several LSIs classified as FMIs, whose specific business operations exhibit high shares of operational risk (see Chart 26).
Chart 25
Frequency distribution of the share of operational risk for LSIs over total REA
Sources: Banks' supervisory reporting and ECB calculations.
Notes: Including FMIs and excluding branches. LSIs with a share of operational risk over total REA below 5% or above 20% have been excluded.
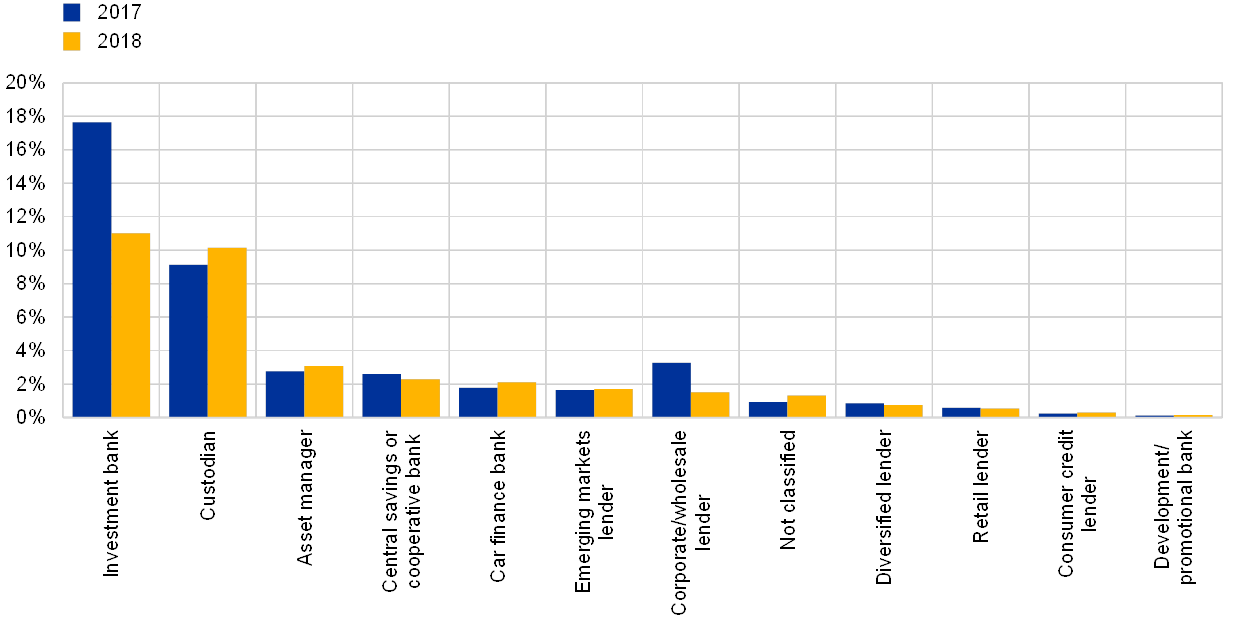
Chart 26
Share of operational risk over total REA by business model
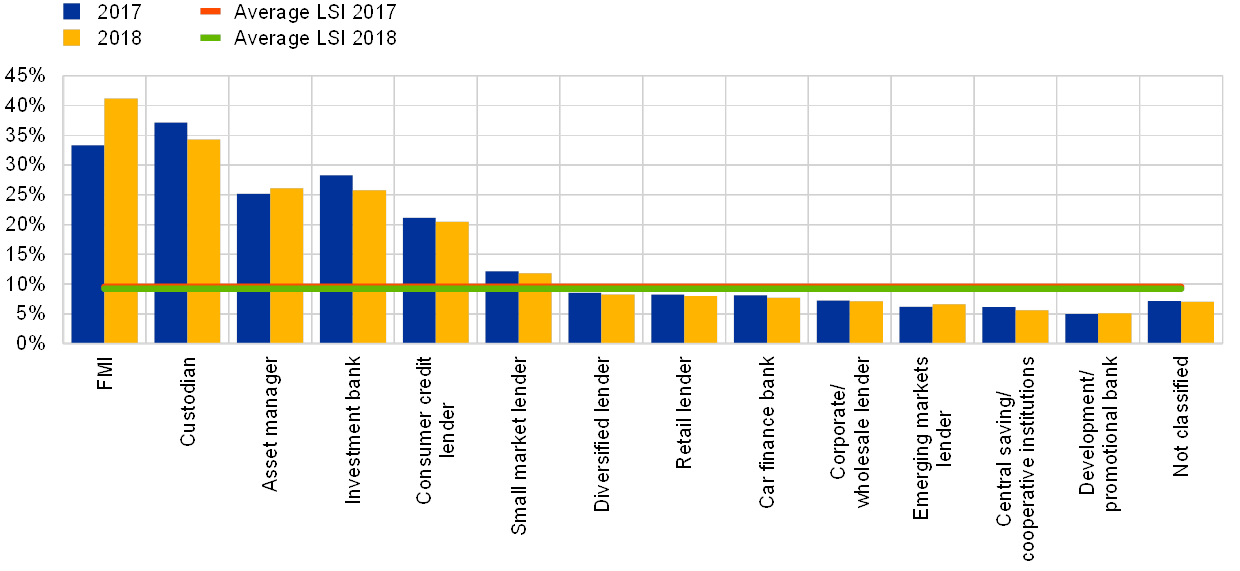
Sources: Banks' supervisory reporting and ECB calculations.
Note: Including FMIs and excluding branches.
A comparison across countries reveals strong heterogeneity within the euro area; the share of operational risk is prominent in the LSI sectors of Belgium and France – both countries host large FMIs. The rise of cybercrime and IT security risks, as a consequence of the ongoing process of financial digitalisation, also affects operational risk.
Drivers of interest rate risk in the banking book
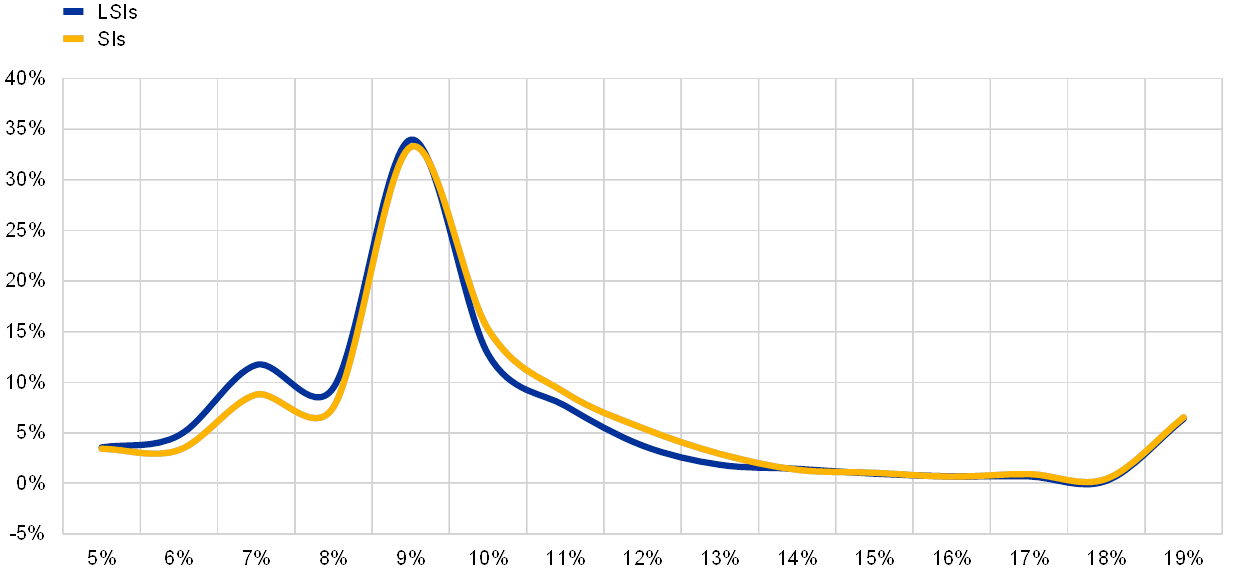
Given their high dependence on interest income, LSIs remain vulnerable to changes in interest rates. This is exemplified by the Basel II IRRBB standard metrics, which measure, in terms of economic value of equity (EVE), the impact of a 200 basis point parallel upward and downward shift of interest rates. Aggregate data, relative to a parallel upward shift of 200 basis points in the yield curve, indicate an 8.9% average loss in the economic value of LSI capital. Despite being negative, this figure marks a small improvement compared to the same data for 2017 (see Chart 27). The extent of the negative impact varies between countries; most affected are those where banks that have a predominance of fixed-rate interest-bearing assets, which expose them to the risk of a sudden rise in the level of interest rates. An upward shift of 200 basis points in the yield curve would cause a drop of over 25% in the EVE of over 250 LSIs, down from 290 in 2017.
Chart 27
LSI sector average EVE impact of a parallel upward/downward shock in the yield curve of +200/-200 basis points
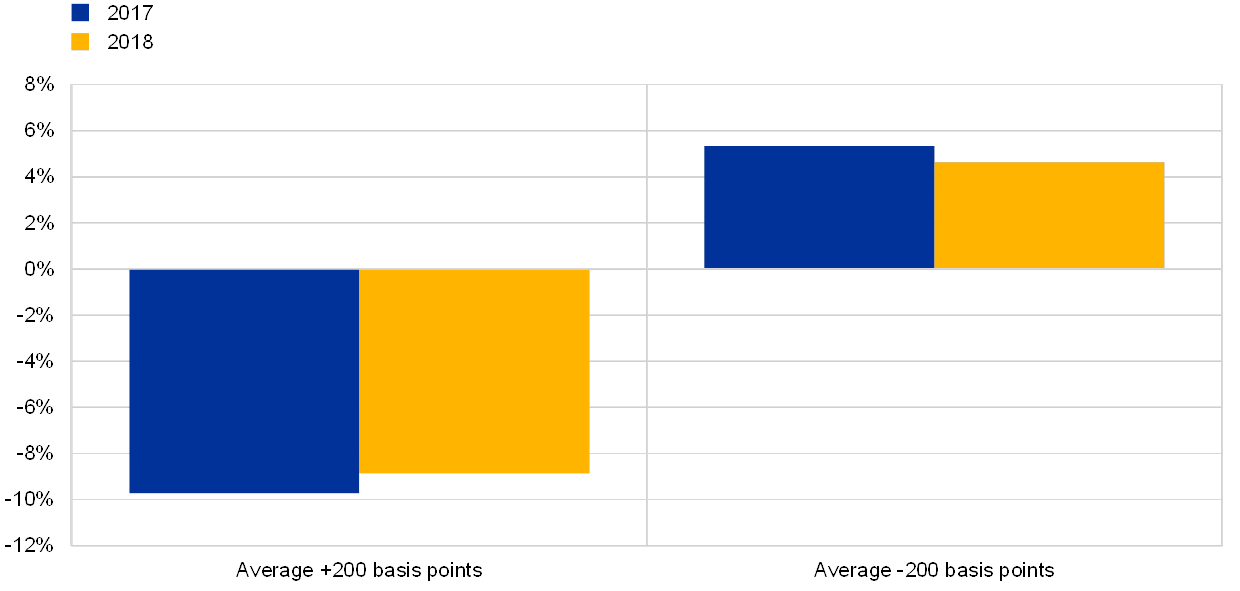
Sources: NCA reporting and ECB calculations.
Chart 28
Distribution of EVE impact (+200 basis points) across LSIs
Sources: NCA reporting and ECB calculations.
Drivers of market risk
In terms of exposures, market risk remains the smallest risk driver in the LSI sector with a share of just 1% of total REA compared to 3.7% in the SI sector. This is mostly due to the large share of LSIs that follow a retail business model, and whose market risk capital requirements remain comparatively low with respect to more specialised banks.
Chart 29
Market risk exposure by business model
Sources: Banks' supervisory reporting and ECB calculations.
Chart 30
Evolution of market risk capital requirements as a percentage of total capital requirements
Sources: Banks' supervisory reporting and ECB calculations.
1.6 The capital position of LSIs
- Levels of capitalisation for LSIs remain comfortably above minimum requirements; the average CET1 ratio is 17%, or around 250 basis points, higher than that of the SI sector.
- LSIs maintain a fully loaded excess CET1 capital (which is above the minimum requirements of between 3% and 6% of their REA).
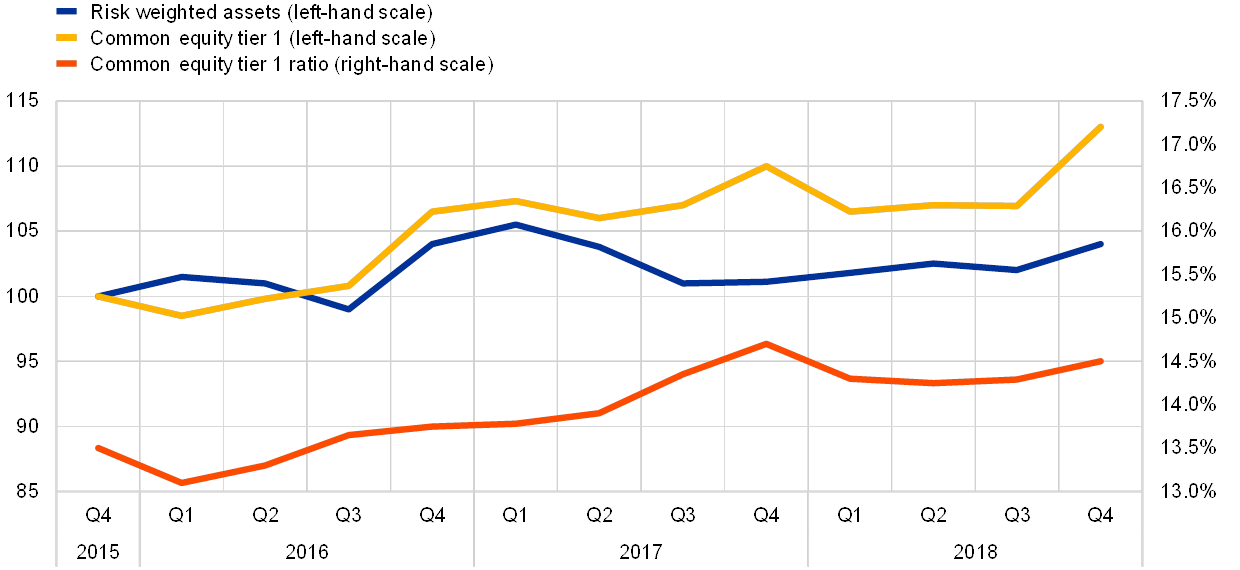
During 2018 the average LSI sector CET1 ratio remained broadly stable at around 17% (see Chart 31), consolidating stable growth witnessed in the previous three years. In particular, the average CET1 ratio of the LSI sector was sustained by a healthy growth in both CET1 capital (+2.3% year-on-year) and REA (+2.4% year-on-year). SIs, in contrast, witnessed, on average, a small decrease in CET1 ratios down to 14.7% during 2018 (see Chart 32). Overall, the average LSI sector CET1 ratio remains around 250 basis points higher than that of SIs, while both sectors enjoy similar levels of total capital (18.80% for LSIs compared to 18.04% for SIs); this is because of more limited issuance of Additional Tier 1 (AT1) and Tier 2 (T2) capital instruments by LSIs.
Chart 31
Evolution of RWA, CET1 capital and CET1 capital ratio at LSIs
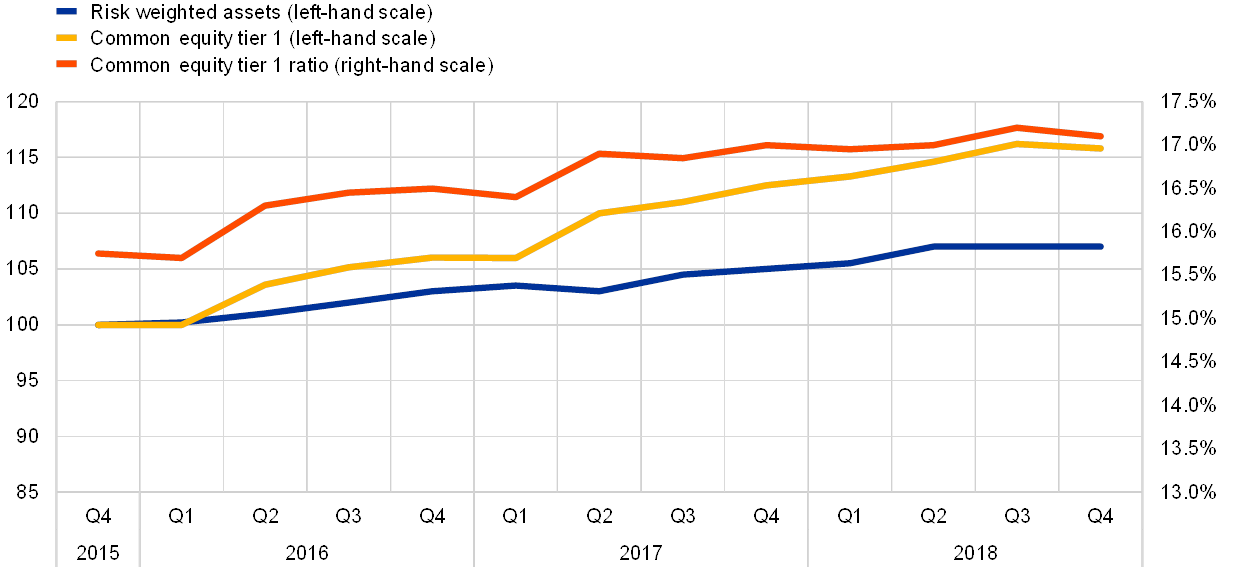
Sources: Banks' supervisory reporting and ECB calculations.
Chart 32
Evolution of RWA, CET1 capital and CET1 capital ratio at SIs
Sources: Banks' supervisory reporting and ECB calculations.
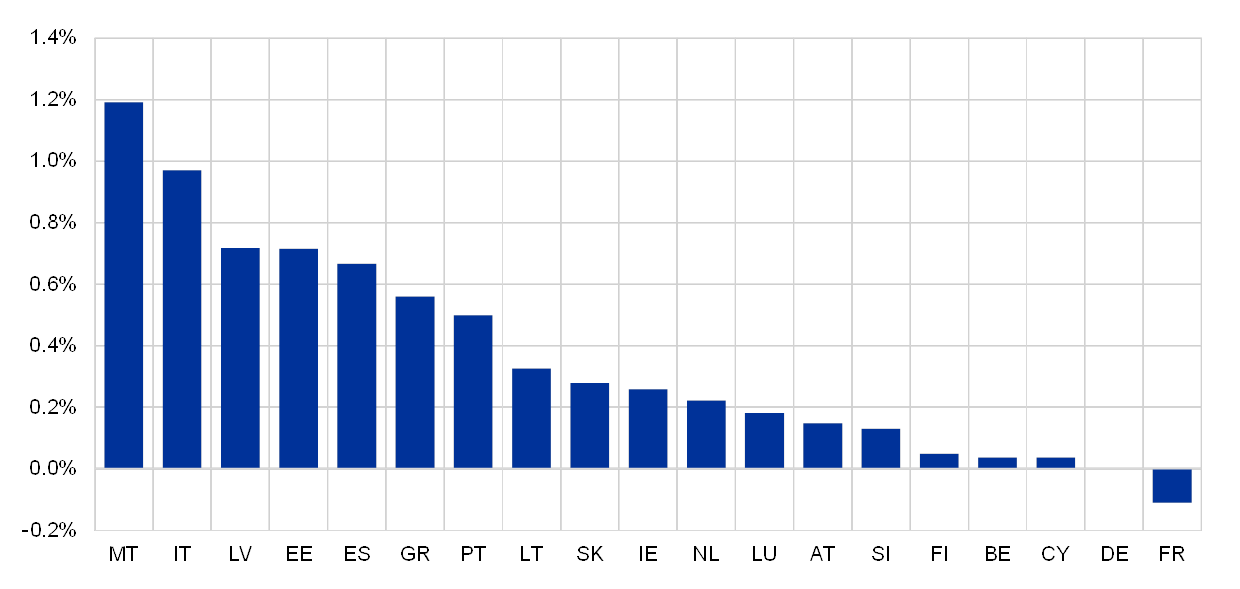
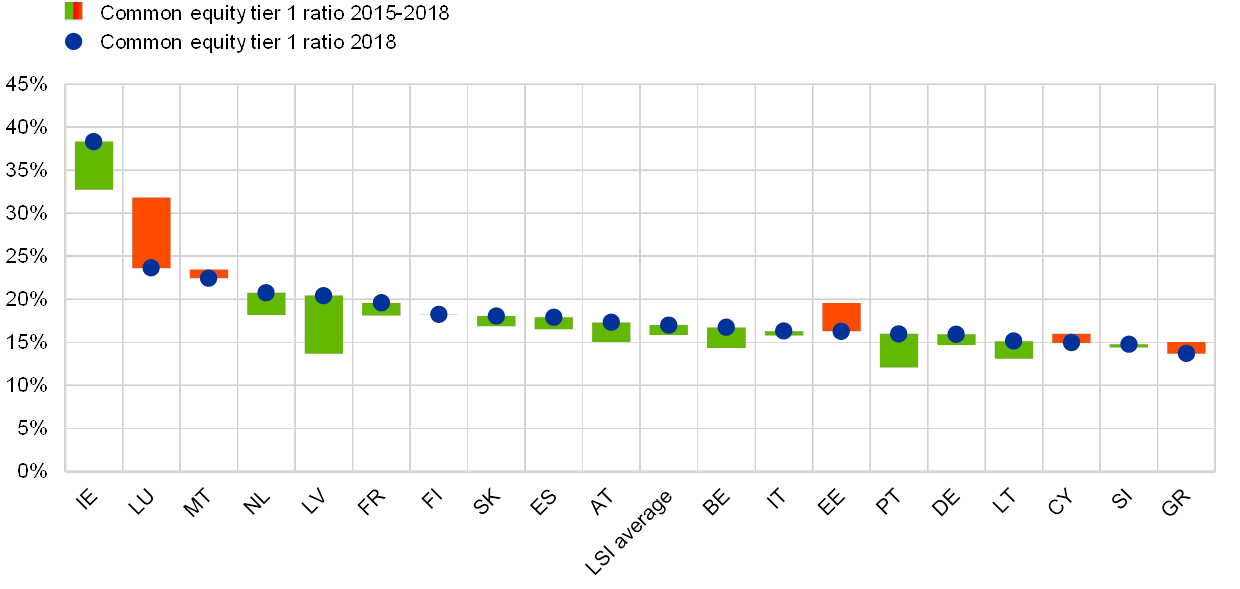
From a cross-country perspective, in the period between 2015 and 2018, average CET1 ratios at LSIs have increased in all but a few jurisdictions (see Chart 33). Changes were mostly positive and moderate.
Chart 33
Evolution of average CET1 ratio by country in the period 2015-2018
Sources: Banks' supervisory reporting and ECB calculations.
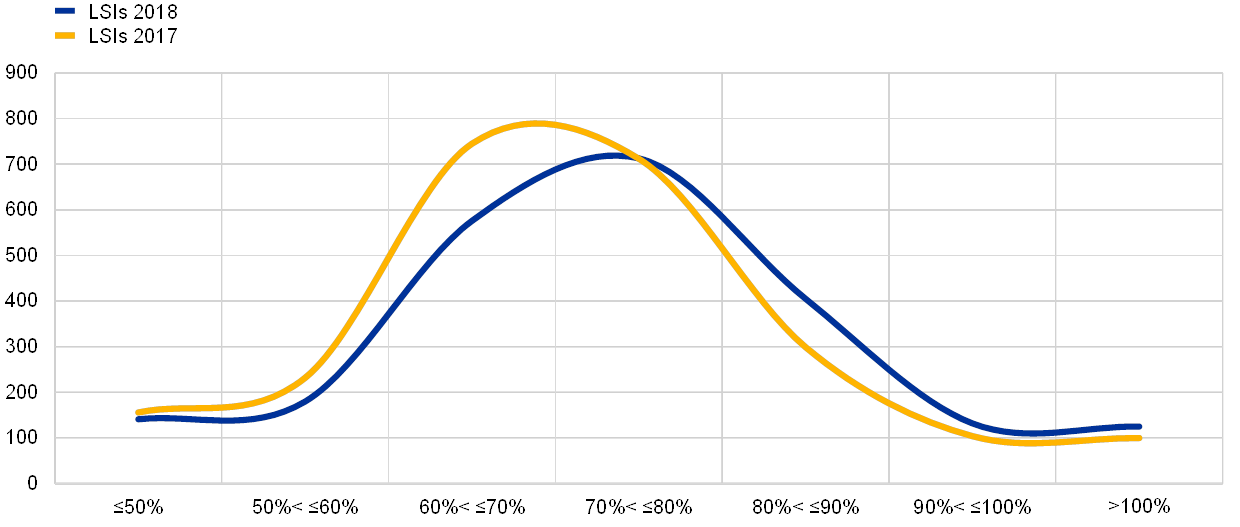
Comparison of capital supply (in terms of available CET1 capital) with capital requirements (including macroprudential requirements) shows that LSIs generally maintain a healthy cushion above the regulatory minimum. Given that capital adjustments are costly, this excess capital acts as a buffer against fluctuations of the banks’ capital ratios.[20] In this respect, most LSIs hold an average excess CET1 capital (fully loaded) of between 3% and 6% (see Chart 34).
Chart 34
Distribution of excess CET1 capital (fully loaded) across LSIs
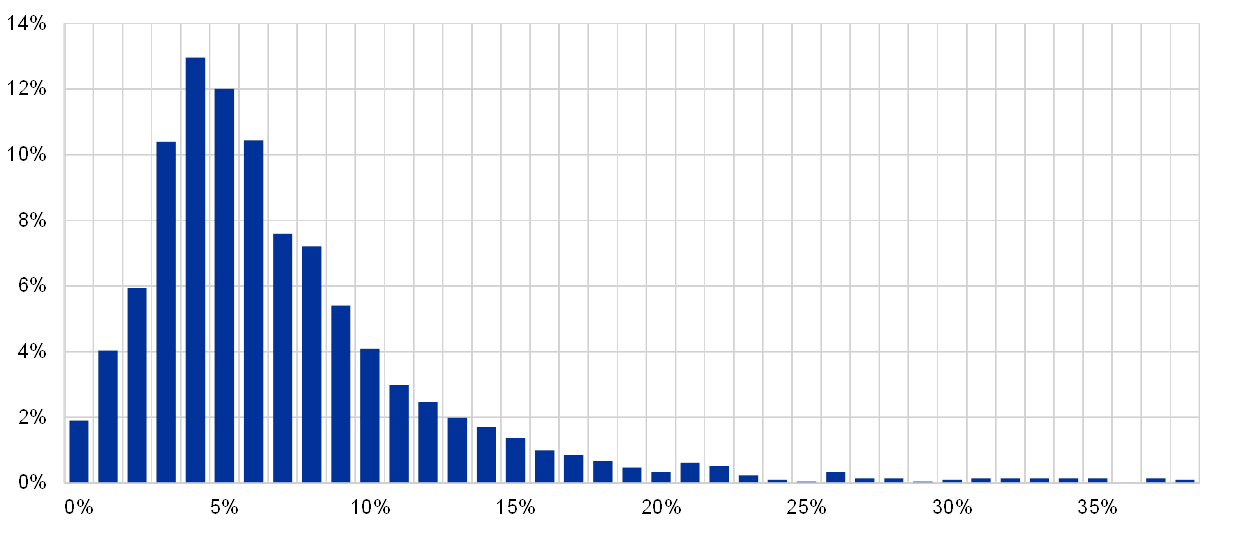
Sources: Banks' supervisory reporting and ECB calculations.
Notes: The chart refers to the distribution, by bank, of excess capital for LSIs at the highest level of consolidation (excluding branches). Excess CET1 capital (fully loaded) is defined as the difference between capital supply in terms of CET1 capital (excluding capital that is to be phased-in) minus the minimum requirements of Pillar 1, Pillar 2, macroprudential buffers plus any AT1/T2 capital shortfall. The chart does not consider Pillar 2 guidance and assumes that Pillar 2 requirement must be fulfilled only with CET1 capital.
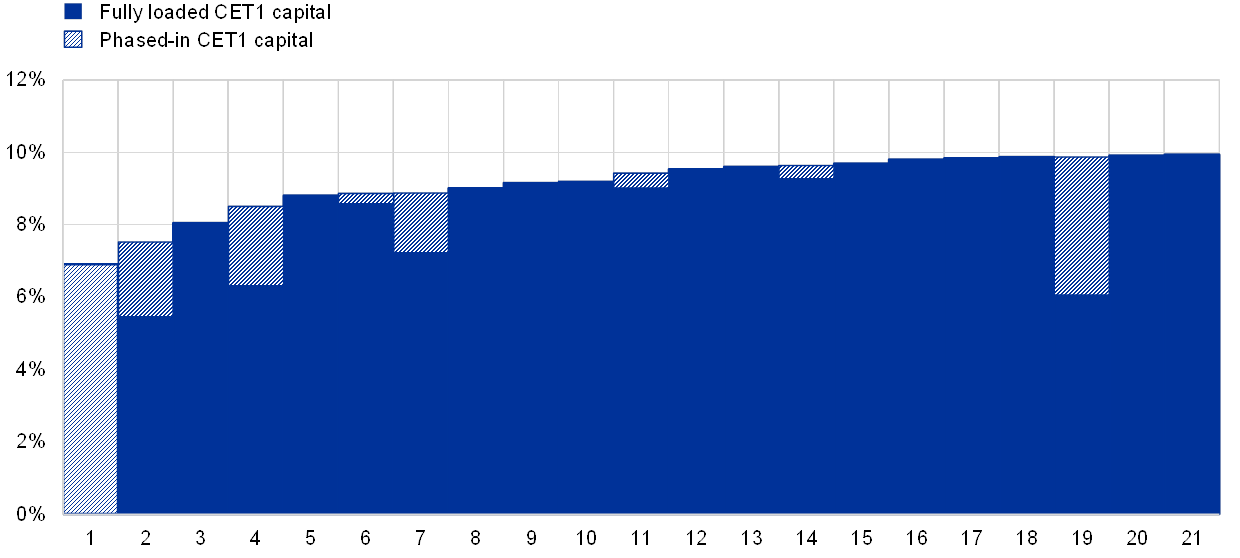
Despite this generally benign picture, some pockets of vulnerability remain. In fact, 21 LSIs report a transitional CET1 ratio below 10% at the end of 2018, with a few banks very close to the minimum of 6% of CET1 capital (see Chart 35).
Chart 35
LSIs with lowest transitional CET1 ratios
Sources: Banks' supervisory reporting and ECB calculations.
Compared to the SI sector, the LSI sector relies less on alternative forms of capital, such as AT1/T2 instruments. This is due to their business models (for example, most savings and cooperative banks do not distribute dividends and accumulate capital primarily through retained earnings), or because of difficulties in tapping financial markets owing to their small size or lack of expertise. On average only around 10% of total LSI regulatory capital is in the form of AT1/T2 instruments (see Chart 36), which is roughly half that of SIs (19.8%).
Chart 36
Shares of AT1/T2 capital over total regulatory capital across countries.
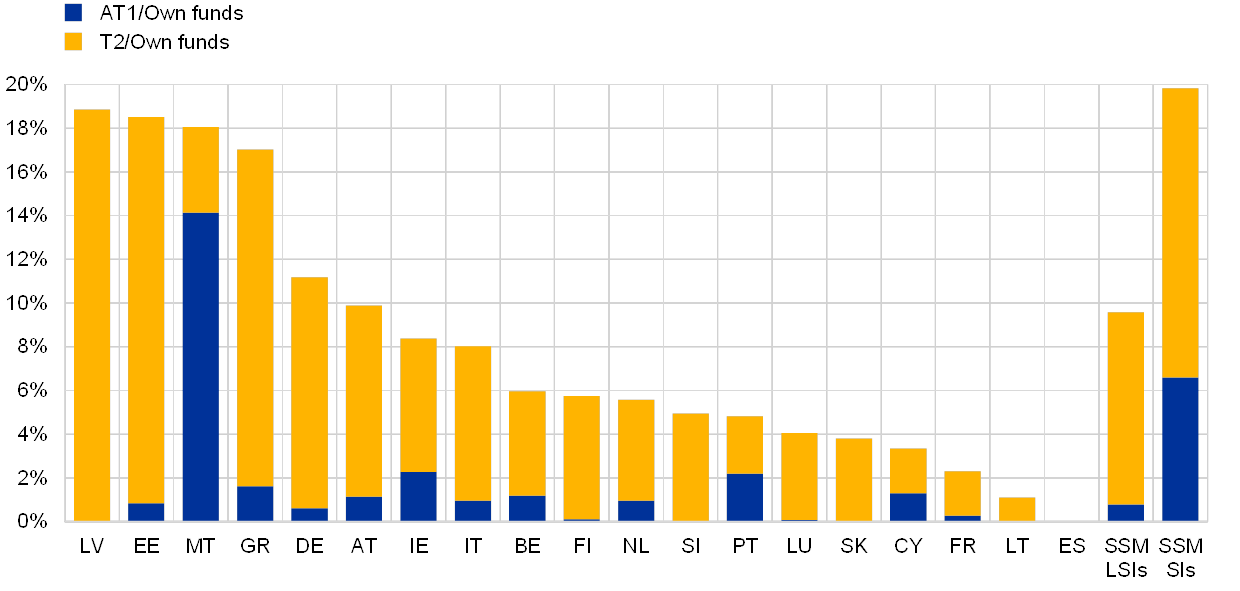
Sources: Banks' reporting and ECB calculations.
Finally, LSIs are less leveraged overall than their larger counterparties in the SI sector. As reflected by the Basel III leverage ratio (see Chart 37), the median LSI has a leverage ratio of 10% in comparison to 6% for the median SI.
Chart 37
Distribution of the leverage ratio of LSIs and SIs at end-2018
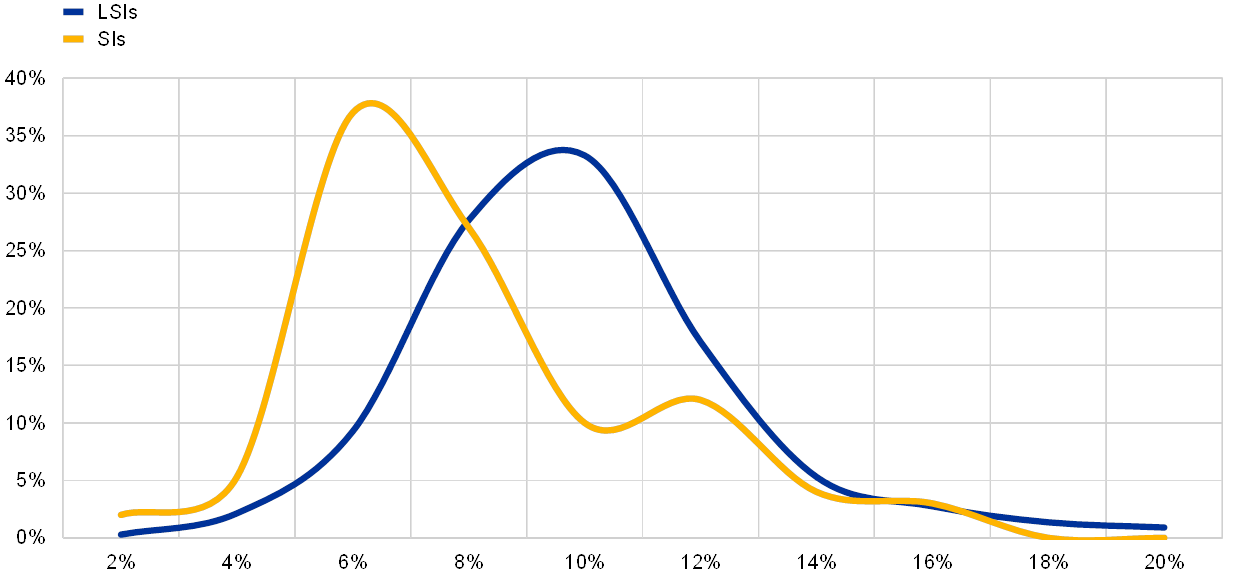
Sources: Banks' supervisory reporting and ECB calculations.
2 Part 2 — Deep dive into LSI risks and vulnerabilities
A wider use of “multichannel strategies” is a promising trend in the banking sector. As for LSIs in particular, digital transformation of their business requires substantial investment in software and IT infrastructures, while the expected returns can only be seen much later. As a general trend, banks are striving to chase digital platform providers – such as those from big technology companies (BigTech) – so as to form alliances with them as brokers, rather than allowing them to be providers of financial services – the intention being to maintain direct contact with their customers and to slow down the trend towards BigTech fully entering the banking business. The strategy for many is to differentiate themselves in the market by means of quality and advisory, while still cooperating with BigTech. In this context, some players have taken extensive measures by fully leveraging on the opportunities offered by digitalisation to reach out to their customers exclusively via digital channels, for example, web interfaces, dedicated smartphone applications, etc., thus entirely bypassing the concept of branches. This deep dive thus examines how these banks are faring compared to the incumbent banks and whether their experiences could teach something to the rest of the LSI sector.
2.1 Digital-only LSIs
Introduction
As discussed in Part 1 of the report, profitability and business model sustainability continue to be among the main supervisory concerns for LSIs. Over recent years, rising competition, changing customer behaviour and low interest rates have put renewed pressure on banks’ profitability. This is particularly evident for those institutions that rely on the traditional lending-based business model. Over 80% of LSIs belong to this category (see Section 1.1), thus being currently squeezed between shrinking margins and the costs of retaining an extensive network of branches, which is the backbone of their relationship banking business.
Against this backdrop, some players are leveraging on the opportunities offered by digitalisation to reach their customers exclusively via digital channels, for example, through web interfaces, dedicated smartphone applications, etc., thus entirely bypassing the concept of physical branches. In a society that is experiencing rapid digitalisation, the advantage of this approach is that it appeals to the more mobile and tech-savvy customers, while saving the running costs of a network of branches. As a result, over the past five years the euro area banking market has witnessed the arrival of a number of technology-enabled players. Typically these are recently established banks (most of which are LSIs) or long-existing firms that have radically adapted to a digitally-focused business model.
For this reason, in this deep dive, we examine the universe of digital-only LSIs, meaning innovative banks that primarily use digital channels (e.g. online platforms, mobile apps, etc.) to serve their existing and new clients.[21] We analyse their business models and risk characteristics and compare their P&L results with those of other LSIs. In particular, we aim to assess whether the “digital-only” approach is a viable solution to the problem of low efficiency in the LSI sector. In their quest to attract new customers, these banks could be seen as “challenger banks” to the rest of the market. We therefore examine the responses of incumbent banks (also from the SI universe), some of which offer similar online-only products.
Our analysis reveals that most of those institutions have so far shown strong growth in assets over the past three years alongside an increasing volume of retail deposits. Also, some long-existing firms that have radically adapted to digitally-focused business models have shown remarkable growth. While these institutions provide significant added value for their customers by enabling them to experience more instant and user-friendly banking services, recent incidents have brought some of these digital players to the attention of supervisors by raising concerns about their operational preparedness.[22] This issue will also be part of our deep dive analysis.
The remaining part of the deep dive analyses a sample of digital-only LSIs as of December 2018 (see Section 2.1.2), by examining more closely their business model, including balance sheet components and P&L ratios (see Section 2.1.4), as well as their risk profile(see Section 2.1.5). Finally, the analysis includes back-testing of the business plans of some of the most recent digital-only LSIs (submitted during their authorisation procedures), so as to verify the accuracy of their forecasts (see Section 2.1.6).
Defining the sample of banks
To better refine the selection of digital-only LSIs, the analysis includes only those banks that rely exclusively on their digital presence, in other words, they do not have branches open to the public nor maintain a network of private bankers. These banks thus rely entirely on digital channels to manage their interactions with customers, thereby enabling their customers to become more autonomous and limiting human intervention as far as possible.[23] In total, around 20 such LSIs across nine countries were identified, many of which conduct cross-border operations within the EU.[24]
Digital only LSIs were identified through several means, including the ECB's internal list of authorised banks classified as a Fintech credit institutions [25], information provided by NCAs, supervisory reporting data, Fintech rankings, etc.
Albeit starting from low levels, by comparison with the rest of the LSI sector, digital-only LSIs have witnessed a strong expansion over the past few years (see Chart 38), with their total assets increasing from around €15 billion to €27 billion between 2015 and 2018. The largest of these banks are based in Germany, Luxembourg or the Netherlands. Some players operate in smaller markets, among which Malta and Estonia, from where they can also access several other European jurisdictions.
Chart 38
Asset growth at digital-only LSIs
(EUR billions)
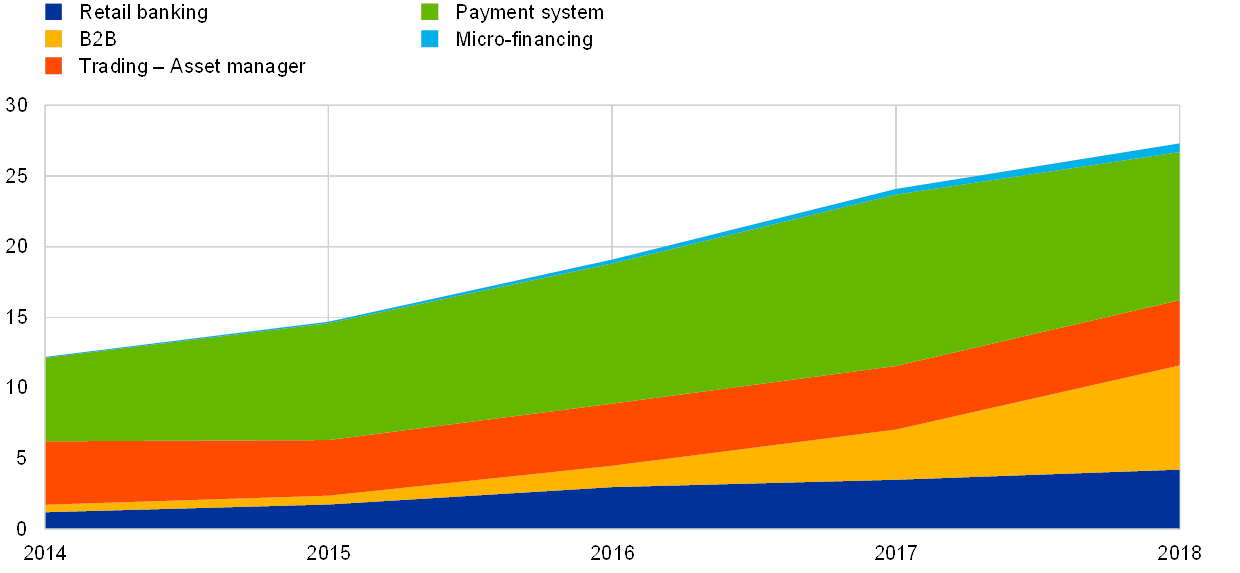
Sources: Banks' supervisory reporting and ECB calculations.
Notes: Classification based on primary business line as defined in Section 2.1.4.
Digital-only LSIs are joining an already rather crowded market. Given the prevalence of multi-channel banking, most banks in the euro area now provide digital services (in addition to the traditional channels). Some SIs have also set up new entities, typically subsidiaries with different names and branding from the parent company in order to compete exclusively in the digital arena. These new entities could be regarded as incumbent banks' answer to the challenges posed by new digital competitors. Our analysis therefore covers a sample of these banks – known as “digital SIs” – which provide services similar to those of digital only-LSIs and which were used as a benchmark for the analysis.[26] One major caveat to this comparison is that these digital SIs, as subsidiaries of established banking groups, may rely on the services (e.g. software, IT infrastructure, etc.) provided by their parent company and therefore have a competitive edge over their LSI peers, which are typically stand-alone institutions.
International presence
While the vast majority of LSIs operate exclusively at the domestic level, digital-only LSIs are characterised by a more international presence. Indeed, thanks to passporting, these banks can operate across several jurisdictions within the EU without investing in a physical presence, as other banks have tended to do. On average, a digital-only LSI in the retail business is authorised to operate (either via a branch or through passporting) in over ten EU markets. The countries which are most targeted by digital-only LSIs are those with larger banking markets (i.e. Germany, France and Italy) or those where customers’ appetite for digital banking products is higher, such as the Netherlands (see Figure 2). Moreover, when it comes to exposures, digital-only LSIs hold considerable cross-border assets (on average over one quarter of total exposures are to non-domestic customers), mostly to EU clients, with only a small fraction being to non-EU (mainly the United States) counterparties. Finally, digital-only LSIs have put some effort into internationalising their marketing (e.g. making their webpages multilingual). However, all in all, the limited overlap across these three factors (e.g. cross-border exposures, approved passporting rights or a dedicated marketing platform) proves that there is still ample room for further internationalisation.
Figure 2
International presence of digital-only LSIs
(passporting rights)
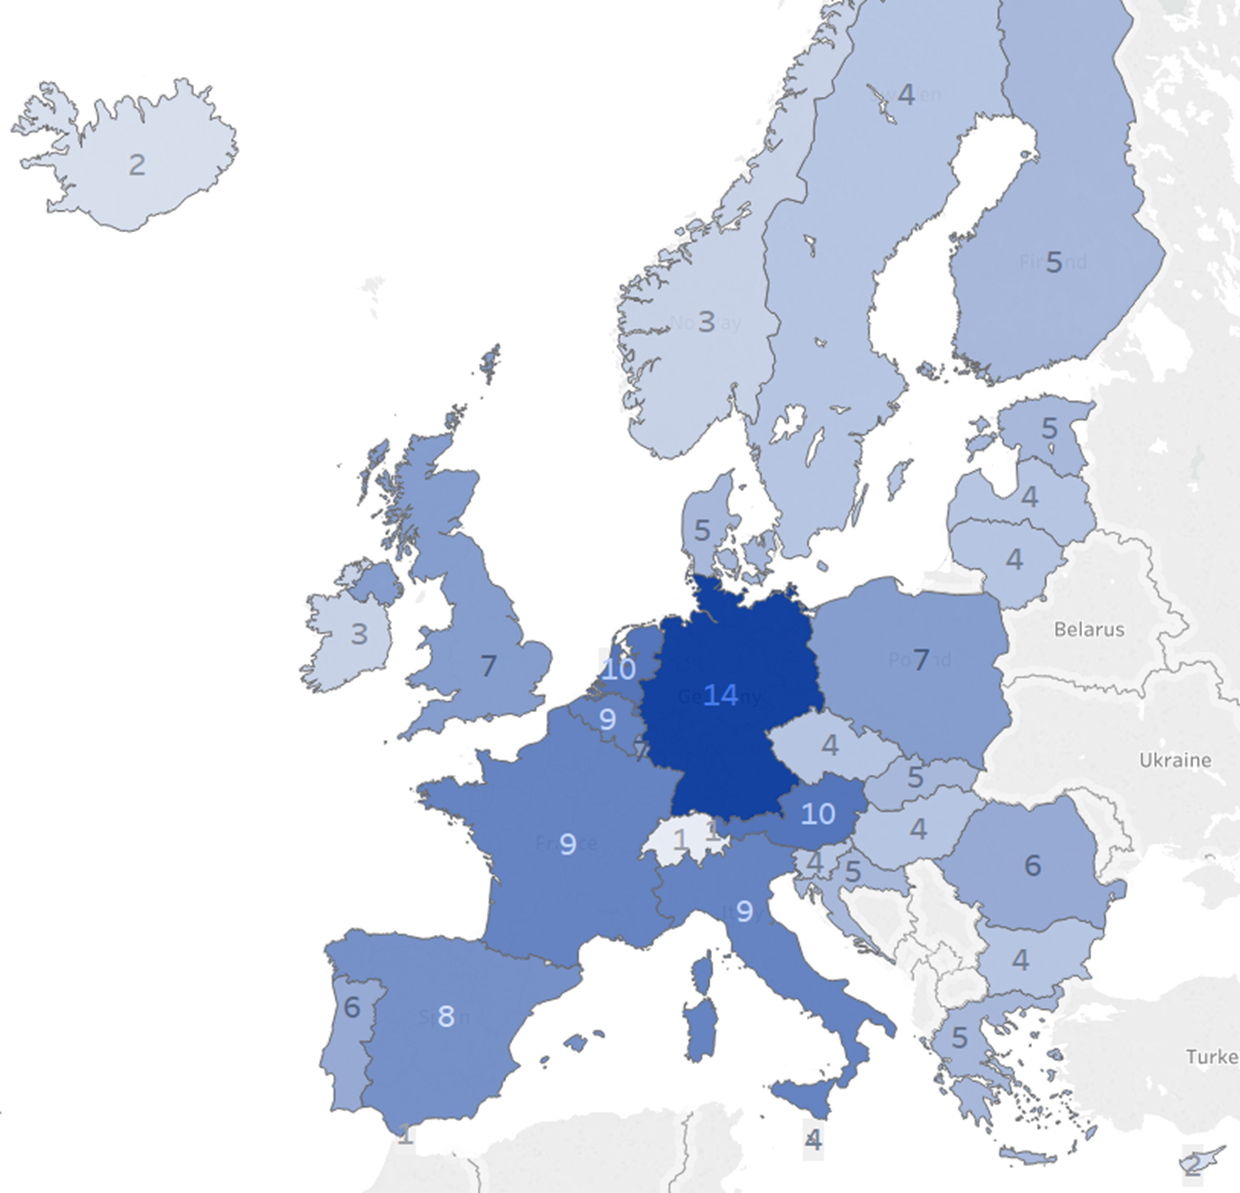
Source: Passporting procedures.
Notes: Total number of digital-only LSIs authorised to operate cross-border via branches or passporting. Including country of incorporation.
Business model analysis
Although the LSIs in the sample cover a wide range of different products, they tend to specialise in certain primary business lines, such as payment systems, trading and asset management, with only a handful of them capable of offering the full range of services typically found in the more established banks. This is most likely due to the fact that these banks are keen to specialise in certain parts of the value chain, doing it better, more cheaply and efficiently than their incumbents, so that they can keep an edge over their competitors. We therefore categorised the sample of digital-only LSIs by primary business line into the following five categories:[27]
- institutions that focus primarily on payment services, e.g. mobile payment services, card distribution, etc.;
- retail banks that focus on typical banking services, such as current accounts, credit cards, etc., and typically offer online deposits and some form of lending;
- banks that focus on business-to-business (B2B) activities, for example, enabling other companies to conduct business by offering a financial services platform (e.g. white-label banking products);[28]
- trading services and asset management, i.e. banks offering specialised financial services in the areas of trading, investing and savings (e.g. trading platforms, robo-advice, etc.);
- micro-financing, i.e. banks specialised in providing micro-financing and consumer credit through proprietary digital platforms.
The following sections describe key characteristics of the sample of digital-only LSIs through the lens of their primary business model.
Funding and asset exposures
Abundant market liquidity and attractive pricing conditions have enabled digital-only LSIs to rapidly collect retail deposits across several European countries (see Chart 39). These banks are thus primarily financed through household deposits, with a total volume of €8 billion in 2018 or 31% of total financial liabilities. Most of these are overnight deposits (around 88%), against a 60% share in the rest of the LSI sector, and are collected from customers across multiple EU countries. Another large source of funding stems from the corporate sector, mostly concentrated in banks primarily involved in payment systems, which by the nature of their business tend to have a higher share of corporate clients. Finally, since some B2B banks function as a clearing bank between their customers and other banks, a large share of their liabilities is in fiduciary accounts on behalf of their customers (classified as “other financial liabilities” in the supervisory reporting framework), which are matched by accounts at other banks (classified as “other financial assets”).
Chart 39
Composition of liabilities at digital-only LSIs
(by primary business line)
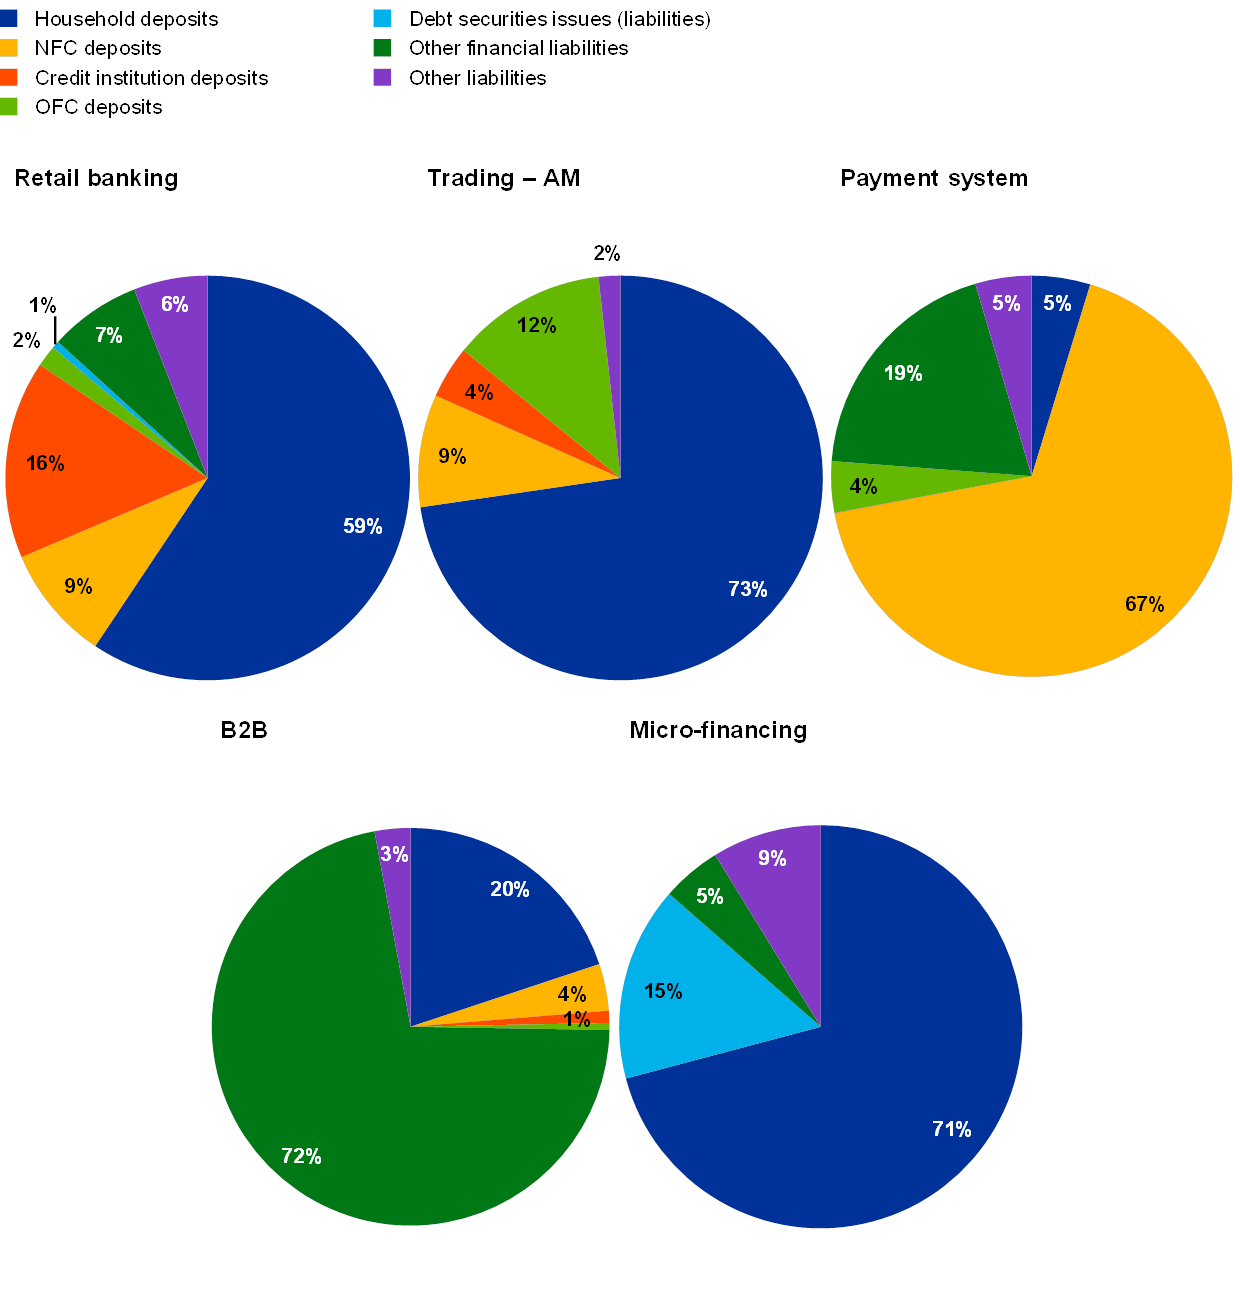
Sources: Banks' supervisory reporting and ECB calculations.
Moving to the asset side of the balance sheet, digital-only LSIs currently hold a large amount of cash and cash equivalents, mostly placed at central banks or with other financial institutions (see Chart 40). In particular, the share of deposits at central banks over total assets at digital-only LSIs is, on average, 17%, which is almost three times the average for the rest of the LSI sector. This asset allocation could be driven by the need of these banks to remain very liquid, given the very short maturity of their liabilities (mostly overnight deposits). On the other hand, this comes at a high cost in terms of profitability, with banks currently being obliged to pay interest on these sums, while not being able to pass them on to their customers.[29] Apart from cash and central bank reserves, digital-only LSIs focus on retail lending to generate income (27% of total loans, a figure in line with the rest of the LSI sector). Corporate lending remains yet undervalued. There is also a sizeable volume of assets placed with other credit institutions, particularly by payment system banks.
Chart 40
Asset portfolio composition at digital-only LSIs
(by primary business line)
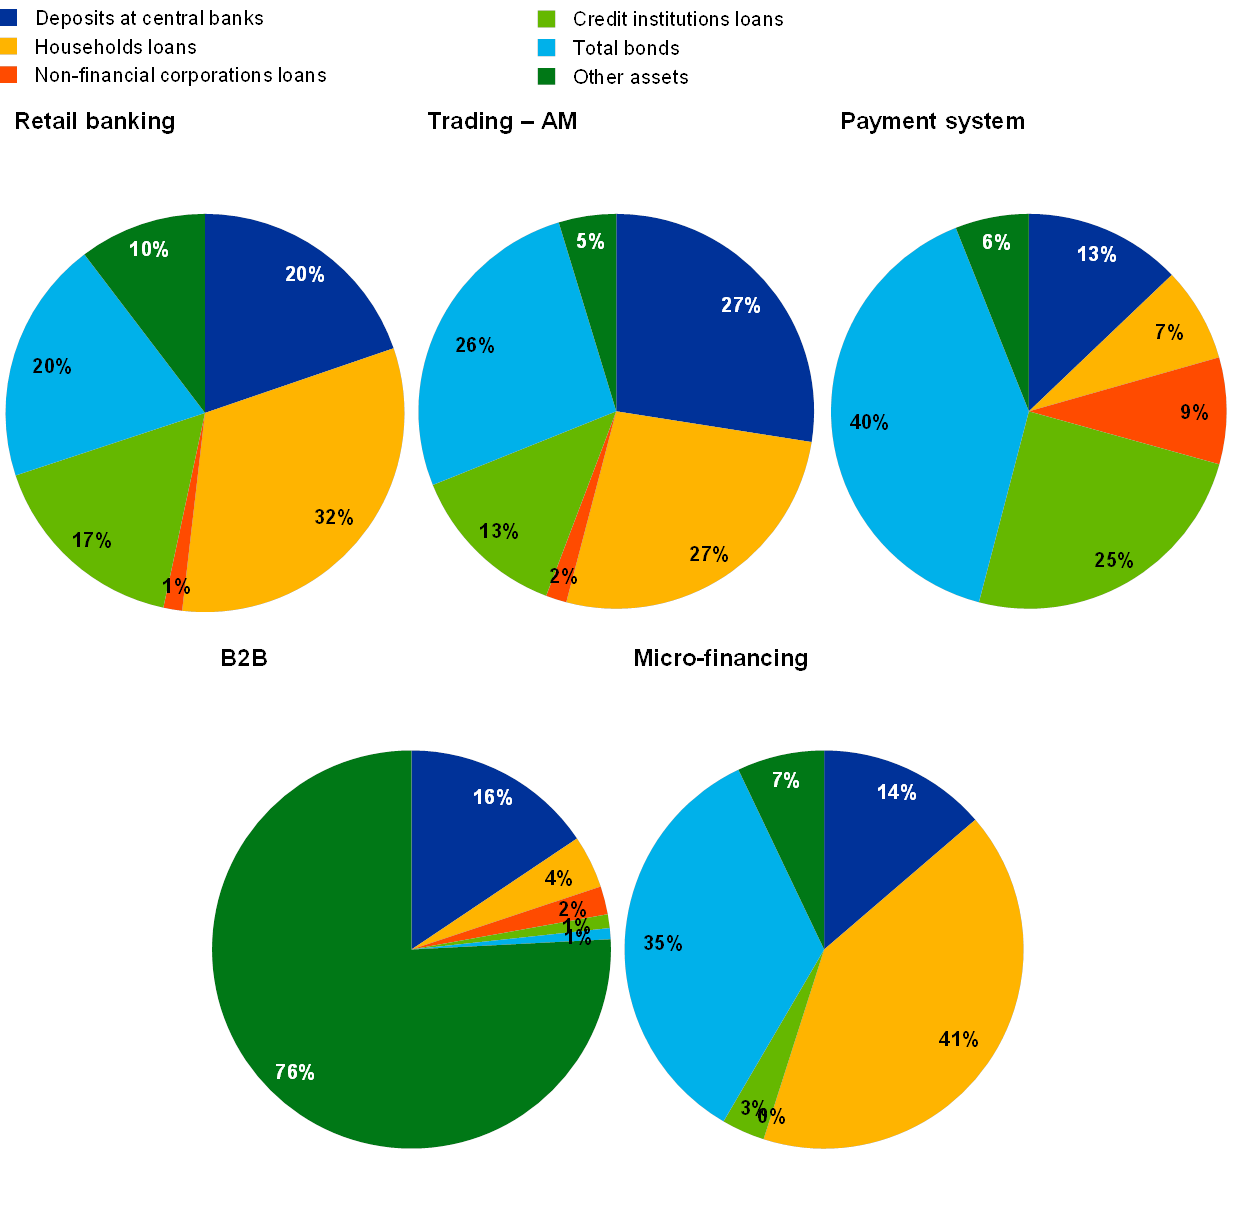
Sources: Banks' supervisory reporting and ECB calculations.
Profitability
In a generalised context of depressed profitability, digital-only LSIs appear to be doing far better than their peers: average ROE at digital-only LSIs was 19.6% in 2018 (up from 7.2% a year earlier). By comparison, the LSI sector, as a whole, achieved a mere 4.7% in 2018, with only slightly better results at SIs. Moreover, while in 2018 revenues at LSIs shrank (see Part 1), those of digital-only LSIs grew by over 26%, year-on-year.
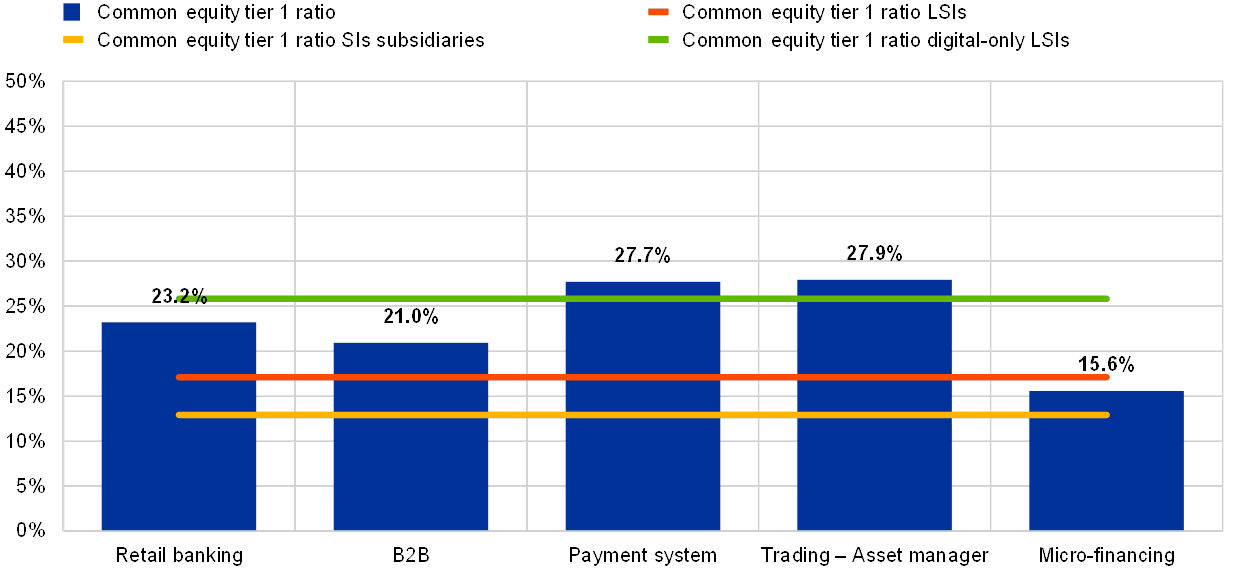
However, the picture is not homogeneous among digital players. Within the universe of digital-only LSIs, the most specialised business models, meaning banks primarily providing payment services (with an average ROE of 30%) and those offering trading/AM platforms (with an average ROE of 13%), appear to be the most profitable, consistently outperforming the rest of the LSI sector (see Chart 41). Furthermore, banks in the B2B business also witnessed remarkable growth over the past three years accompanied by relatively high returns. By contrast, some digital-only LSIs specialised in the retail banking business are, on average, loss-making (average ROE of ‑6.7%). Several factors lie behind this: first, the high level of central bank deposits, which are currently weighing down on these banks’ interest income; second, although revenues are growing year-on-year, these banks are currently spending more than their earnings, which is common among younger firms (some of these LSIs were only established a few years ago). Furthermore, as highlighted in a recent study by the Autorité de contrôle prudentiel et de résolution (ACPR) on the business model of online banks (Beaudemoulin et al., 2018), weaker income at these banks may also be due to a smaller product range, a higher level of inactive clients, limited pricing policies and a younger (and less affluent) clientele.[30]
Chart 41
Average ROE
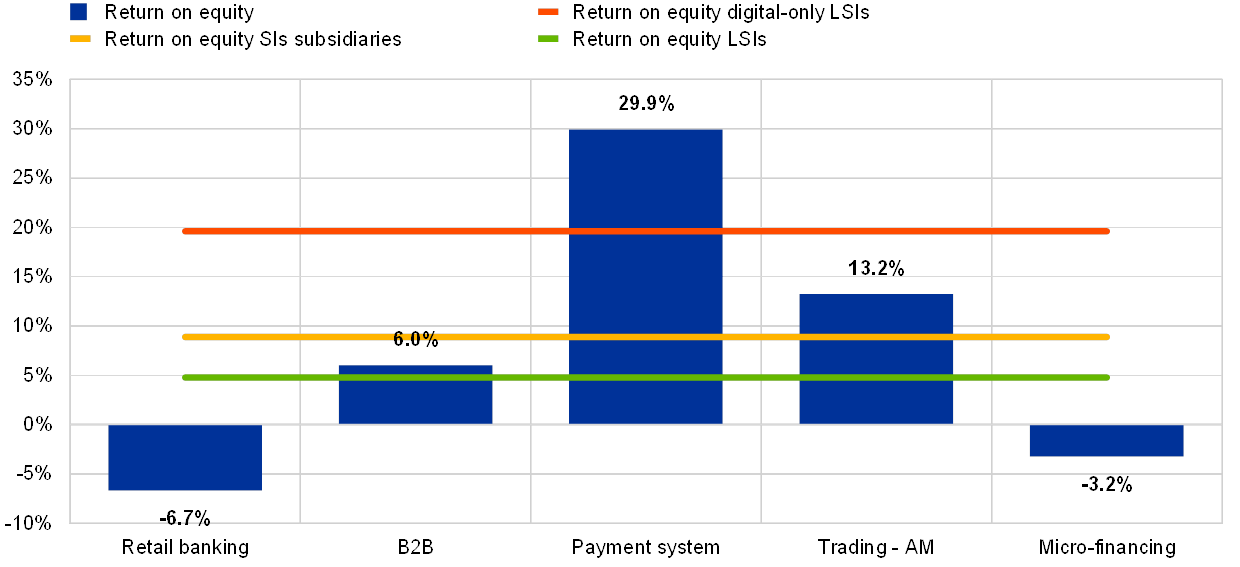
Sources: Banks' supervisory reporting and ECB calculations.
In terms of income composition, the average digital-only LSI generates primarily fees and commissions (around 50% of total operating income), which is almost twice as much as the average LSI (see Chart 42). The exceptions are digital-only LSIs involved in micro-financing and retail banking, which also rely on interest income (83% and 46%, respectively). The drawback is that these are somewhat more penalised by the current low interest rate environment. Also payment system-focused digital-only LSIs, on average, appear to derive a sizeable portion of total operating income from net interest income (56%). However, this figure predominantly reflects the behaviour of a single major player and therefore is not characteristic of the payment system business model itself.
Chart 42
Income composition
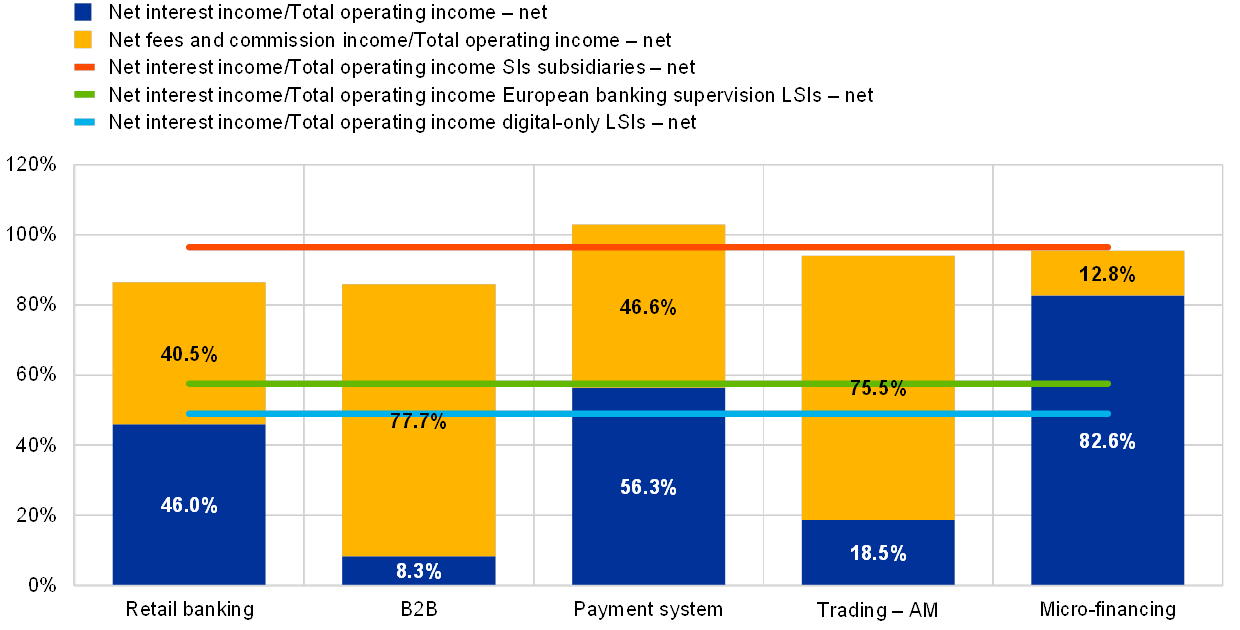
Sources: Banks' supervisory reporting and ECB calculations.
Note: The sum of the two shares might exceed 100%, as other income components posting losses pull down the value of total operating income.
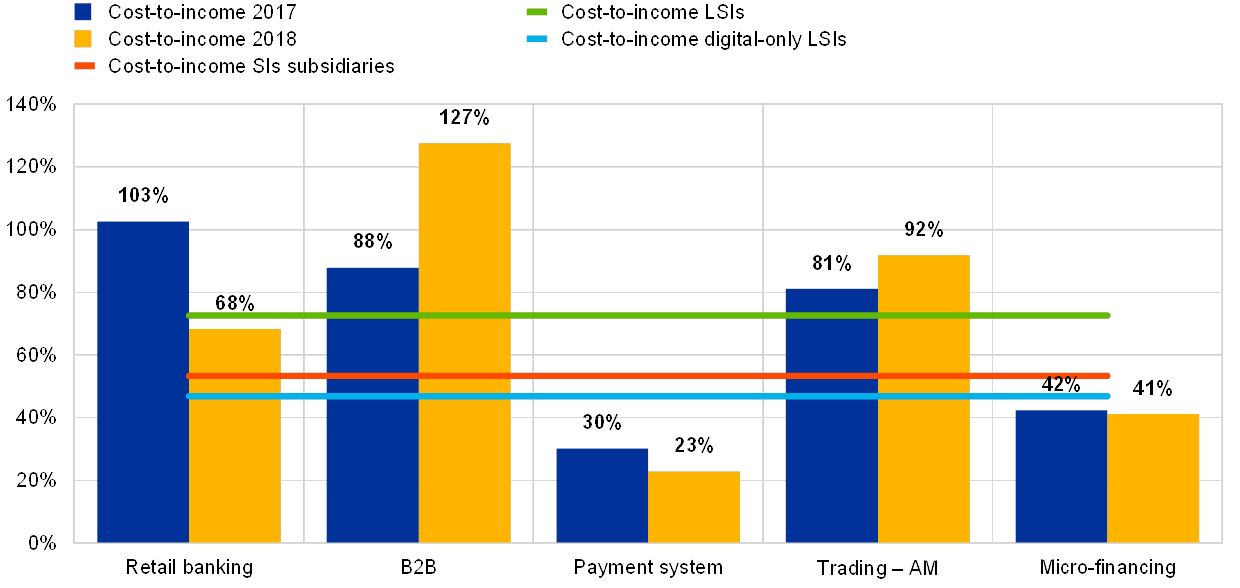
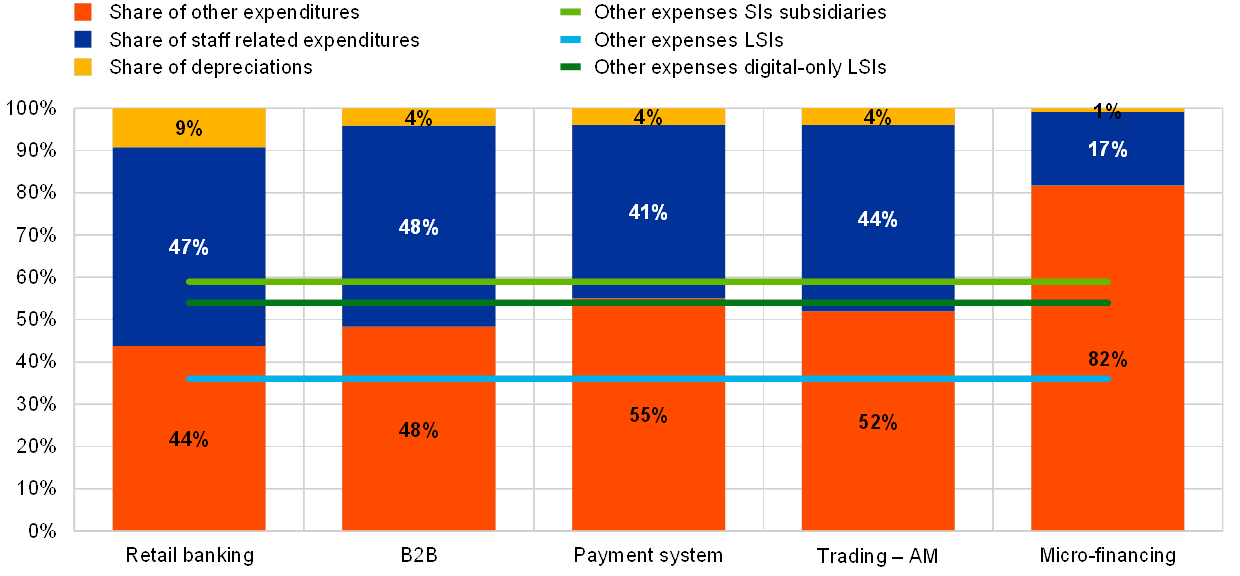
In terms of efficiency, digital-only LSIs exhibit an average cost-to-income ratio of 47% against 73% in the LSI sector, albeit with high dispersion across business models and significant fluctuations over time (see Chart 43).[31] Furthermore, in contrast to the rest of the LSI sector, administrative expenses other than staff costs are particularly relevant at digital-only LSIs, representing around 55% of their total operating expenses against an average of 35% at established LSIs (see Chart 44). Furthermore, these banks’ objective is to reach a sufficient critical mass to cushion their cost base (Beaudemoulin et al., 2018). As such, these banks are required to have large marketing budgets (to compensate for less established brands) and to invest in technology, so as to increase automation.
Also for the sample of digital SIs, the cost-to-income ratios tend to be significantly below that of their parent companies, at an average of 53%. Some of these banks are much larger in size than their LSI competitors and may benefit more from economies of scale. Moreover, these banks can rely on services provided by their parent company, thus giving them a competitive edge over stand-alone digital-only LSIs.
Chart 43
Cost-to-income ratios
Sources: Banks' supervisory reporting and ECB calculations.
Note: One bank excluded due to data quality issues.
Chart 44
Breakdown of overhead costs
Sources: Banks' supervisory reporting and ECB calculations.
Note: Two banks excluded due to data quality issues.
Risk factors
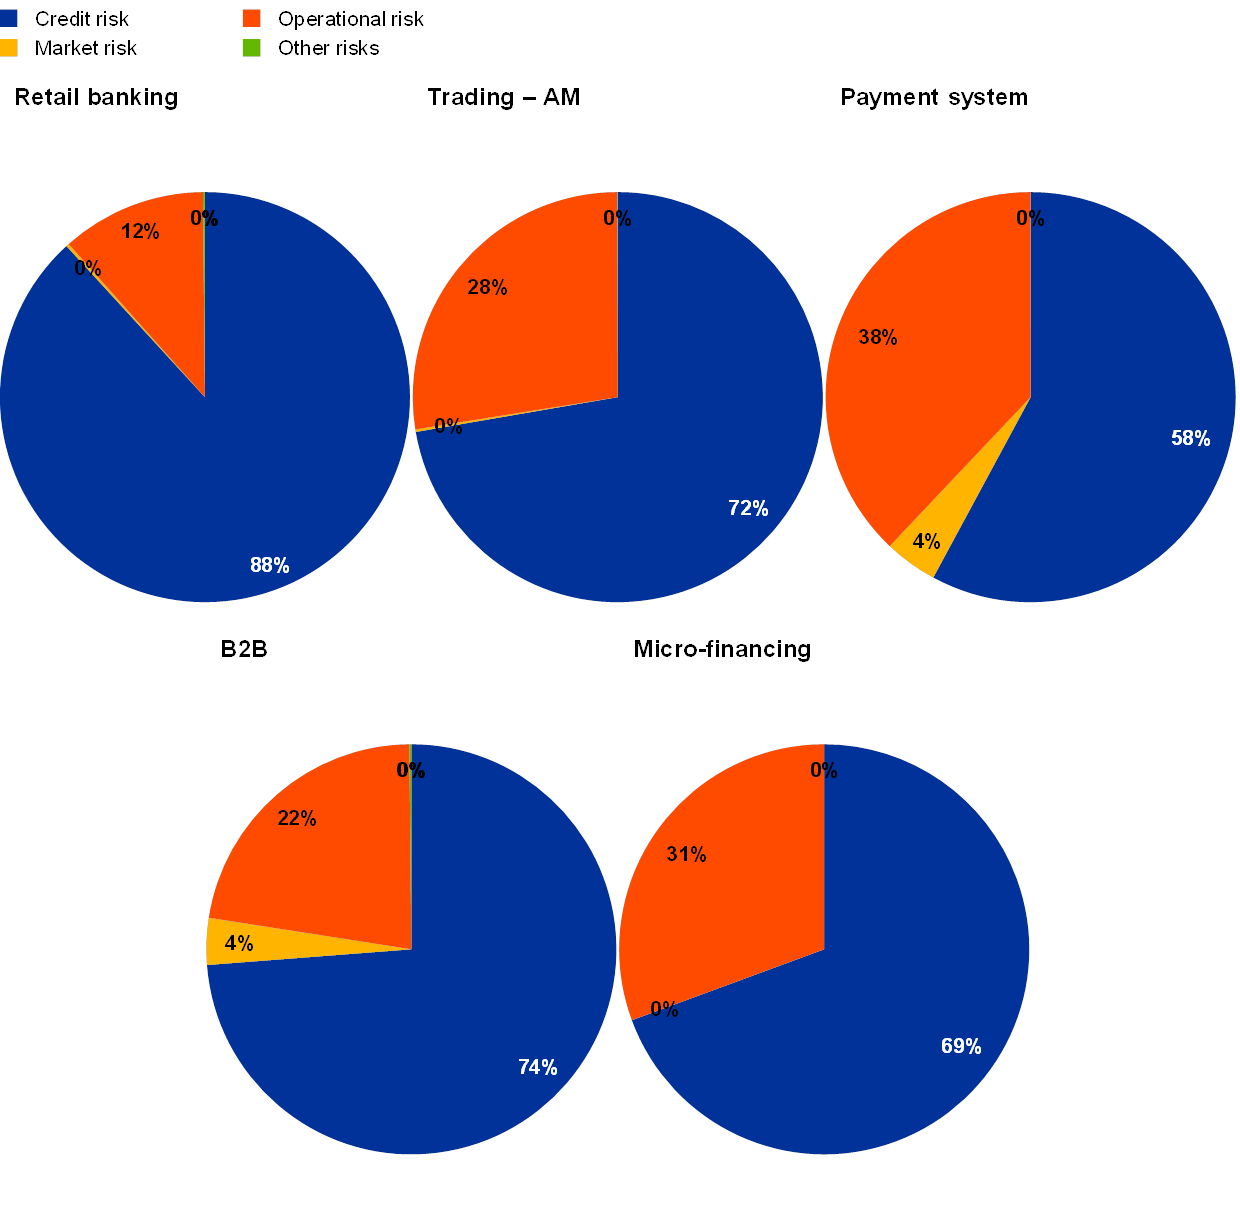
In terms of risk exposure, digital-only LSIs are primarily exposed to credit risk and operational risk (see Chart 45). While credit risk is the predominant risk driver (on average around 66% of total REA), it is operational risk that poses a particular challenge to digital-only LSIs, irrespective of their business model. On the other hand, abundant liquidity (in the form of central bank deposits) mitigates liquidity risk, while market risk remains mostly negligible.
Chart 45
Risk exposure composition at digital-only LSIs
(by primary business line)
Sources: Banks' supervisory reporting and ECB calculations.
Asset quality and solvency
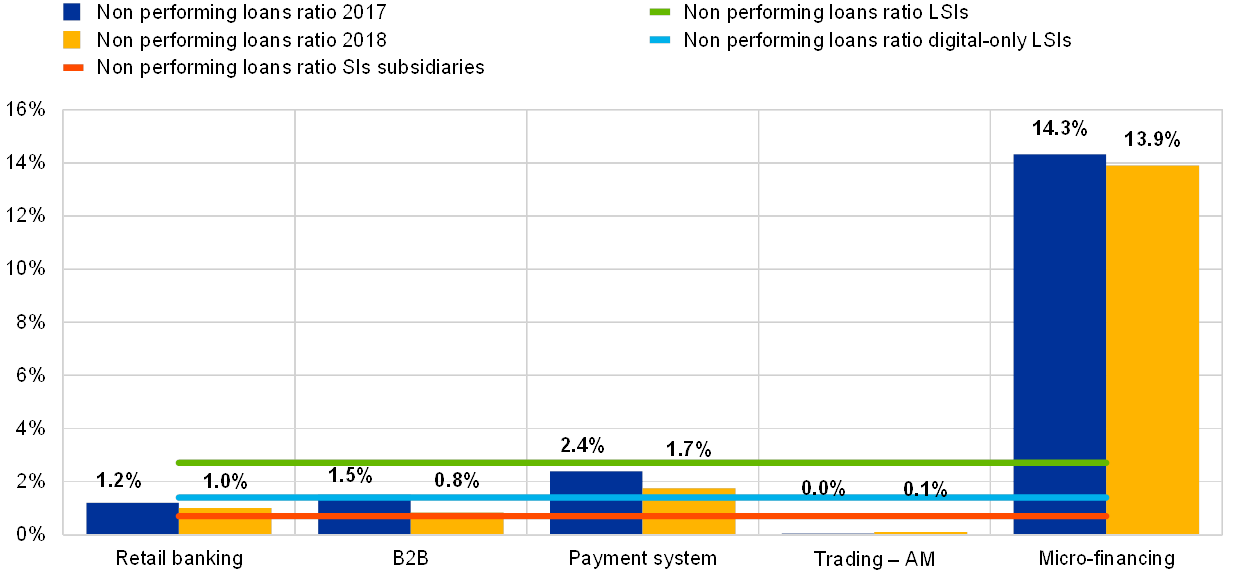
In terms of asset quality, digital-only LSIs display very low levels of NPLs, with an average NPL ratio of just 1.4% (see Chart 46) or around half that of the LSI sector and slightly above that of digital SIs (0.7%)[32]. This result is, in fact, partially driven by the low share of lending to the non-bank private sector. Entities specialised in micro-financing, which display above-average credit risk, actually have much higher NPL ratios (13.9%); however, due to the small sample size, this finding is of more limited relevance. In terms of solvency, with an average CET1 ratio of 26%, digital-only LSIs appear to be well capitalised (see Chart 47). Again, a high stock of central bank exposure and less capital-intensive activities (such as in the payment system business) contribute to low REA and thus extraordinarily high solvency ratios. Nonetheless, five banks in the sample lag behind the average solvency ratios of the wider LSI sector.
Chart 46
Asset quality
Sources: Banks' supervisory reporting and ECB calculations.
Chart 47
Solvency ratio
Sources: Banks' supervisory reporting and ECB calculations.
Operational risk
Representing as much as 31% of total REA, operational risk is of considerably higher relevance for digital-only LSIs than for the rest of the LSI sector (see Section 1.5.1), with the corresponding figure in the sample of digital SIs at just 7%. This is also reflected in the supervisory assessment of risks, where digital-only LSIs scored significantly higher than the rest of the LSI sector for this particular risk category. Digital-only LSIs face operational risk stemming from several sources (see Table 8). The use of innovative technologies and still incomplete operational structures (particularly at recently established banks), the strong reliance on third party products and services (e.g. cloud computing or data for automated credit scoring), reinforce these banks’ operational risk profile. Finally, the application of robo-advisory services through complex algorithms results in an enhanced need for transparency regarding their functioning, accuracy and robustness to strong market volatility. As such, digital-only LSIs' affinity for complex technologies such as artificial intelligence, machine learning or cloud computing requires supervisory attention to be shifted towards additional components of operational risk.
Table 8
Specific operational risk components related to the use of financial technologies
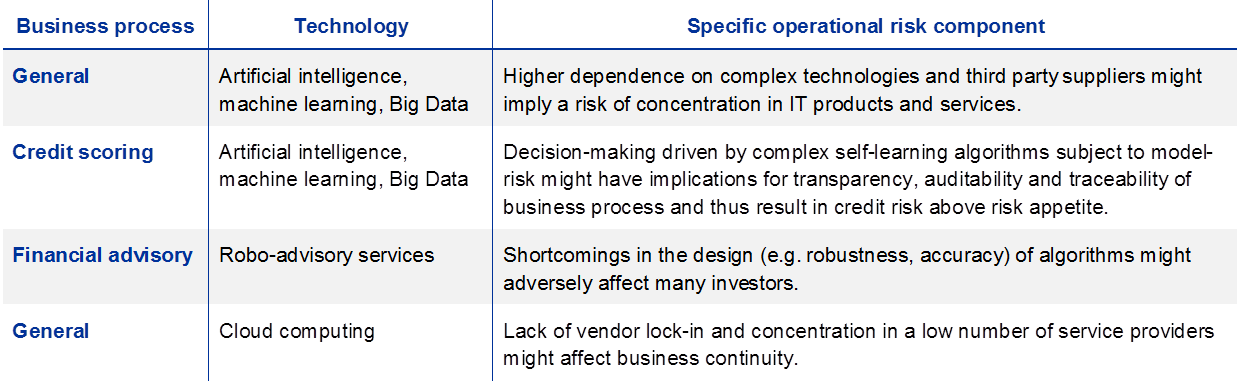
Source: SSM Fintech Supervision (First Batch).
Digital-only LSIs aim to keep organisational structures as lean as possible through automatisation. In practice, on-site inspections conducted by some NCAs revealed a number of vulnerabilities such as insufficient staffing, outsourcing management and shortcomings in the IT infrastructure. In addition, recent large-scale cyber incidents at some digital-only LSIs highlighted the possible shortage of customer service availability attributable to rapid growth of the customer base and the over-reliance on automated procedures. Such events, if repeated more frequently, could easily jeopardise the reputation of a bank and even trigger a rapid outflow of deposits, most of which are only placed overnight.
Back-testing of digital-only LSI business plans
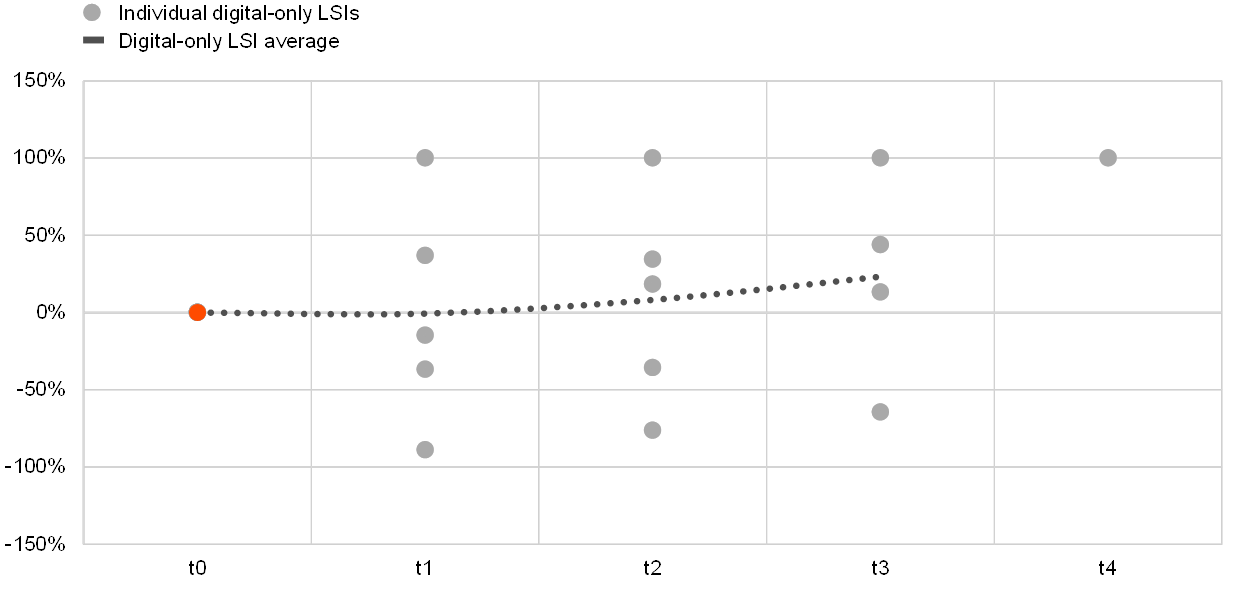
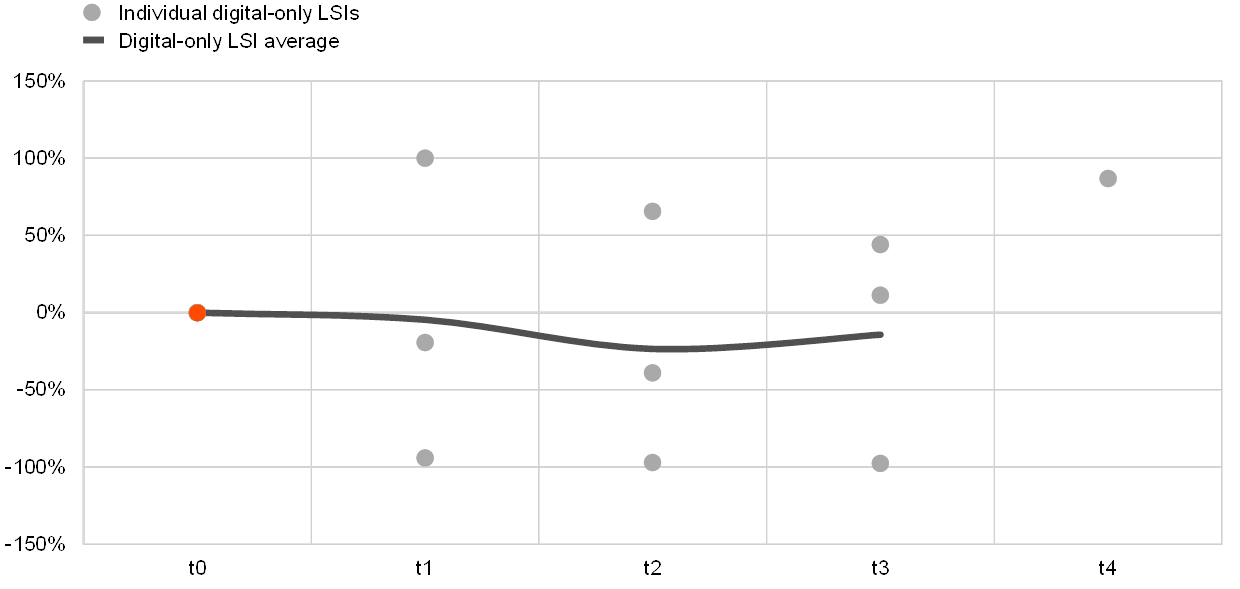
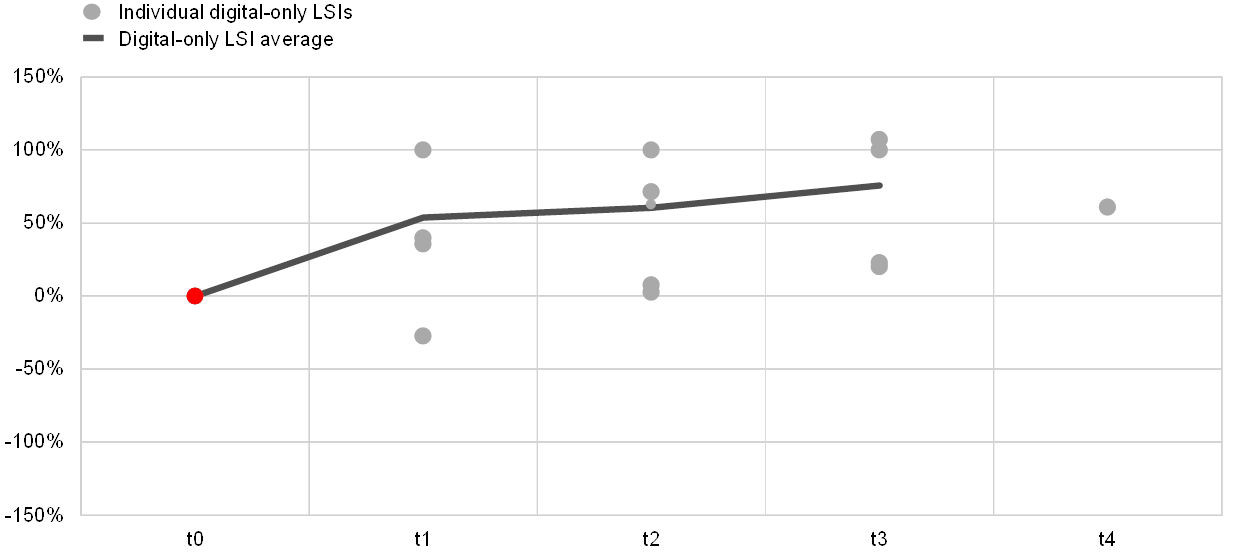
The following section describes the back-testing of the business model plan submitted by a sample of five digital-only LSIs, all of which went through a qualifying holding procedure or received a banking licence from the ECB/respective NCA in the period between 2014 and 2017. [33] The aim of this analysis is to assess the reliability of these business plans by comparing banks’ own projections with realised figures for the same key metrics (e.g. size of assets, volume of deposits, net profit and operating expenditures). Accuracy is measured as the ratio between the realised values and the corresponding forecast figure at each reference period (see Charts 48 to 51). A ratio above (below) zero indicates underestimation (overestimation) of the original business plan compared with the realised figures.
The data show that, on average, the banks covered in the analysis experienced a total asset growth beyond expectations. By contrast, they missed their ambitious targets for deposit collection (by 14%). In terms of net profits, most digital-only LSIs underperformed their forecasts, already set rather conservatively and particularly inaccurate for the second and third year. Indeed, almost all banks in the back-testing exercise missed their projections of overhead costs, sometimes by very large margins, thereby missing the overall profit targets set out in the business plan.
Chart 48
Total assets
(realised/estimate)
Sources: ECB calculations for LSI reporting (for realised figures) and common procedures business plan (for estimated figures).
Notes: Each dot represents the percentage deviation between the realised value and the estimated forecast by a given LSI. This ratio is always capped at +/- 100%, implying there might be multiple dots at the extreme of the range. The dotted line represents the simple average of the realised/estimated ratio for all available LSIs in each period.
Chart 49
Total deposits
(realised/estimate)
Sources: ECB calculations for LSI reporting (for realised figures) and common procedures business plan (for estimated figures).
Notes: Each dot represents the percentage deviation between the realised value and the estimated forecast by a given LSI. This ratio is always capped at +/- 100%, implying there might be multiple dots at the extreme of the range. The dotted line represents the simple average of the realised/estimated ratio for all available LSIs in each period.
Chart 50
Net profit
(realised/estimate)
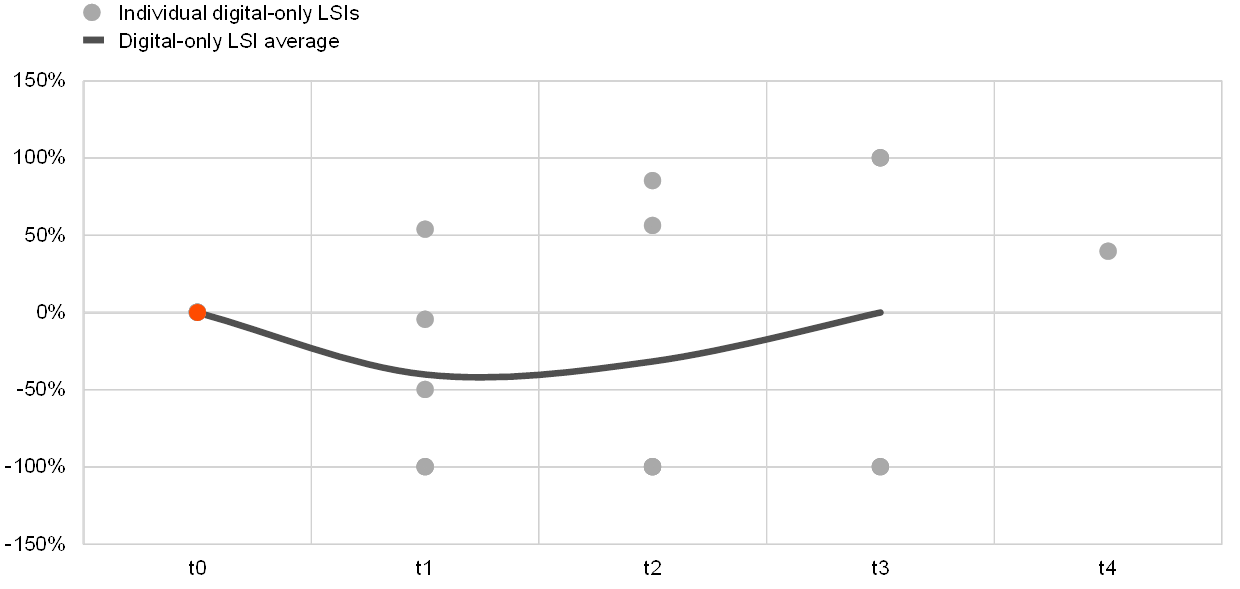
Sources: ECB calculations for LSI reporting (for realised figures) and common procedures business plan (for estimated figures).
Notes: Each dot represents the percentage deviation between the realised value and the estimated forecast by a given LSI. This ratio is always capped at +/- 100%, implying there might be multiple dots at the extreme of the range. The dotted line represents the simple average of the realised/estimated ratio for all available LSIs in each period.
Chart 51
Overhead costs
(realised/estimate)
Sources: ECB calculations for LSI reporting (for realised figures) and common procedures business plan (for estimated figures).
Notes: Each dot represents the percentage deviation between the realised value and the estimated forecast by a given LSI. This ratio is always capped at +/- 100%, implying there might be multiple dots at the extreme of the range. The dotted line represents the simple average of the realised/estimated ratio for all available LSIs in each period.
Conclusions
Although still very small, digital-only LSIs are rapidly expanding. Taking advantage of the single market and the growing appetite for digital services, these banks are opening up businesses in several EU markets and are gradually gaining market share. Some types of business, in particular those specialised in payment systems and B2B financial technology services to other companies, are proving very profitable and may soon exert pressure on established banks.
On the other hand, purely retail-oriented banks among digital-only LSIs are struggling to make profits. These banks are squeezed between the low interest revenues on their assets (mostly placed with the central bank) and the need to offer competitive accounts, meaning cheap and easy to use, to attract customers from the more established banks. Furthermore, the need to retain high non-staff related expenditure (e.g. IT, marketing) has placed a great burden on their current finances. Until this paradigm of low income and high costs is broken, these LSIs may struggle to create a viable business model and therefore to challenge the dominance of incumbent banks.
Nonetheless, it is still premature to discard the digital-only business model from the world of retail banking. Although there is no breakdown for data on other administrative expenses, a higher share of non-staff expenditure (20 percentage points higher than the rest of the LSI sector), points to investments such as brands and technologies that could drive future profitability. Moreover, by investing mostly in safe assets, these banks are currently disproportionately penalised by the negative interest rate policy, which may, however, reverse at some point in the future, thereby alleviating the drag on profitability. Furthermore, evidence from the SI universe shows that incumbent banks have found a beneficial answer to the threat posed by Fintech entities in the retail sector, with most of the subsidiaries included in this analysis boosting above-average performance both in terms of cost management and revenues. Thanks to their larger scale, these banks have possibly already reached sufficient economies of scale to make their digital-only strategy sustainable.
Finally, compared to the average LSI, digital-only banks are subject to heightened operational risk, specifically stemming from challenges that could emerge from using innovative technologies and the relative novelty of a few digital players with still incomplete operational structures.
Annex I — Methodological principles for quantitative analysis
The following annex outlines the methodological principles for the calculation of indicators/benchmarks applied in this report.
Reference period
The reference period for the report is December 2018, unless otherwise indicated.[34] Moreover, data for banks which do not close their balance sheet at year-end (e.g. LSIs whose parent entities are based in Canada or the United States) were subject to transformations.[35]
Cut-off date
The report refers only to data available to the ECB and concerning the population of LSIs and SIs as of 30 July 2019.
Scope of consolidation
Data in the report refer to banks at the highest level of consolidation, in accordance with the list of supervised entities, meaning in line with the scope of consolidation as set out by the Capital Requirements Regulation.
Scope of analysis
All existing LSIs and SIs at the end of each period (e.g. at end‑2018, end‑2017, end‑2016, etc.), as determined by the list of supervised entities, are included in the sample. However, in order to minimise distortions related to moves to and from the LSI sector, institutions that changed their significance status at any point in time between 2014 and 2018 are reclassified, including for retrospective periods according to their latest significance status (e.g. an LSI which becomes an SI in 2018 would also be reclassified as an SI for all of the previous periods).
Furthermore, LSIs classified as branches and as financial market infrastructures (FMI) are excluded from the computation of all indicators, unless otherwise indicated (e.g. statistics on the total number of LSIs, etc.).
Data prior to reference period 2017 Q2
Data referring to periods prior to the introduction of FinRep reporting (e.g. before 2017 Q2) are based on available national data sources which, to some extent, rely on the calculated proxy computed by the NCAs.
Summary statistics
Indicators are always expressed in terms of weighted averages by total assets, i.e. reflecting the true composition of the sector taking into account the size of the banks. In the case of indicators based on ratios, these are, however, weighted by the denominator (e.g. country ROE is the weighted average of banks’ ROE weighted by their equity, the NPL ratio is the weighted average of banks’ NPL ratio weighted by the share of loans over the total for the LSI sector, etc.).
Benchmarking
Wherever possible, each indicator/chart includes two benchmarks: the entire LSI sector and the entire SI sector. Both benchmarks are:
- based on the same reference period as the rest of data in the chart/table;
- compiled according to the same sample definition;
- compiled according to the same statistical measure (e.g. weighted average, etc.).
Annex II — Definition of business models used in the report
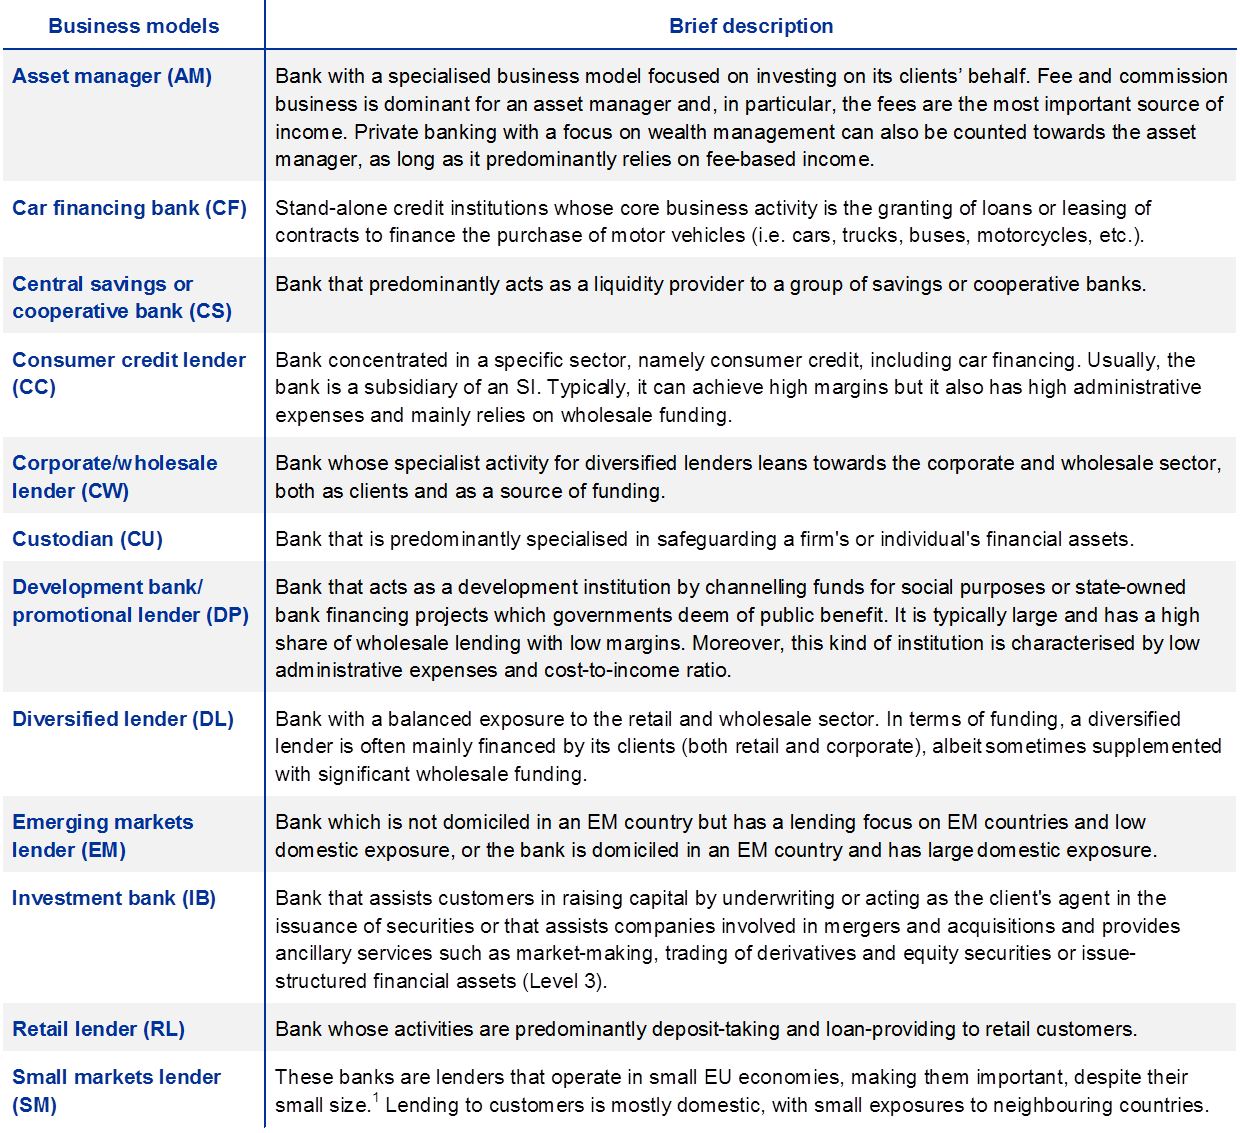
1) This category includes all SIs and LSIs in the following euro area countries (EE, LT, LV, SI and SK) as well as subsidiaries in non-euro area EU countries (BG, CZ, HR, HU, PL and RO). Banks in MT, LU and CY are not included in this classification due to their relatively large non-domestic banking activity.
© European Central Bank, 2020
Postal address 60640 Frankfurt am Main, Germany
Telephone +49 69 1344 0
Website www.ecb.europa.eu
All rights reserved. Reproduction for educational and non-commercial purposes is permitted provided that the source is acknowledged.
The cut-off date for data included in this report was 30 July 2019.
For specific terminology please refer to the SSM glossary.
PDF ISBN 978‑92‑899‑3969‑0, doi:10.2866/42772, QB‑02‑19‑910‑EN‑N
- The total number of LSIs, as of December 2018, was 2,681 – this figure includes the Italian credit cooperative banks (BCC) which, in the first half of 2019, joined the two cooperative banking groups that are considered part of the SI sector (Iccrea and Cassa Centrale Banca). To ensure the analysis accurately reflects the LSI sector at the time of publication, these 228 banks are considered as part of the SI sector (including for 2018). Furthermore, these BCCs are also reclassified as SIs for all past periods (i.e. from 2014 onwards) to avoid any break in the time series of LSI data.
- Based on solo-level data from MFI BSI statistics, which include flow adjustments data. When using consolidated data, the growth measured in 2018 is 4%.
- For a definition of excess capital see Section 1.6.
- See “ECB Banking Supervision: Risk assessment for 2020”, ECB Banking Supervision, October 2019.
- In particular, the report covers both SIs and LSIs at the highest level of consolidation and existing at the end of each period (e.g. at end‑2018, end‑2017, etc., as determined by the list of supervised entities).
- The reduction in number of LSIs during 2018 assumes that the Italian BCCs merger had taken place in 2018. For more information see footnote 1.
- These are based in France, Germany and Belgium. Given the very different nature of their business, unless otherwise specified, these entities are excluded from the analysis in this report. In France, when this exclusion is applied, the LSI sector accounts for approximately 1.5% of the country banking assets.
- There were no cross-border mergers in 2018 at the highest level of consolidation within the remit of European banking supervision.
- Including FMIs and excluding branches.
- For a definition of all business models, see Annex II.
- Based on data from the sovereign exposures template (CoRep template 33.00) – owing to a data quality issue, a total of 37 institutions were excluded from the analysis.
- The portfolio breakdown according to the accounting treatment follows the EBA methodology, except for the category “LSIs amortised cost”, which also comprises the “Non-trading non-derivative financial assets at a cost-based method”. Thus, “Other financial assets” is used as a residual category and includes “Other non-derivative financial assets”.
- SIs may have local subsidiaries with exposures on sovereign bonds of their country of incorporation. In this respect, while at the consolidated level geographical diversification may exist, the “roots” may not diverge between SI and LSI (i.e. each solo entity might invest mainly in sovereign bonds where they are incorporated or have business activities).
- ROE adjusted for the effects of nGAAP reserve for general banking risk at LSIs in Germany.
- See the “EBA Methodological Guide on risk indicators and detailed risk analysis tools ”, EBA, January 2016.
- According to the official EBA guidelines on management of non-performing and forborne exposures “Credit institutions with gross NPL ratios at a level of 5% or above should establish an NPE strategy, as part of their overall strategy, and related governance and operational arrangements”. For more information, please refer to Final report-Guidelines on management of non-performing and forborne exposures.
- Netting out the effect of the deposit facility (where banks place their excess liquidity) from central bank funding would lead to a ratio of net central bank funding to total liabilities for the LSI sector of just 1.7%.
- Outliers are identified when their use of central bank operations as a share of total liabilities is five times the LSI sector average.
- Owing to the importance of operational risk for FMIs, this section of the report includes data for all FMIs belonging to the LSI sector.
- The concept of excess CET1 capital (fully loaded) is defined as the difference between capital supply in terms of fully loaded CET1 capital minus the minimum regulatory requirements (excluding Pillar 2 guidance).
- Definition applied to identify digital-only LSIs: “Digital-only LSIs are innovative banks that use primarily digital channels (e.g. online, mobile apps, etc.) to serve their existing and new clients. These banks do not have branches nor maintain a network of private bankers, while relying on new technologies for managing interactions with their customers.”
- Recently, a number of digital banks caused some disruptions mainly owing to the non-availability of customer services following phishing incidents and fraud transactions, which led to the discontinuation of payment services by a number of other banks.
- This definition excludes also those LSIs which use the customer base of their parent company, typically captive banks from the real economy sector (e.g. supermarket chains, mobile phone operators, etc. ) to acquire new clients.
- All digital-only LSIs licenced after or shortly before December 2018, for which year-end data are not available, were thus excluded.
- Fintech, as defined in the Guide to assessments of Fintech credit institution licence applications.
- This group is by no means a fully exhaustive list of all digital-only SIs. It is only a benchmark for this analysis with the focus being on LSIs. Furthermore, only the subsidiaries of SIs — where solo reporting data are available — could be included in the analysis. As such, those digital SIs or LSIs which are fully integrated into their main parent company (i.e. with no separate legal entity) were not included in this analysis.
- The primary business line was inferred from the documentation available (e.g. business model description by NCAs, website material, etc.) and is therefore an approximation.
- This category also includes banks that support digital deposits collection platforms in cooperation with Fintech.
- This difficulty may partially be alleviated by the introduction of new monetary policy measures in the euro area starting from November 2019.
- See Beaudemoulin et al., “Etude sur les modèles d’affaires des banques en ligne et des néobanques”, ACPR, Analyses et synthèses, No 96, December 2018.
- While this figure is driven down by a single large digital-only LSI, the value for the rest of digital-only LSIs would be 66%, still well below the value for the rest of the LSI sector.
- When considering the core NPL ratio, i.e. excluding lending to government and financials, the ratio rises to 4%.
- To assess the financial soundness of an applicant entity (authorisation) or the target entity in an acquisition (where the acquisition would result in a qualifying holding of 50% or more), a business plan, including financial statements estimated for a period of at least three years, is to be submitted to the supervisor. See EBA, “Joint Guidelines on the prudential assessment of acquisitions and increases of qualifying holdings in the financial sector”, Chapter 3, p. 26.
- This is different from the cut-off date, which marks the last date on which new information (e.g. received from NCAs via data resubmissions) is considered for the analysis.
- The following assumptions are applied: for P&L items, data are linearly rescaled to year-end by multiplying them for a conversion factor greater than one (i.e. in the case of accounts closed in September, the relevant P&L items are multiplied by four-thirds). For stock variables (e.g. total deposits, total capital, etc.), data are treated as if they were year-end (i.e. the value reported for the fourth quarter of 2018 is assumed to be the December value, irrespective of the closing date of the balance sheet).