Aggregated results of SREP 2021
1 Introduction
1.1 Back to a full SREP cycle
ECB Banking Supervision went back to a full SREP cycle in 2021, having adopted a pragmatic approach to its SREP assessment in 2020 in response to the extraordinary circumstances at the onset of the coronavirus (COVID-19) pandemic. That pragmatic assessment in 2020 had focused on banks’ handling of the challenges stemming from the pandemic and had kept Pillar 2 requirements (P2Rs) and Pillar 2 guidance (P2G) unchanged at 2019 levels. Thus, the 2021 SREP cycle saw a full capital assessment (see Chapter 2), the assignment of SREP scores to banks’ overall risk profiles and their main elements (see Chapter 3), and the issuance of formal decisions, rather than just recommendations (see Chapter 4). Supervisors focused their assessments on elements identified as supervisory priorities for 2021 (see Chapter 5).
The 2021 SREP cycle was conducted in the context of projections anticipating that output would return to pre-pandemic levels by mid-2022, following the record fall in economic activity in the initial stages of the pandemic. The macroeconomic environment stabilised further in 2021 and macroeconomic forecasts improved in the course of the year. At the time of writing, the euro area economy has already returned to pre-pandemic levels, and economic growth is projected to remain strong over the next three years. However, there is still uncertainty regarding the future evolution of the pandemic (particularly as regards the spread of new variants of the virus), and supply chain disruption is currently weighing on trade and overall economic activity. There are also other risks on the horizon stemming from a broad range of uncertainties, including (i) the possibility of cyberattacks, (ii) climate-related and environmental risks, and (iii) the potential for a disruptive end to the low interest rate environment characterised by interest rate and/or credit spread shocks, resulting in abrupt asset price corrections. At the same time, a number of challenges (both cyclical and structural) are continuing to weigh on the profitability of Europe’s banking sector.
The results of the 2021 SREP cycle reflect the resilience of Europe’s banking sector amid the strengthening economic recovery, as well as the risks and vulnerabilities that are foreseen further down the road.
SREP scores remain broadly stable overall, with significant institutions (SIs) maintaining solid capital and liquidity positions and most banks going beyond the levels dictated by capital requirements and guidance.
Concerns about risks on the horizon are reflected in qualitative findings and measures, primarily in the areas of risk management and internal governance, where supervisors looked at the broader quality of banks’ internal risk control frameworks and the effectiveness and diversity of banks’ management bodies. In particular, supervisors focused on the adequacy of credit risk processes in order to prevent, where possible, any excess build-up of non-performing loans (NPLs) on banks’ balance sheets. Although banks’ risk profiles did not deteriorate significantly overall, supervisors downgraded several credit risk scores in relation to concerns about the adequacy of provisioning and other credit risk processes.
As previously announced, the 2021 SREP cycle saw supervisors tackle legacy issues relating to stocks of non-performing exposures (NPEs). The introduction of a P2R add-on dealing specifically with situations where supervisory expectations for NPE provisioning were not being met led to a marginal increase in capital requirements, coupled with a marginal increase in capital guidance, on the back of the significant downside risks identified by the 2021 stress test. We have already communicated to banks that if they address shortfalls in NPE provisioning in the course of 2022, they can quickly obtain relief from the P2R add-on, without waiting for the next SREP cycle.
1.2 ECB relief measures
The normalisation of the SREP was accompanied by a review of some of the other supervisory measures that the ECB had adopted in response to COVID-19.
In July 2021 the ECB decided not to extend its dividend recommendation beyond the envisaged end date in September 2021. That decision was taken on the basis of banks’ improved capital trajectories, given the robust economic rebound seen since the ECB initially made the recommendation in 2020. Banks were asked to remain prudent when deciding on dividends and share buy-backs, carefully considering the sustainability of their business models. Until 30 September 2021, banks limited their dividend payments in line with the ECB’s recommendation. Although there was some catch-up in distributions after 30 September 2021, pay-out ratios have, on average, remained similar to pre-COVID levels. All in all, ECB Banking Supervision’s dividend recommendation proved to be effective. The retention of dividends at the height of the pandemic increased capitalisation levels, putting banks in a good position to weather the prevailing uncertainty. Moreover, in December 2021 the ECB indicated that it would not extend its liquidity relief beyond the end of that month and expected all banks to maintain a liquidity coverage ratio in excess of 100% as of 1 January 2022. Banks have ample liquidity buffers: in December 2021 the aggregate liquidity coverage ratio of banks under direct ECB supervision stood at around 170%, up from about 140% before the pandemic.
The newly developed methodology for assessing the risk of excessive leverage will be used in 2022 to identify institutions which might need Pillar 2 requirements or qualitative measures in respect of the leverage ratio, given the new requirements stemming from Capital Requirements Directive V (CRD V) and Capital Requirements Regulation II (CRR II) as of June 2021. That methodology aims mainly to capture contingent leverage risk originating from extensive use of derivatives, securities financing transactions, off-balance sheet items and regulatory arbitrage.
In February 2022, the ECB indicated that it would not extend its leverage ratio relief measure for banks. Thus, banks are expected to go back to including central bank exposures in the leverage ratio exposure measure as of 1 April 2022. Banks have ample headroom above the leverage ratio requirement, with the aggregate leverage ratio of banks under direct ECB supervision standing at 5.88% at end-September 2021.
In 2021 banks were given the flexibility to dip into their capital buffers, and that will continue throughout 2022. However, in February 2022, against the backdrop of improving macroeconomic conditions, the ECB indicated that it did not expect to extend its prudential relief measures regarding banks’ use of capital buffers beyond the minimum time frame that had already been communicated. Thus, as of 1 January 2023 the ECB expects banks to operate above the level resulting from their combined buffer requirement and Pillar 2 guidance. Early communication of the ECB’s expectations should give institutions time to meet their P2G targets and design appropriate capital plans. The ECB will keep monitoring economic and financial developments to see if there is a need to reconsider this approach, and it will take appropriate and proportionate steps if need be.
2 Capital requirements and guidance
2.1 Key messages
Overall capital requirements and guidance[1] increased slightly in 2021, averaging around 15.1% of risk-weighted assets (RWAs), compared with 14.9% in the pragmatic 2020 SREP assessment.
Total Pillar 2 requirements increased from 2.1% in 2020 to 2.3% in 2021, mostly on account of the introduction of new NPE provisioning shortfall add-ons. Banks’ individual P2Rs for 2022 are shown on a dedicated web page.
Pillar 2 guidance also increased by 20 basis points on average (rising from 1.4% in 2020 to 1.6% in 2021) in relation to the increased capital depletion signalled by the 2021 stress test. P2G is a bank-specific recommendation which indicates the level of capital that the ECB expects an institution to maintain (in addition to its binding capital requirements) in view of the outcome of a stress test.
The increase in average Pillar 2 requirements and Pillar 2 guidance was partly offset by a decline in the average countercyclical capital buffer, which was negligible in 2021, having stood at 0.2% of RWAs in 2020.
Chart 1
Overall capital requirements and guidance
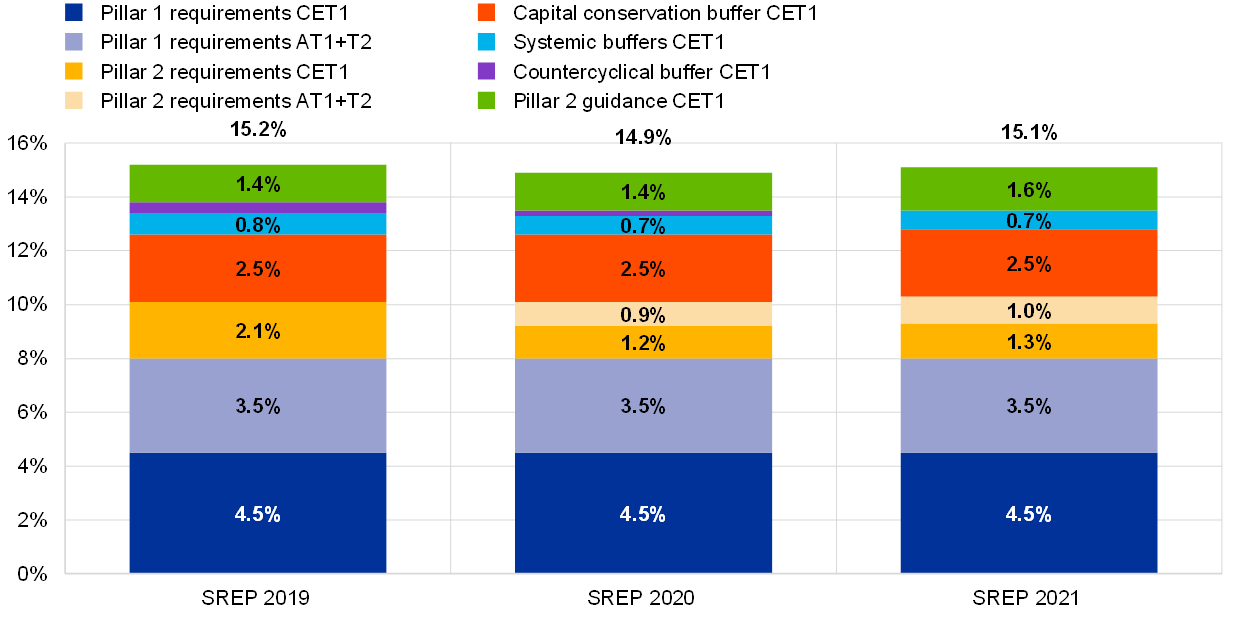
Sources: SREP 2021 values based on 108 decisions; SREP 2020 values based on 112 decisions; SREP 2019 values based on 109 decisions.
Notes: “Overall capital requirements” means Pillar 1 + Pillar 2 requirement + capital conservation buffer + systemic buffers + countercyclical capital buffer. Pillar 2 guidance is added on top of overall capital requirements. Under CRD V, which came into effect on 1 January 2021, P2R capital should have the same composition as Pillar 1 – i.e. at least 56.25% should be in CET1 and at least 75% should be in Tier 1 as a minimum requirement.
The average amount of overall capital requirements and guidance in CET1 increased to around 10.6% of RWAs in SREP 2021, up from 10.5%. However, that remains well below the figure for the 2019 SREP cycle, owing to the new rules on the composition of P2R capital[2] which came into force in 2020 (with ECB Banking Supervision bringing them forward by a year as part of its COVID-19 capital relief measures).
Chart 2
Overall capital requirements and guidance in CET1
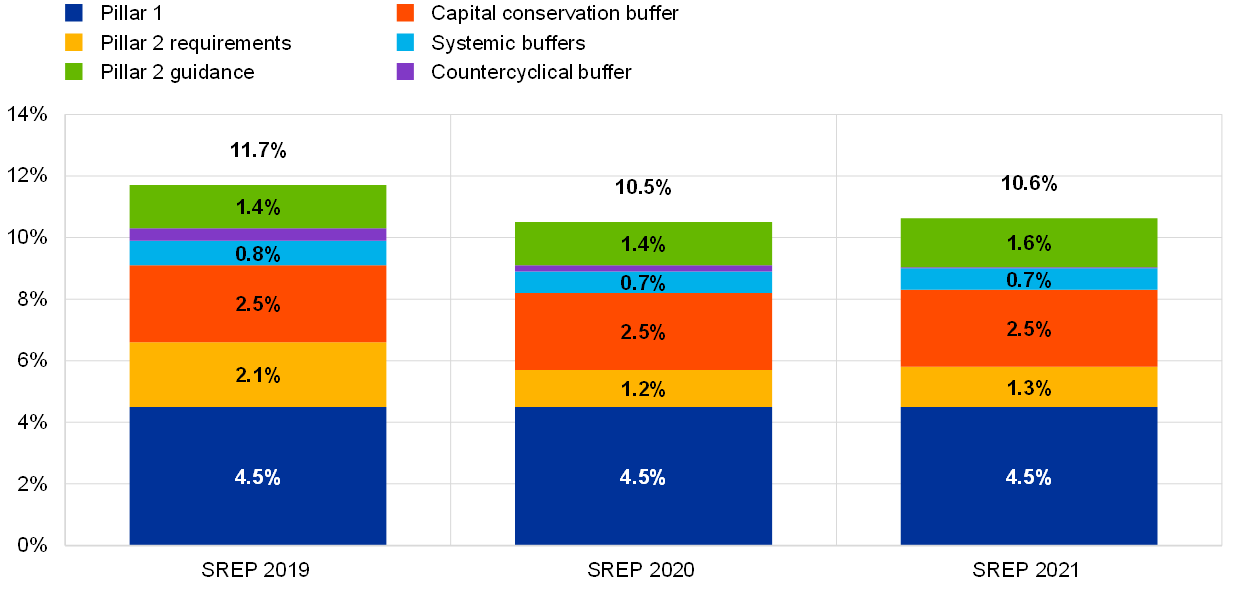
Sources: SREP 2021 values based on 108 decisions; SREP 2020 values based on 112 decisions; SREP 2019 values based on 109 decisions.
Notes: “Overall capital requirements” means Pillar 1 + Pillar 2 requirement + combined buffers. Under CRD V, which came into effect on 1 January 2021, P2R capital should have the same composition as Pillar 1 – i.e. at least 56.25% should be in CET1 and at least 75% should be in Tier 1 as a minimum requirement.
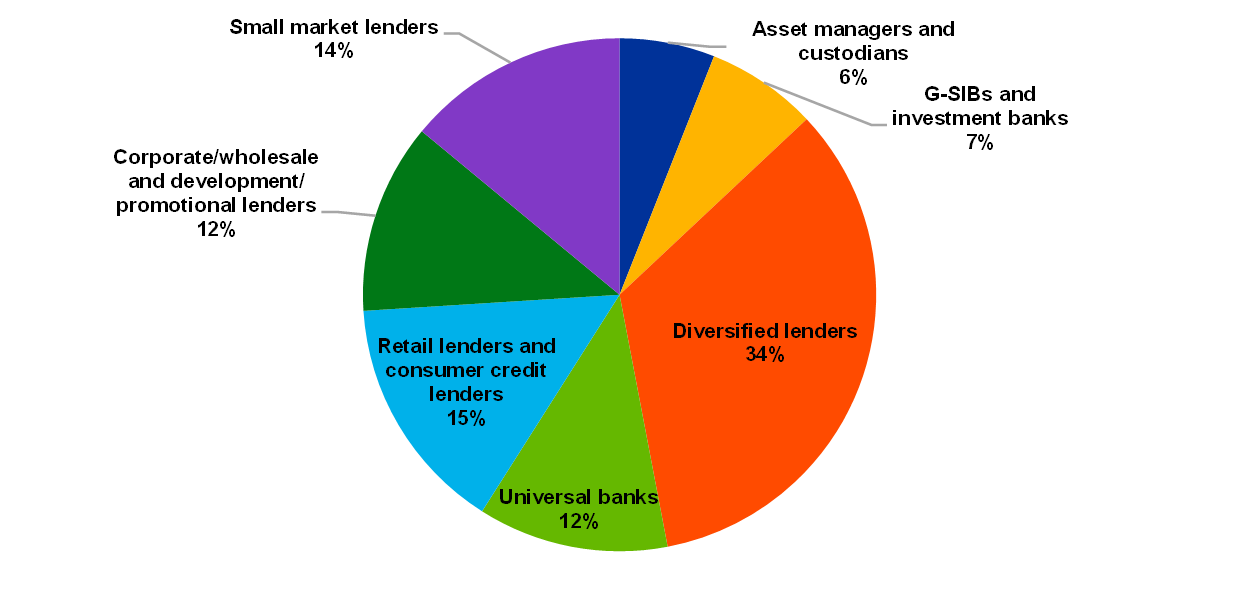
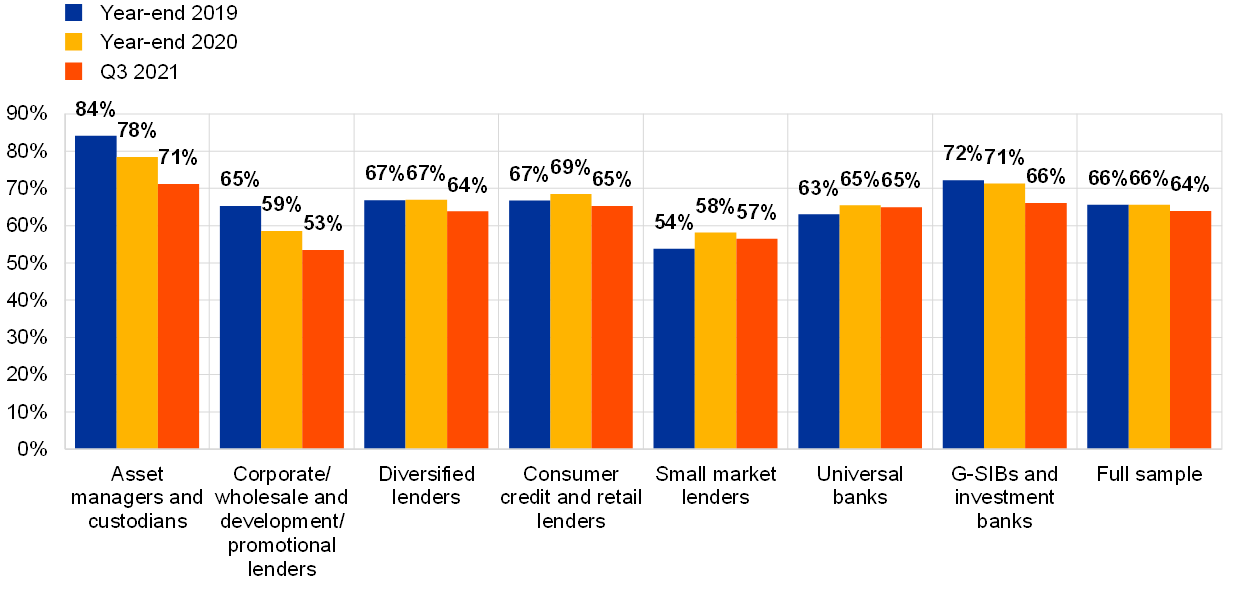
When looking at the distribution by business model, overall capital requirements and guidance[3] are higher for small market lenders, global systemically important banks (G-SIBs) and investment banks, and diversified lenders.
Chart 3
Breakdown of overall capital requirements and guidance by business model
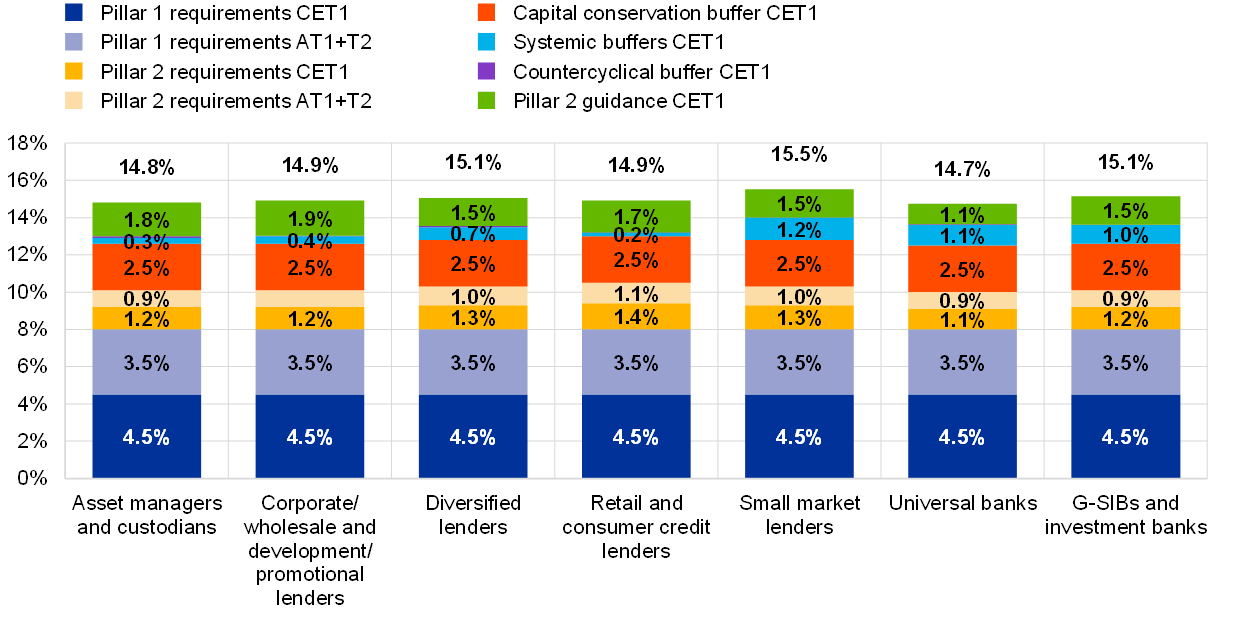
Source: SREP 2021 values based on 108 decisions.
Notes: “Overall capital requirements” means Pillar 1 (8%) + Pillar 2 requirement + capital conservation buffer + systemic buffers + countercyclical capital buffer. Pillar 2 guidance is added on top of overall capital requirements.
2.2 NPE Pillar 2 requirement add-on
The ECB’s NPE coverage expectations became applicable as of end-2020. Joint supervisory teams (JSTs) discussed the implications of those expectations with banks as part of the supervisory dialogue. This included (i) assessment and discussion of bank-specific circumstances that warranted divergence from the ECB’s expectations and (ii) any post-reference date reductions in the shortfall relative to expectations as a result of increases in provisions, CET1 deductions, full write-offs and/or NPE disposals.
The final outcome of the supervisory dialogue was taken into account in the SREP, as a considerable number of SIs took action to reduce their shortfalls in the course of 2021, especially in the last couple of quarters. The aggregate shortfall in NPE provisions decreased by over 75% during the year, leaving only a small number of banks subject to fairly low add-ons in the final SREP decisions (see Chart 4). While provisions are, in general, the main avenue used to address coverage expectations, CET1 deductions were the main means of adjustment used by banks in the course of 2021.
At the end of that process, 22 SIs had a shortfall relative to the ECB’s expectations and were subject to a P2R add-on as the risks arising from legacy NPEs were assessed as being inadequately covered.
Although the final SREP 2021 decisions have now been issued, banks will be able to further reduce the P2R add-ons linked to their NPE coverage shortfalls through further NPE disposals, increases in provisions and/or deductions from CET1 capital in the coming months. Indeed, in order to incentivise further progress towards compliance with its expectations, the ECB has decided that those P2R add-ons will be updated in the course of 2022 as necessary.[4]
Chart 4
Distribution of NPE P2R add-ons in basis points
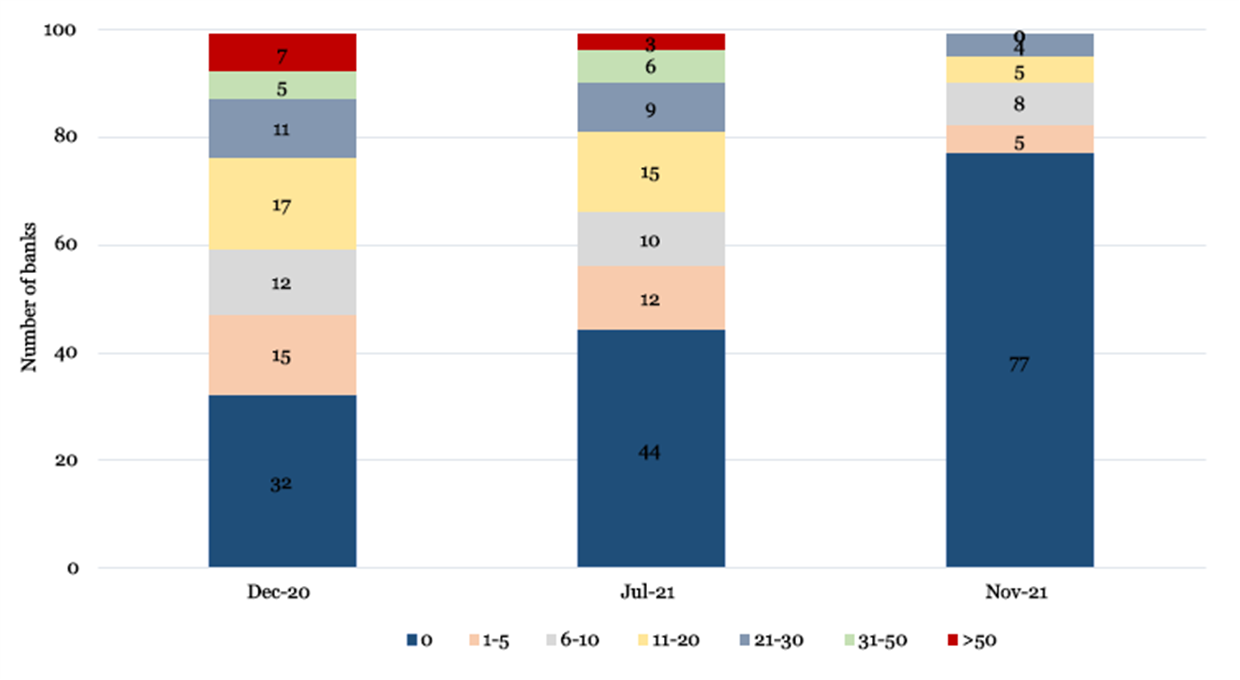
Chart 5 reports the distribution of shortfalls (after post-reference date adjustments) across business models. Development and promotional lenders have the largest shortfalls (10 basis points), while diversified lenders carried out the most post‑reference date adjustments upon finalisation of the supervisory dialogue (around 30 basis points).
Chart 5
Reductions in P2R shortfalls by business model
(in billion Euros)
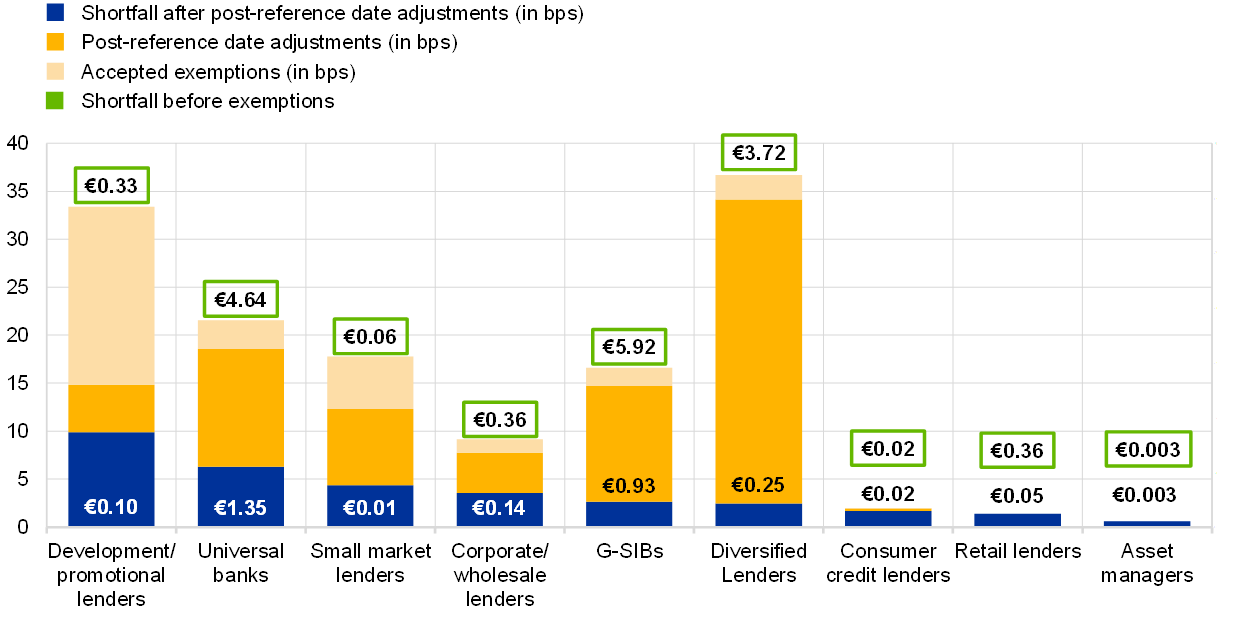
Source: SREP 2021 values based on 99 decisions.
3 Evolution of scores
3.1 Key messages
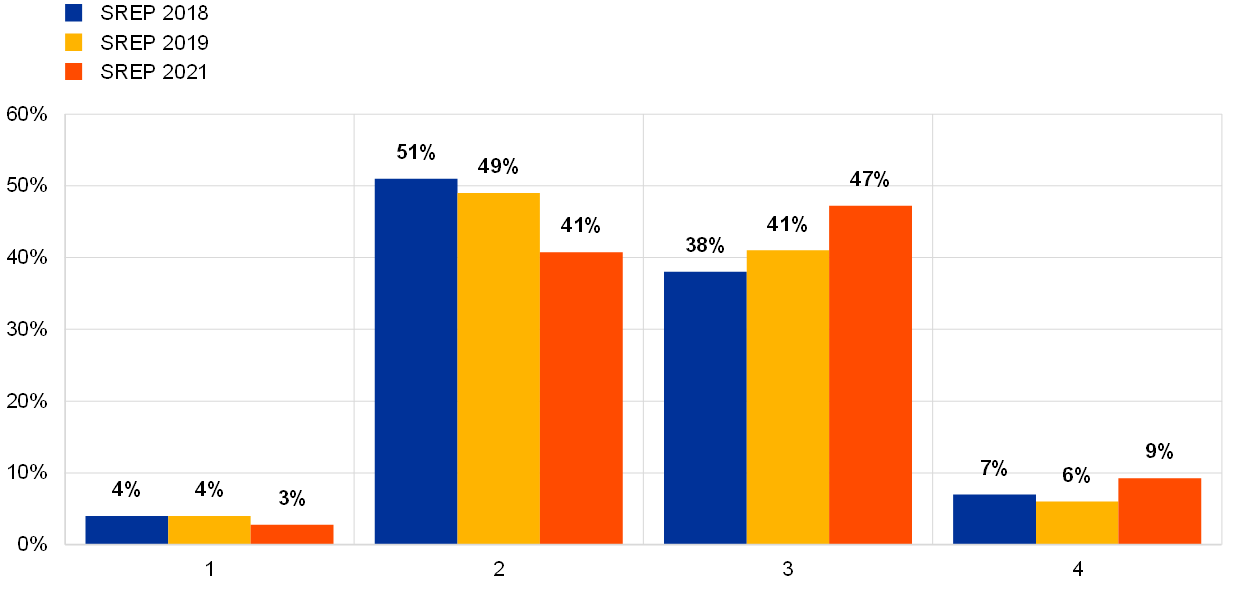
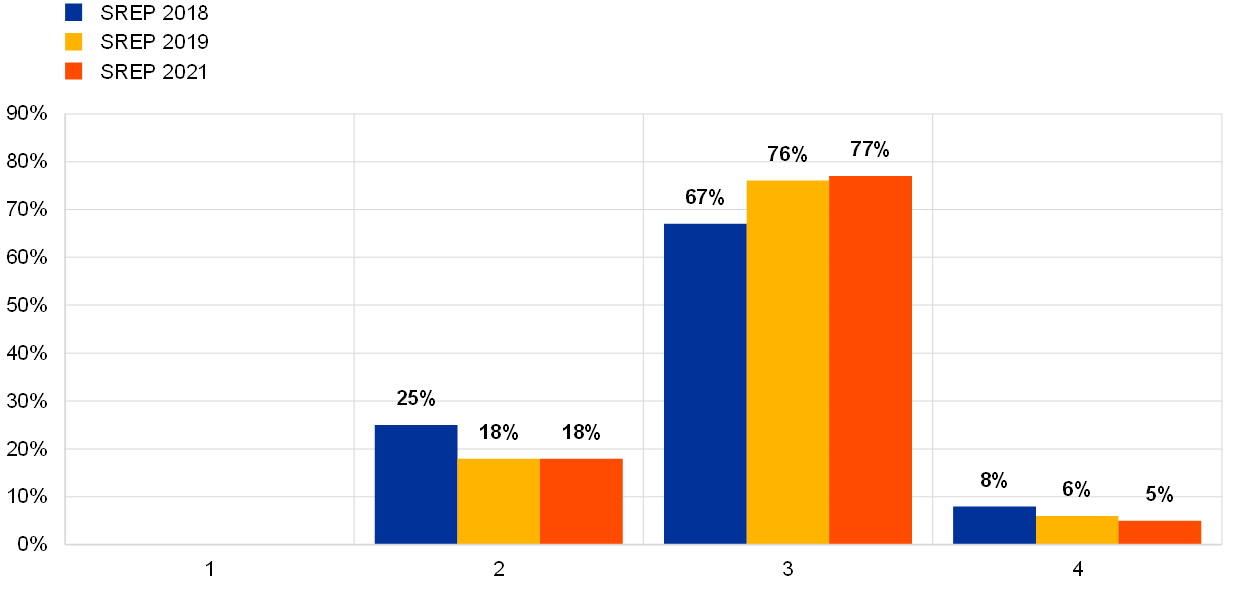
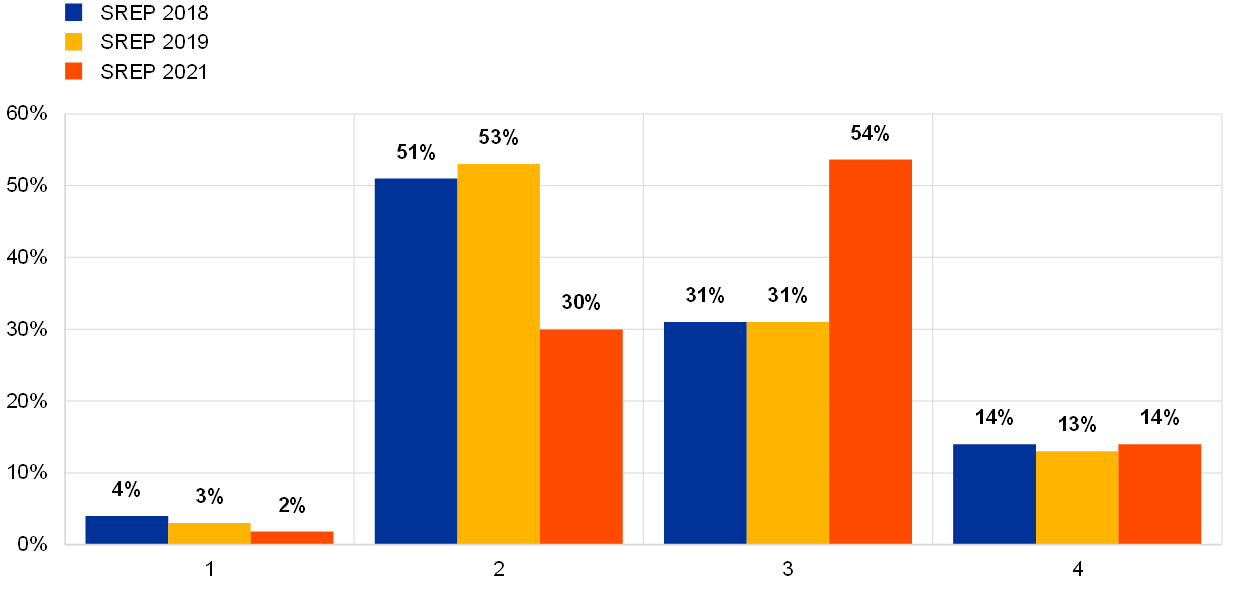
The SREP 2021 scores are broadly stable relative to the 2019 ones[5], as the average overall SREP score remained largely unchanged. In a way, these results are a sign of the banking system’s resilience and the success of the unprecedented support measures deployed by national and European authorities, since banks’ overall scores might well have deteriorated significantly during the pandemic. Back in March 2020, banks and supervisors both faced unprecedented levels of uncertainty, which led supervisors to suspend most components of the SREP methodology – including SREP scores – to focus on COVID-related challenges faced by banks. At the end of the pragmatic SREP 2020 process, the outlook for banks’ risks continued to be overshadowed by possible cliff effects relating to the expiry of debt moratoria and other support measures. Since then, uncertainty has progressively decreased over time as the European economy has stabilised and macroeconomic forecasts have improved (which has been largely thanks to continued support from national and European authorities). As a result, the average overall SREP score for 2021 remained broadly stable relative to those of previous cycles (see Charts 6 and 7), with only a minor decline relative to 2019 in the percentage of banks scoring 2 and, accordingly, a minor increase in the percentage of banks scoring 3 (see Chart 6).
Chart 6
Overall SREP scores for 2018, 2019 and 2021
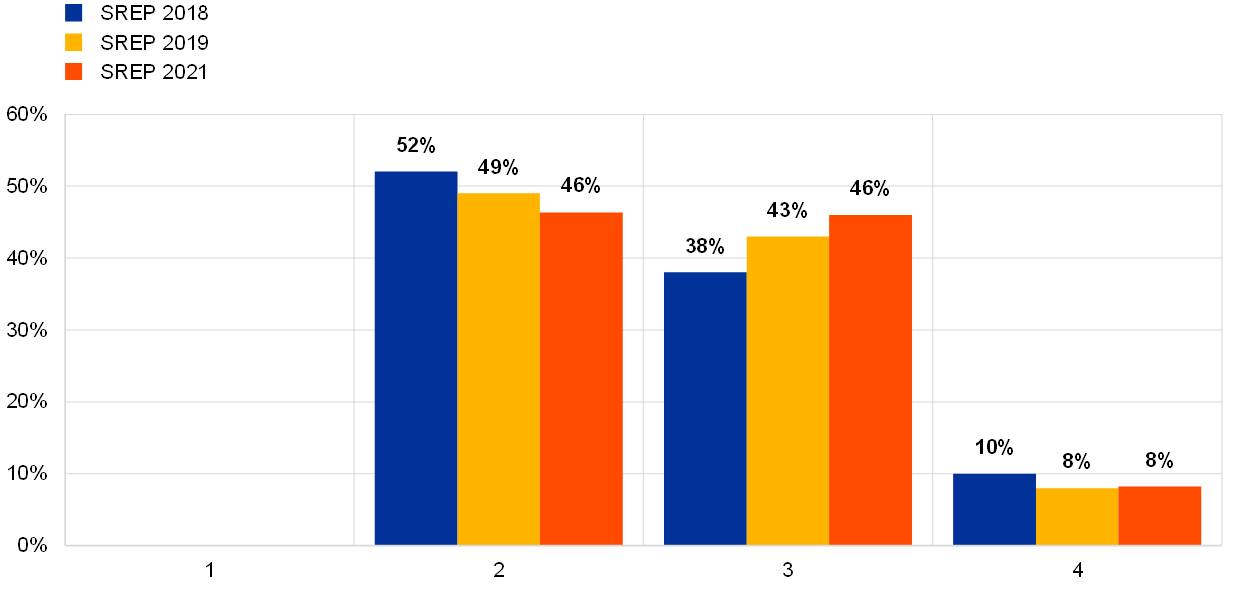
Sources: SREP 2021 values based on 108 decisions; SREP 2019 values based on 109 decisions; SREP 2018 values based on 107 decisions.
Note: Some changes in the distribution of scores reflect slight differences in the composition of the SREP sample from one year to another.
The broad stability of the average overall SREP score reflects the fact that, looking only at banks that were assessed in both 2021 and 2019, the majority of those banks (64%) had unchanged scores relative to 2019 (see Chart 7), while equal percentages of banks saw their scores improve and deteriorate (18% for each).
Chart 7
Changes to banks’ overall SREP scores in 2021 relative to 2019

Note: This chart is based on a subsample of banks that were assessed in both SREP 2019 and SREP 2021 (i.e. it differs slightly from Chart 6 in that regard).
Nevertheless, supervisory work focusing on banks’ credit risk control capabilities led to a deterioration in credit risk-specific scores in SREP 2021. Supervisors remain concerned that banks’ risk control frameworks are not always sufficient to deal with potential challenges and have requested significant remedial plans (see also Section 5.3).
Notwithstanding positive anecdotal evidence of cost restructuring, refocusing of business models and consolidation initiatives in recent years, persistent weaknesses in banks’ business models led to a slight deterioration in business model-specific scores (see also Section 5.1).
3.2 Breakdown by business model
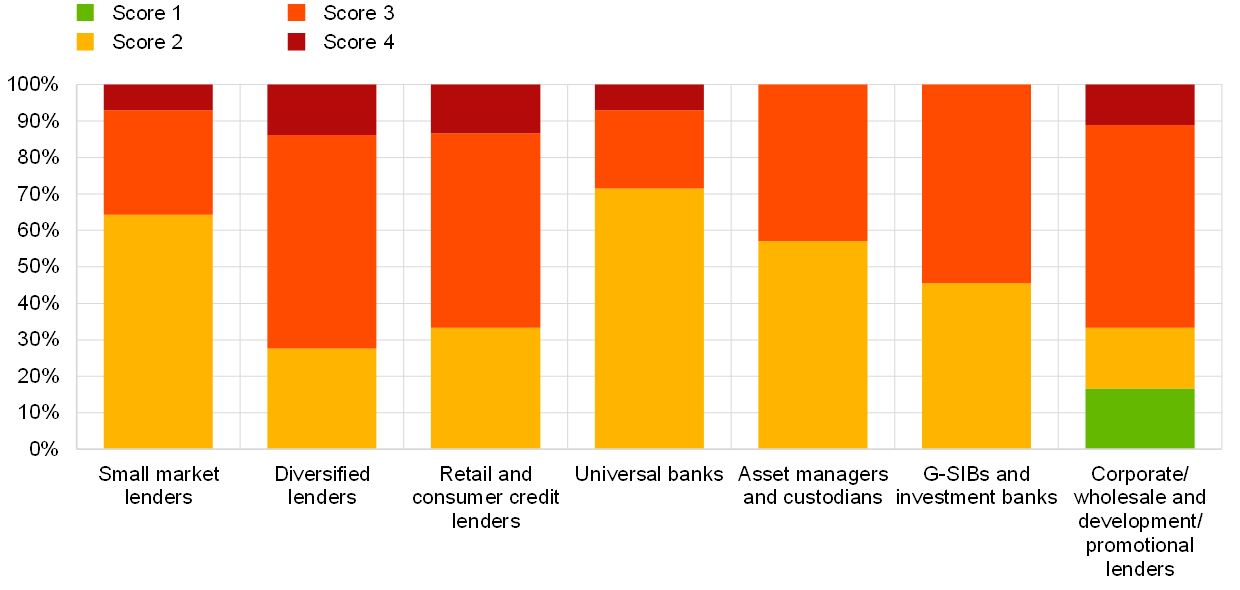
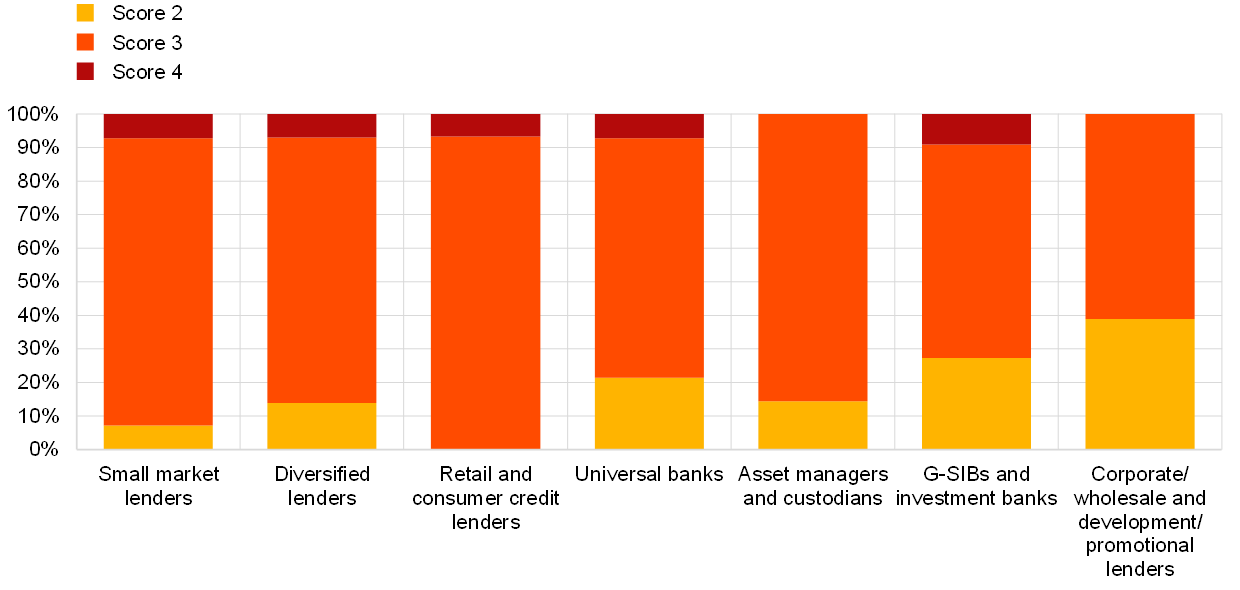
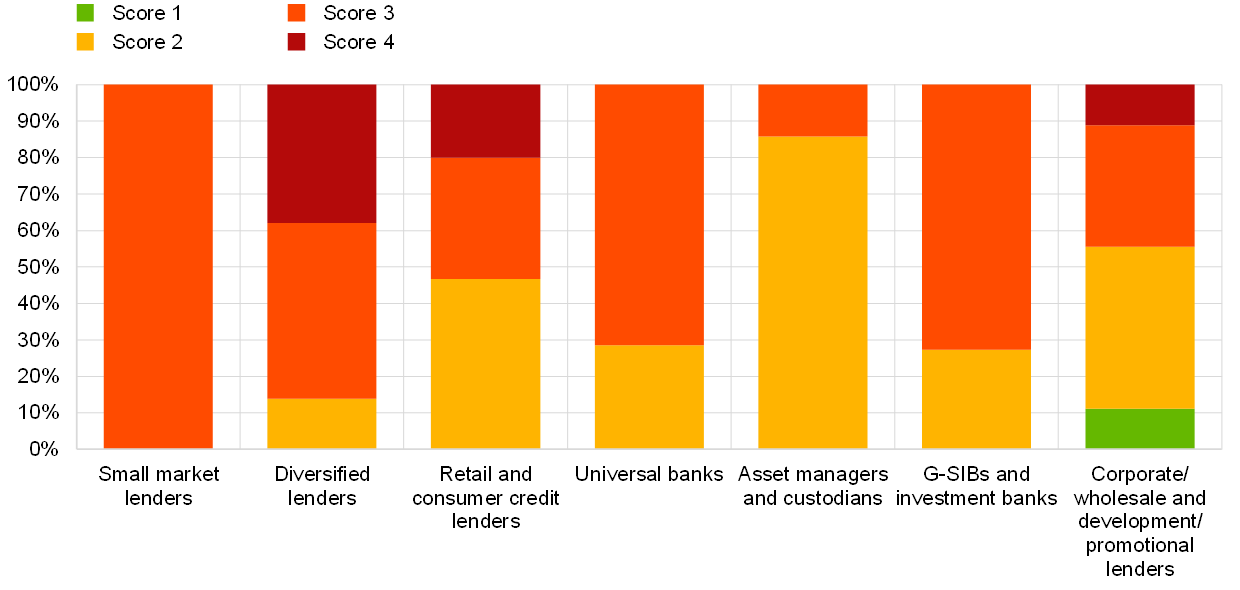
The chart below shows the distribution of overall SREP scores in 2021 across significant institutions with different business models.
- For all business models, there was a slight increase in the number of banks scoring 3 and a decrease in the number of banks scoring 2.
- The overall SREP scores for universal banks, asset managers and custodians, and small market lenders are concentrated in 2 and 3.
- G-SIBs and retail lenders are highly concentrated in score 3.
- There are two types of business model with banks scoring 4: diversified lenders and corporate/wholesale and development/promotional lenders. Diversified lenders still have the highest proportion of banks scoring 4 across the various business model categories, despite marginal improvements as a result of individual institutions addressing some of the structural challenges that they have faced in previous years.
Chart 8
Breakdown of overall SREP scores by business model in 2021
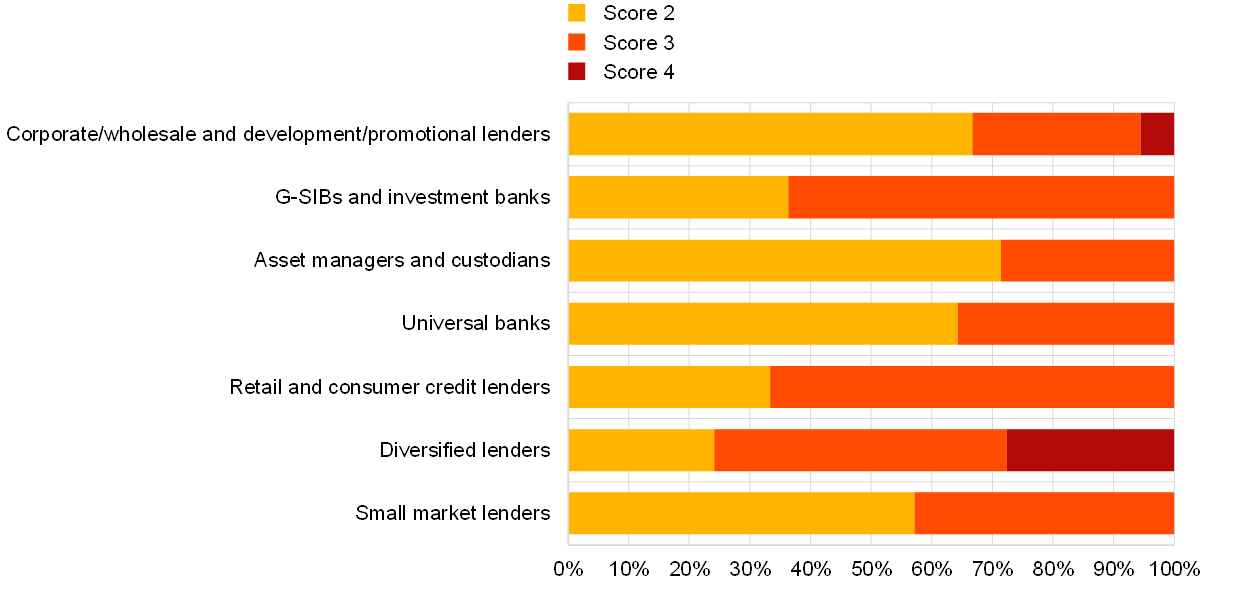
Source: SREP 2021 values based on 108 decisions.
4 Qualitative measures
4.1 Key messages
The vast majority of SIs[6] were asked to implement qualitative measures in response to their supervisory findings (103 banks, or 95% of the SREP 2021 sample). Compared with the SREP 2020 cycle, there was an increase in the total number of measures requested of banks.
The measures requested broadly reflected the areas of concern that had been identified in the SSM’s supervisory priorities for 2021:
- The number of internal governance and risk management measures increased by 25% compared with the previous year, with those types of measure continuing to be the most common (accounting for 31% of all measures; see Chart 9). All in all, 75% of SIs were asked to implement such measures – the highest percentage across all types of measure.
- The number of credit risk measures also increased, making up 26% of total measures. 70% of SIs were asked to implement such measures. The severity of the underlying findings also increased year on year, reflecting greater supervisory scrutiny of credit risk management practices.
- Measures relating to business models accounted for 9% of the total. They declined in number relative to 2020 but remained well above 2019 levels. Most measures sought to address the limited progress made by banks in respect of structural weaknesses in their business models.
- Capital adequacy measures remained broadly stable, accounting for a limited share of total measures (14%). Such measures were requested of banks as part of a targeted review of capital plans and dividend distributions.
Chart 9
Qualitative measures in 2019, 2020 and 2021
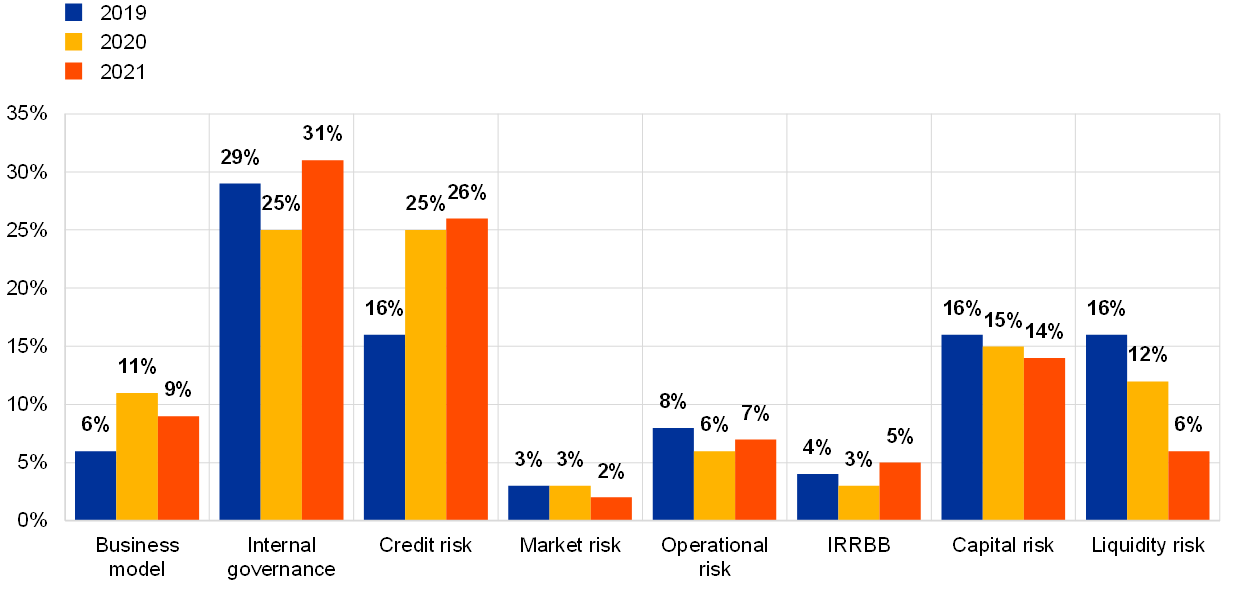
Sources: SREP 2021 values based on 108 decisions; SREP 2020 values based on 112 decisions; SREP 2019 values based on 109 decisions.
4.2 Distribution of qualitative measures in SREP 2021
Chart 10 shows a breakdown of SREP 2021 measures by business model. Diversified lenders have the highest concentration of SREP measures (>7 measures per bank on average), with increases in the numbers of findings relating to internal governance and credit risk. Corporate/wholesale and development/promotional lenders and G-SIBs and investment banks have the lowest concentration (<5 measures per bank on average).
Chart 10
Breakdown of qualitative measures by business model
Source: SREP 2021 values based on 108 decisions.
Note: This chart does not include weaknesses which may have already been addressed by supervisory actions outside of the context of SREP 2021.
More than half of all measures were requested of banks with an overall SREP score of 3 (51% of the total; see Chart 11), while 13% were requested of banks scoring 4.
Among banks with a score of 4, credit risk measures were the most common. 33% of those measures were requested of banks scoring 4, compared with just 14% for banks scoring 2.
For further information on qualitative measures, please refer to Chapter 5.
Chart 11
Distribution of 2021 qualitative measures by risk score
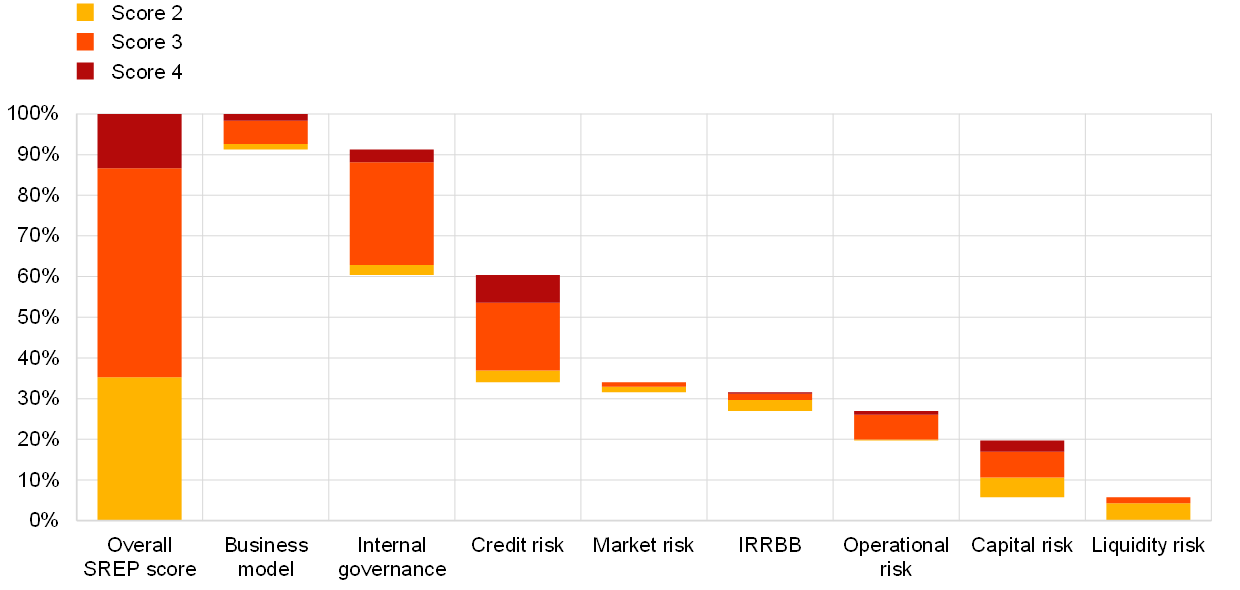
Source: SREP 2021 values based on 108 decisions.
Note: This chart does not include weaknesses which may have already been addressed by supervisory actions outside of the context of SREP 2021.
5 Detailed analysis of main risks
This chapter is made up of five sections focusing on the main risks identified in SREP 2021. These sections are based on the main elements of SREP 2021 (as also presented on the SREP methodology web page), which are as follows:
- Business model (Element 1)
- Internal governance and risk management (Element 2)
- Credit risk (Element 3)
- Capital adequacy (Element 3)
- Detailed analysis of other risks
5.1 Element 1: Business model
5.1.1 Key messages
Significant institutions’ business models continue to be challenged by both cyclical factors (such as low interest rates) and structural factors (such as excess capacity, low cost efficiency and growing competition from banks and non-banks alike).
Significant institutions’ profitability recovered in 2021, mainly thanks to lower impairments, but it remains structurally low overall: despite the progress achieved over the last few years, most significant institutions’ return on equity (ROE) is below the cost of capital, which impairs the capacity to issue more capital in case of need.
Supervisory concerns regarding banks’ business models were primarily associated with long-standing issues that predated COVID, such as unsatisfactory transformation/strategic plans or problems with their execution. Such concerns were the primary driver of the overall deterioration seen in supervisors’ assessment of the sustainability of banks’ business models (see Chart 12).
Chart 12
Element 1: Business model SREP scores for 2018, 2019 and 2021
Sources: SREP 2021 values based on 108 decisions; SREP 2019 values based on 109 decisions; SREP 2018 values based on 107 decisions.
Scores deteriorated for almost 20% of banks. Score increases (which were observed for 7% of banks) were associated with material progress against strategic transformation plans or the resolution of previous supervisory issues.
5.1.2 Breakdown by business model
The chart below shows the distribution of business model risk scores across significant institutions with different types of business model.
- G-SIBs are concentrated in scores 2 and 3.
- Diversified lenders, consumer credit and retail lenders, and asset managers and custodians have the highest percentages of banks scoring 4 for their business models.
Chart 13
Breakdown of business model SREP scores by business model
Source: SREP 2021 values based on 108 decisions.
5.1.3 Focus on profitability and structural factors
Following the sharp deterioration seen in average ROE in 2020, it increased significantly in the first nine months of 2021, albeit remaining below the average cost of equity and remaining structurally low overall. ROE averaged 7.2% in Q3 2021, although seasonal factors may result in a lower figure for Q4 2021. That improvement was driven largely by a reversal of the cyclical challenges arising from the COVID-19 crisis, as banks booked much lower impairments in the first three quarters of 2021 than they had in 2020. Higher net fee and commission income (NFCI) and higher net trading income (NTI) also contributed to banks’ increased profitability. Recent analysis shows that price to book (PTB) dynamics have also returned to pre-crisis levels (although they, too, remain structurally low).
Chart 14
ROE at the end of 2019 and 2020 and in Q3 2021
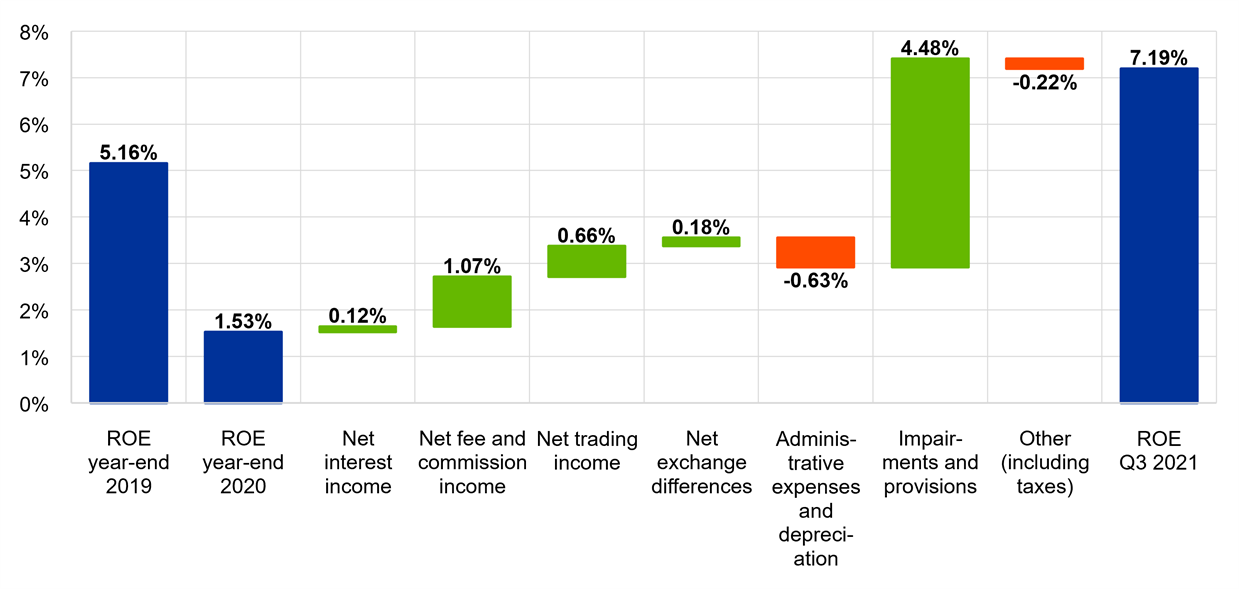
Source: Supervisory reporting.
Notes: The sample comprises 114 SIs as at Q3 2021, 112 SIs for year-end 2020 and 113 SIs for year-end 2019. The chart shows linearly annualised profitability figures. The number of SIs in each reference period reflects changes resulting from amendments to the list of SIs following assessments by ECB Banking Supervision.
A recovery in profits was observed for most business models in 2021, with the exception of small market lenders and retail and consumer credit lenders:
- Diversified lenders continued to report the lowest ROE (3.3%). However, they ceased to operate with negative profitability.
- Small market lenders remained the most profitable group (with ROE of 9.1%).
- Universal banks and G-SIBs saw their ROE increase significantly relative to 2020 (to 7.9% and 7.6% respectively), with both back above pre-pandemic levels.
Chart 15
Breakdown of ROE and cost of equity by business model

Sources: FINREP and ECB calculations.
Structural factors remain one of the key supervisory concerns for the European banking sector, as they weigh on the sustainability of banks’ profits. Operating expenses increased in 2021 relative to 2020, as some of the cost savings associated with the pandemic proved to be temporary. With the cost of risk returning to pre‑pandemic levels, concerns regarding banks’ provisions persist, as Stage 2 loans in particular have increased in certain portfolios but feature a stable coverage ratio.
Several shortcomings persist as regards business models, especially in the area of operational efficiency, despite cost-reduction efforts and increased merger and acquisition activity in pursuit of synergies. Only asset managers and custodians and corporate/wholesale lenders have achieved considerable cost savings relative to pre-pandemic levels, with both types of institution experiencing a significant decline in their cost-to-income ratio over the last two years (see Chart 16). The cost efficiency of G-SIBs also improved in the course of 2021, but the cost-to-income ratio remains above the sample average. For other business models, the decline in the cost-to-income ratio has been fairly modest, with increases in operating income more than compensating for higher operating expenses.
Chart 16
Breakdown of average cost-to-income ratio by business model
Sources: FINREP and ECB calculations.
5.1.4 Supervisory expectations
Supervisors’ attention has focused on banks’ future resilience and the sustainability of their business models. 63% of all measures in this area are related to the sustainability of business models, being driven by medium and long-term profitability challenges.
Supervisors have continued to focus on weaknesses that predate COVID (such as delays in the implementation of strategies and the need for further strategic transformation), as well as the need to adjust business plans for the impact of COVID-19 (most notably for banks whose loans books are more exposed to vulnerable sectors such as commercial real estate).
Banks’ slow progress on overhauling their business models has prompted supervisors to review their supervisory toolkit. A number of changes were made to the SREP methodology in 2021, reflecting the fact that the COVID-19 crisis had accelerated the need for banks to embrace digitalisation strategies in order to transform their business models. Supervisors are continuing to monitor banks’ practices in this area.
Chart 17
Breakdown of business model-related qualitative measures
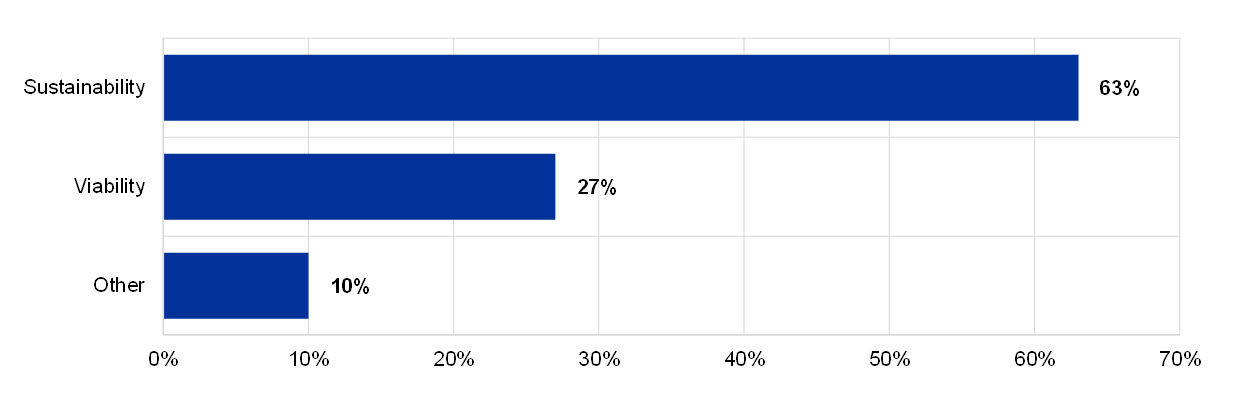
Source: SREP 2021 values based on 108 decisions.
Notes: This chart does not include weaknesses which may have already been addressed by supervisory actions outside of the context of SREP 2021. “Sustainability” refers to medium and long-term profitability, usually requiring updates to forecasts, strategic plans and financial projections, whereas “viability” refers to short-term profitability and identified weaknesses requiring rapid correction by banks. “Other” refers to other aspects, such as: delays to and/or the postponement of projects or transformation plans; management reporting; planning and processes; pricing; booking models and other policies; cost-cutting measures; digitalisation; the competitive environment; or work on tackling money laundering.
5.2 Element 2: Internal governance and risk management
5.2.1 Key messages
Despite the progress made by supervised institutions over the last few years, ECB Banking Supervision continues to report a large number of concerns regarding internal governance. The SREP 2021 findings on internal governance were clustered together in the following priority areas:
- ineffective supervision on the part of the management body, as manifested by the absence of a strong challenging culture and/or weak decision‑making;
- insufficient attention on the part of the management body to risk and compliance functions in the second line of defence, hampering their operational functionality, as well as persistent staff shortages (both qualitative and quantitative) in those same functions;
- concerns regarding the effectiveness of management bodies in terms of their composition and collective suitability, with insufficient efforts made to achieve gender diversity (absence of a diversity policy, insufficient quantitative gender targets, etc.) and slow progress in pursuing the diversity of expertise that is needed to drive strategic and sustainable business model transformation in key areas such as digitalisation;
- fragmented and non-harmonised IT landscapes, with negative consequences for data aggregation and reporting, whereby slow progress with the remediation programmes drawn up in the last few years is continuing to hamper banks’ ability to swiftly produce accurate non‑standardised ad hoc reports.
Banks’ slow progress in remedying observed shortcomings raises concerns about the effectiveness of their boards and their strategic steering capabilities. Weaknesses in the functioning of management bodies often lead to shortcomings in internal control functions and risk data aggregation and reporting capabilities.
These issues are reflected in internal governance and risk management scores. As in previous years, no bank had a score of 1 in 2021, whereas 77% of institutions had a score in the region of 3[7].
Chart 18
Element 2: Internal governance SREP scores for 2018, 2019 and 2021
Sources: SREP 2021 values based on 108 decisions; SREP 2019 values based on 109 decisions; SREP 2018 values based on 107 decisions.
5.2.2 Breakdown by business model
Chart 19 shows the distribution of internal governance risk scores across significant institutions with different business models.
- There is high concentration in score 3 across all business models.
- There are only two business models that have no institutions scoring 4: asset managers and custodians, and corporate/wholesale and development/promotional lenders.
Chart 19
Breakdown of internal governance SREP scores by business model
Source: SREP 2021 values based on 108 decisions.
5.2.3 Focus on management bodies and internal control functions
In SREP 2021, ECB Banking Supervision highlighted the following concerns regarding significant institutions’ management bodies:
- ineffective supervisory functions (absence of a strong challenging culture and/or weak decision-making) owing to small numbers of independent members, issues with the numbers of seats on boards (with excessive numbers of members in the majority of cases), a lack of expertise and excessive shareholder influence;
- a lack of involvement in the work of risk management and compliance functions, with weak monitoring and insufficient follow-up on their findings;
- inadequate management of actual and potential conflicts of interest among members of management bodies.
Issues relating to internal control functions had already been identified in previous SREP cycles, but previous findings (e.g. as regards structural understaffing, inadequate tooling hampering the quality of risk controls, and insufficient steering capacity vis-à-vis subsidiaries) had not been adequately remedied. There is a clear link between the detrimental impact of inappropriate internal control functions and issues relating to the management of credit risk. For example, ECB Banking Supervision has highlighted issues relating to (i) the identification and/or monitoring of credit risk, (ii) internal control functions’ reduced capacity to challenge the front office, (iii) shortcomings in the organisational structure of the three lines of defence, (iv) a lack of staffing in the first line of defence and (v) a lack of digitalisation for credit files.
5.2.4 Focus on diversity
Management bodies often lack an adequate policy on diversity with targets for the under-represented gender and/or fail to do enough to promote diversity. These issues often go hand in hand with inadequate succession planning. The collective suitability and diversity of management bodies is a major issue, as it is a key driver of their effectiveness.
Diversity policies span several different aspects, such as age, gender, geographical provenance, and educational and professional background. Succession policies should target the gender that is under-represented in the management body, while remuneration policies should be gender neutral and information should be available on the gender pay gap.
Nine euro area countries have national gender quotas for management bodies (albeit there are several significant institutions in those countries that do not comply with the relevant quotas). In other countries, supervised entities are left to determine their own targets.
Chart 20
National quotas for the under-represented gender in management bodies
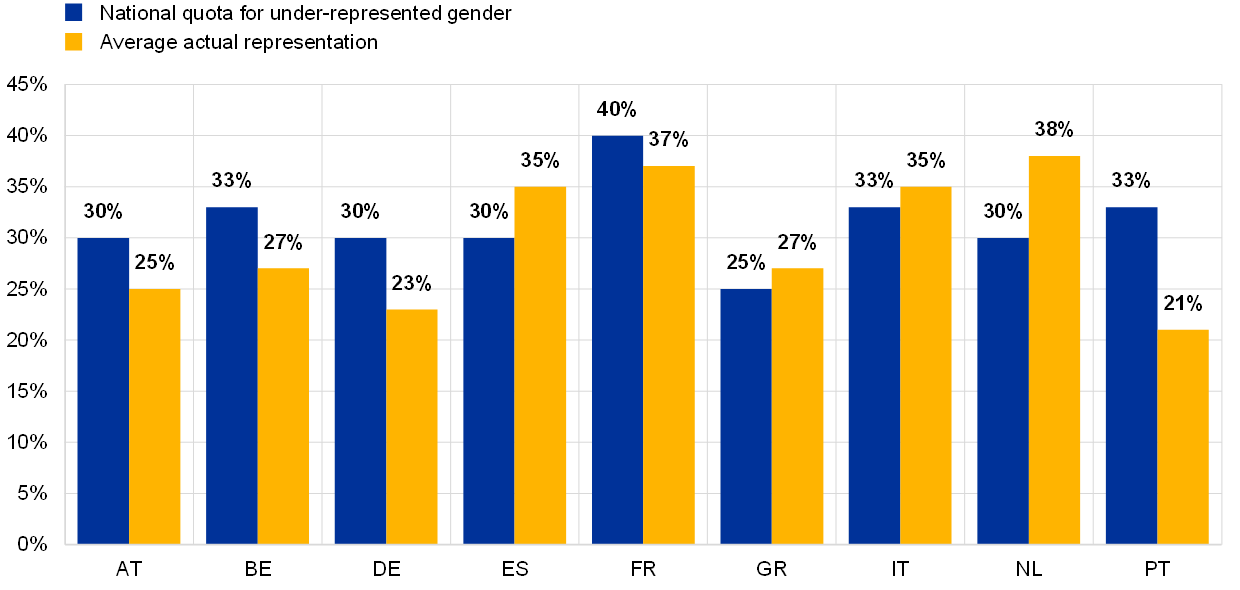
Notes: The quotas shown are based on national legislation. The scope and application of those quotas may vary, such that they are not legally binding (thereby merely acting as recommendations), represent soft laws or apply only to listed companies. The sample comprises data on 93 SIs.
Shortcomings in the area of gender balance have been highlighted by ECB Banking Supervision in past SREPs, too, as well as in the context of fit and proper assessments. In some cases, JSTs have already recommended that banks enhance diversity in the above broad sense (i.e. going beyond gender diversity), noting that a diverse management body is key to dealing with the challenges faced by banks (e.g. with regard to digitalisation). In certain other cases, supervisors will engage with banks in the course of 2022. Banks’ ability to tackle structural weaknesses in their governance will be one area of focus for the SSM in the forthcoming 2022-24 cycle.
5.2.5 Focus on aggregation and reporting of risk data
Supervisors are continuing to follow up on the findings of the thematic review on data aggregation and risk reporting, with a particular focus on this area.
Supervisory assessments have improved for quite a few banks, thanks to the remediation of deficiencies relating to governance infrastructure and reporting tools, data quality, digitalisation, compliance with the Basel Committee on Banking Supervision’s principles (BCBS 239) and the staffing of dedicated units.
However, the aggregation and reporting of risk data remains an area of concern for approximately 20% of JSTs. Banks with greater spread across geographical locations and business models are more likely to be lagging behind in this regard. Shortcomings include difficulties addressing standard and ad hoc information needs in a timely manner, a low capacity for aggregating data at group level on account of differing systems at subsidiary level, and weak IT infrastructure and risk data architecture. Data aggregation problems seem to be sustained and structural: almost all of the banks where JSTs expressed serious concerns in 2021 had already, in the previous two years, been the subject of a SREP qualitative requirement on data aggregation, an on-site inspection and/or a “deep dive”. Supervisors will continue to engage with banks in order to seek progress in this regard.
5.2.6 Supervisory expectations
In SREP 2021, the largest group of qualitative measures relating to internal governance and risk management focused on the need to improve internal control functions (29%), followed by measures relating to the management body (20%) and measures concerning IT infrastructure, data aggregation and risk reporting (13%).
There was an increased focus on remuneration in SREP 2021 following the letters sent in 2020 stressing the need for “extreme moderation”. That led to a significant increase in SREP measures on remuneration (which accounted for 8% of all measures in 2021, compared with just 1% in 2020). The issues that were addressed in that regard included performance measurement/indicators, objective setting, and risk alignment mechanisms.
Chart 21
Breakdown of qualitative measures relating to internal governance and risk management
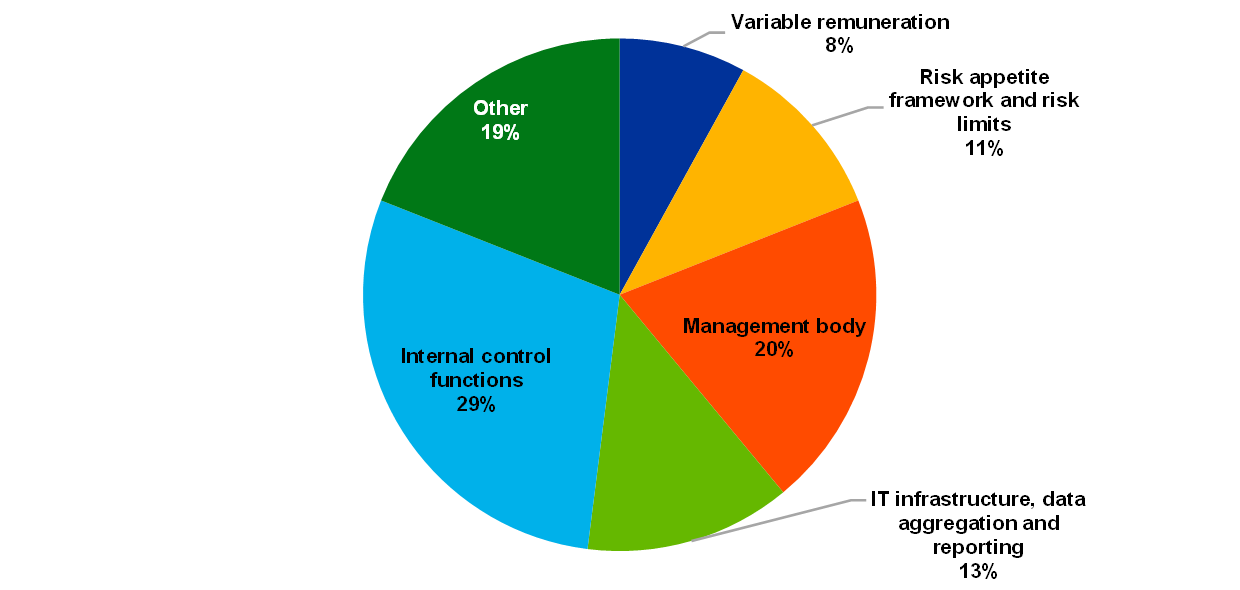
Source: SREP 2021 values based on 108 decisions.
Many of the measures relating to internal control functions focused on the structure of risk controls across group entities. For example, supervisors requested the enhancement of oversight and steering capabilities across group entities and a reduction in the dependence and/or reliance on the group’s second and third lines of defence. Several banks were also asked to strengthen the staffing of their compliance and risk management functions (both in quantitative and in qualitative terms) and to improve their control frameworks.
Moreover, some banks still need to strengthen their reporting frameworks and capabilities so that they can respond to requests from their management bodies and supervisors in a timely and accurate manner.
JSTs will follow up on the implementation of those measures in the form of regular supervisory dialogue in the next SREP cycle. Heightened supervisory scrutiny is envisaged in this area, which was identified as one of the SSM’s supervisory priorities for 2022-24, as described in Section 3.1 above.
5.3 Element 3 – Block 1: Credit risk
5.3.1 Key messages
So far, COVID-related credit risk concerns in the form of an increase in NPLs have not yet materialised, with high-level measures of credit risk showing improvement: loans covered by the EBA guidelines on loan moratoria declined further throughout 2021; NPLs also continued to decline in 2021, partly on account of increased provisioning for legacy assets (see Section 5.3.3 below) and partly as a result of specific Pillar 2 requirements where supervisory expectations for NPL provisioning were not met (see Section 2.2 above).
Nevertheless, the future dynamics of the pandemic remain uncertain. Supervisors remain conscious that the real impact of the crisis may be masked by support measures, noting increases in forbearance ratios and the growing proportion of loans in Stage 2 that have benefited from EBA moratoria or public guarantees. Also notable is the continuing increase in exposure to leveraged lending, with the associated credit standards continuing to loosen.
Supervisors have not been passive in this regard, with SREP assessments focusing on the quality of risk controls. As previously disclosed, SREP 2021 provided further evidence indicating that particular banks did not have sufficiently strong credit risk practices. While they were particularly apparent as a result of the dynamics of the pandemic, those issues were typically structural in nature. This resulted in credit risk scores being downgraded on aggregate, with a corresponding increase in the remedial actions required of banks (see Chart 22).
Chart 22
Element 3: Credit risk SREP scores for 2018, 2019 and 2021
Sources: SREP 2021 values based on 108 decisions; SREP 2019 values based on 109 decisions; SREP 2018 values based on 107 decisions.
Changes to credit risk scores were almost always downgrades: only 4% of SIs achieved a better score than in 2019, whereas 64% of SIs had the same score and 32% had a worse score.
5.3.2 Breakdown by business model
There are significant differences between business models in terms of credit risk scores:
- All small market lenders scored 3.
- G-SIBs and universal banks are concentrated in score 3, whereas asset managers and custodians are concentrated mainly in score 2.
- Corporate/wholesale and development/promotional lenders have the same proportion of institutions scoring 1 and 4.
- Diversified lenders have the largest proportion of banks scoring 4.
Chart 23
Breakdown of credit risk SREP scores by business model
Source: SREP 2021 values based on 108 decisions.
5.3.3 Focus on asset quality
Asset quality improved in 2021. By the end of September 2021, the volume of NPLs held by SIs had fallen to €402 billion (a 42% reduction relative to December 2015), albeit significant heterogeneity continued to be observed across banks. The introduction of a dedicated Pillar 2 requirement add-on for banks that have not booked sufficient provisions in line with the ECB’s coverage expectations is expected to support the continued decline in legacy NPLs.
Chart 24
NPL developments for SIs
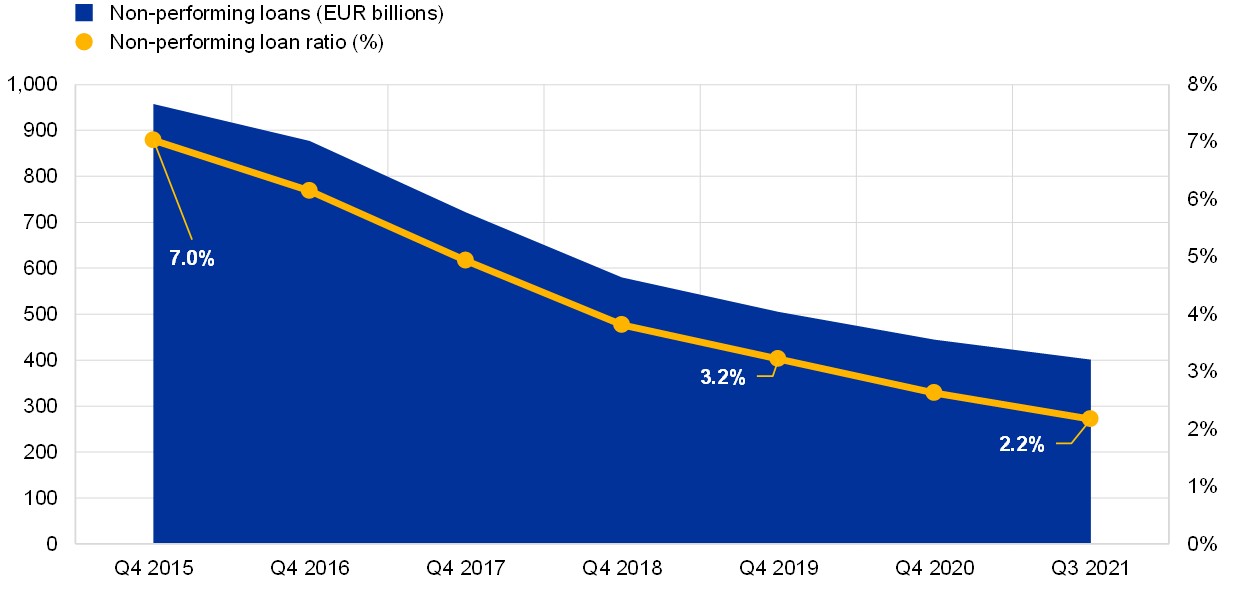
Source: Supervisory reporting.
Notes: The sample for Q3 2021 comprises 113 SIs. The number of SIs for each reference period reflects changes resulting from amendments to the list of SIs following assessments by ECB Banking Supervision.
That improvement in asset quality was supported by well-documented initiatives by national and European authorities, which sought to avoid an excessively procyclical response to the emerging crisis. The various forms of state support cushioned the impact of the economic downturn on borrowers, and the EBA guidelines on loan moratoria helped banks with the prudential treatment of those measures.
The prevalence of certain support measures declined significantly in the first half of 2021. Only 0.36% of loans to households and non-financial corporations (NFCs) were covered by moratoria at the end of Q3 2021, signalling a rapid tail-off (with that figure having stood at 2.44% in Q4 2020 and 4.57% in Q3 2020).
Chart 25 shows the status of banks as at Q3 2021 in terms of the proportion of assets that are classified as performing and non-performing exposures with forbearance measures, differentiating between (i) exposures covered by EBA loan moratoria and (ii) exposures with other COVID‑19 forbearance measures.
Chart 25
Core asset quality ratio (household and NFC portfolios)
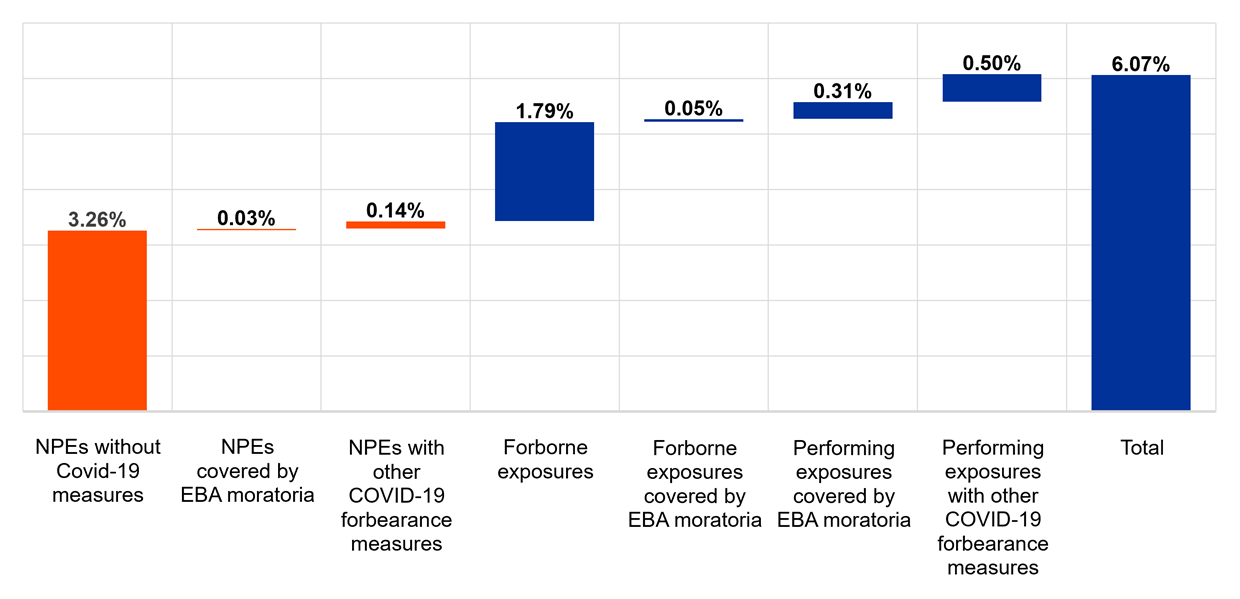
Source: FINREP.
Note: This chart indicates banks’ reported status as at Q3 2021.
The proportion of forborne exposures increased only modestly in the first half of 2021. The continuation of state support in its various guises means that identifying underlying distress can be a challenge. State-guaranteed facilities totalled more than €370 billion in Q2 2021, up from €183 billion a year earlier. Counterintuitively, NFC defaults declined year on year in 2021, showing that support measures are, to some extent, delaying or masking the underlying issues. It is therefore important that banks look beyond support measures and consider the underlying profiles of exposures, taking appropriate action at the earliest possible juncture. It was for this reason that the SREP assessment of credit risk focused on risk controls.
5.3.4 Focus on credit risk controls
The extensive supervisory work undertaken on the subject of risk controls and the relevance of the issues identified have already been documented in previous publications. Those findings have fed into SREP assessments and led to a significant number of qualitative measures, as described below in Section 5.3.5.
Variable practices continue to be observed in the classification of exposures, often with inadequate reclassification across IFRS9 stages, inadequate identification of forborne exposures and delayed assessments of the likeliness of repayment. Supervisors have put significant pressure on banks with a view to bringing them into line with the expectations set out in the letters sent to CEOs in 2020, so that credit quality is correctly reflected in banks’ balance sheets and distressed exposures are both identified and addressed in a timely manner.
As of January 2021, directly supervised entities were requested to submit information on contractual modifications that were undertaken without reclassifying the facility as forborne. When viewed in conjunction with other data, the significant heterogeneity in those outcomes offers insight into the worrying variation in banks’ practices.
Chart 26
Percentage of modifications flagged as forborne (total portfolio)
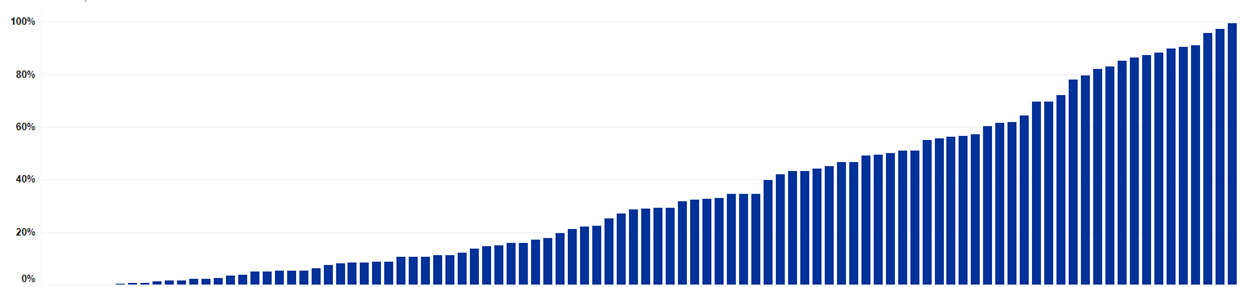
Source: COVID reporting.
Note: This chart indicates banks’ reported status as at 31 August 2021.
Weaker practices were often identified at banks that had not previously been regarded as problematic from a credit risk perspective, with universal banks, small diversified lenders and G-SIBs being impacted more heavily.
5.3.5 Supervisory expectations
Supervisors issued a significant number of qualitative measures addressing bank‑specific concerns on credit risk, with 70% of banks receiving such requests.
Some 45% of those measures related to institutions’ ability to identify and react to the deterioration of credit risk. These focused on shortcomings in terms of the adequacy (21%) and timeliness (12%) of the identification of distress in portfolios, as well as the ability to capture those issues in management reporting (12%) to allow the appropriate action to be taken.
Chart 27
Breakdown of credit risk-related qualitative measures
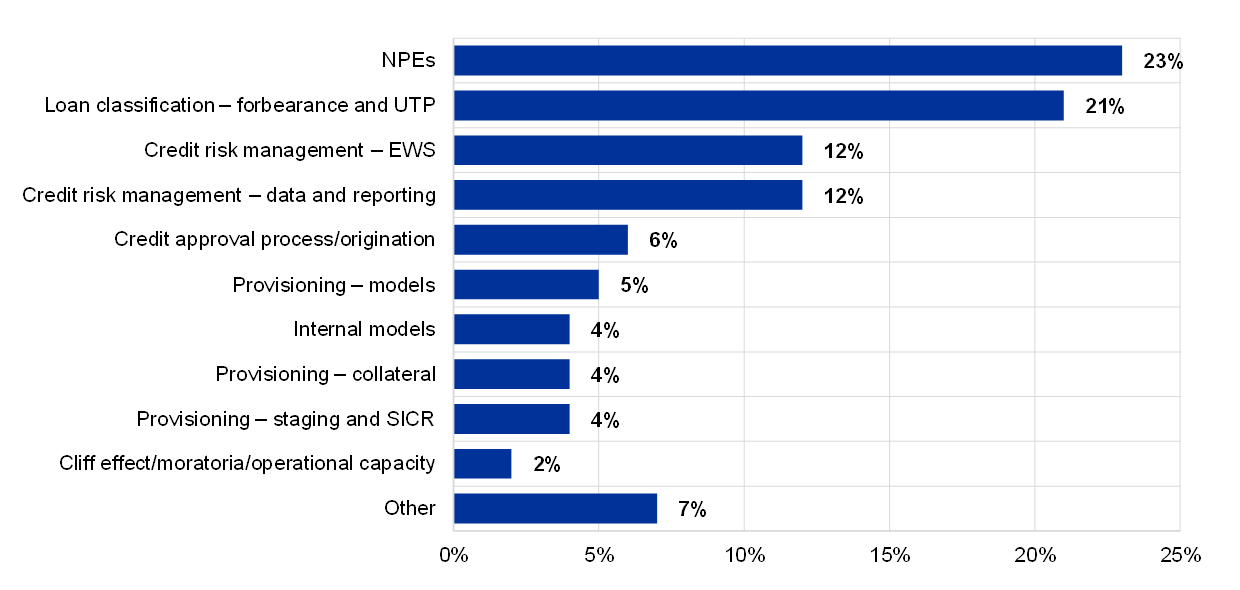
Source: SREP 2021 values based on 108 decisions.
Note: This chart does not include weaknesses which may have already been addressed by supervisory actions outside of the context of SREP 2021.
The use of SREP measures should be seen in the context of the wider range of tools available to supervisors. In the centrally coordinated review of credit risk controls that was mentioned in Section 5.3.4, institutions had, on average, six material or very material gaps between their practices and ECB Banking Supervision’s expectations (across 91 institutions in total). In many instances, supervisors were satisfied with the remediation plans put in place and anticipated the early resolution of issues. Where that was not the case, supervisors used SREP measures to address 147 gaps and used operational acts to make recommendations to banks in another 183 instances, as well as using a variety of other forms of engagement to ensure the closure of gaps.
5.4 Element 3 – Capital adequacy and ICAAP
5.4.1 Key messages
Banks’ capital positions have strengthened significantly in the course of the pandemic, but their scores remained broadly stable in 2021 given the extent of public support measures (see Chart 28).
Supervisors performed a dedicated assessment of banks’ forward-looking capital adequacy in 2021. In this assessment process, most JSTs reflected on uncertainties around banks’ capital projections in the COVID-19 pandemic.
Banks limited their dividend payments, in line with the expectations set out in the ECB’s dividend recommendation, which was applicable until 30 September 2021. After that date, JSTs’ supervisory dialogue on dividends was limited to a set of particularly controversial cases. As banks with inadequate forward-looking capital positions did not plan to distribute dividends, supervisors did not engage in discussions aimed at limiting dividend payments. Enhanced supervisory dialogue was conducted with a few banks with weak forward-looking capital positions and insufficiently prudent dividend plans.
Chart 28
Element 3: Capital adequacy SREP scores for 2018, 2019 and 2021

Sources: SREP 2021 values based on 108 decisions; SREP 2019 values based on 109 decisions; SREP 2018 values based on 107 decisions.
SREP 2021 saw limited changes in the distribution of capital adequacy scores relative to 2019: 82% of SIs were assigned the same score as in 2019, 5% saw their score deteriorate, and 13% were given a better score.
5.4.2 Breakdown by business model
Chart 29 below shows the distribution of capital adequacy risk scores across significant institutions with different business models. G-SIBs, investment banks and universal banks are concentrated in scores 2 and 3. Diversified lenders and consumer credit and retail lenders have the highest levels of dispersion across scores 2, 3 and 4.
Chart 29
Breakdown of capital adequacy SREP scores by business model
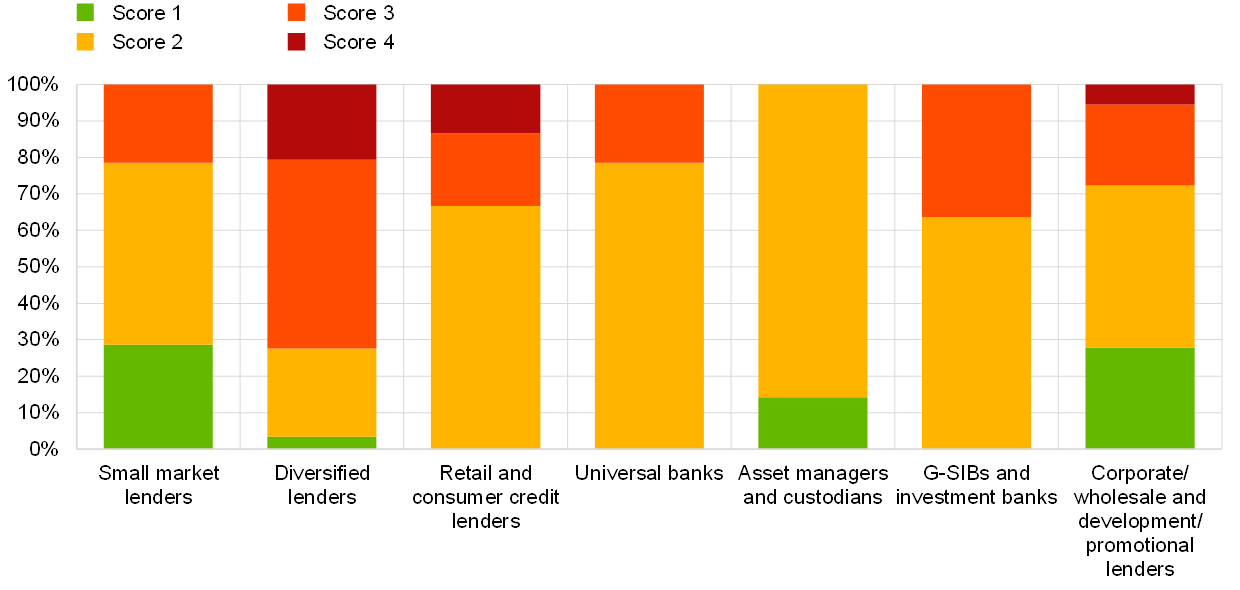
Source: SREP 2021 values based on 108 decisions.
5.4.3 Focus on impact of regulatory relief measures
Euro area banks entered the COVID‑19 pandemic with relatively strong capital positions relative to previous crises, with limited exceptions.
The frontloading of the new rules on the composition of P2R capital reduced requirements for banks by around 90 basis points in terms of CET1. However, the actual benefits in terms of CET1 relief amounted to around 30 basis points on average after any Additional Tier 1 and Tier 2 shortfalls in Pillar 1 and Pillar 2 had been covered with CET1 instruments.
As part of the ECB’s relief measures, banks have been given the flexibility to dip into their capital conservation buffer or their Pillar 2 guidance until the end of 2022. As discussed above (see Section 1.2), the ECB does not, at this stage, expect to extend its prudential relief measures regarding banks’ use of capital buffers beyond that time frame. As we approach the phasing-out of the P2G relief, a limited number of SIs are planning to dip into their buffers or their P2G by the end of 2022. Overall, based on Q3 2021 data, six banks have capital levels below the sum of capital requirements, buffers and guidance[8].
Chart 30
Capital headroom and use of buffers and P2G as at Q3 2021
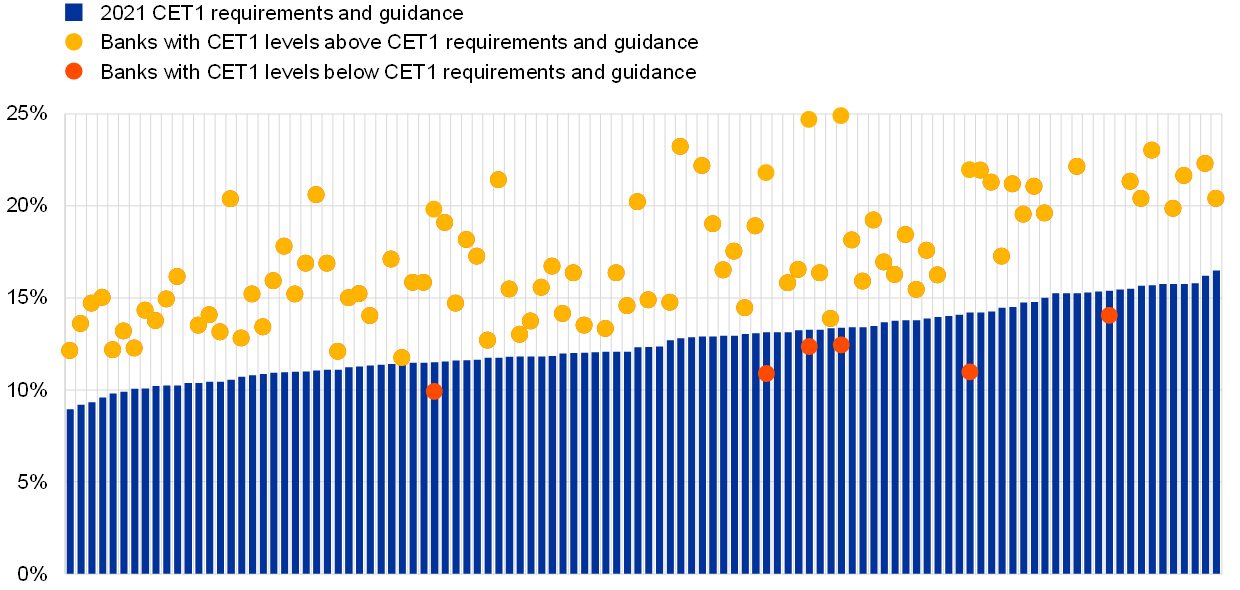
Sources: CET1 requirements and guidance include P2Rs/P2G based on 108 SREP decisions applicable as at Q1 2022, as well as any AT1/T2 shortfall that needs to be covered with CET1. CET1 ratios are as at Q3 2021. Systemic buffers (G SII, O SII and systemic risk buffer) and countercyclical capital buffers are as at Q1 2022.
5.4.4 Supervisory expectations
In a number of cases, JSTs expressed concerns about the reliability of banks’ capital planning frameworks (e.g. the ability to produce reliable capital projections with baseline and adverse scenarios over at least a three-year period) as part of their ICAAP assessments. Several banks were subject to requirements and recommendations aimed at enhancing their capital planning[9].
In addition to recommendations on the ICAAP framework more broadly, a number of recommendations focused specifically on (i) the ICAAP capital planning process (14% of all qualitative recommendations for this category of risk), (ii) dividend distribution (11%) and (iii) the identification and quantification of risks in the ICAAP (6%). Thus, these three subcategories accounted for roughly 30% of total qualitative recommendations for this category of risk.
Chart 31
Breakdown of capital/ICAAP-related qualitative recommendations (granular distribution)
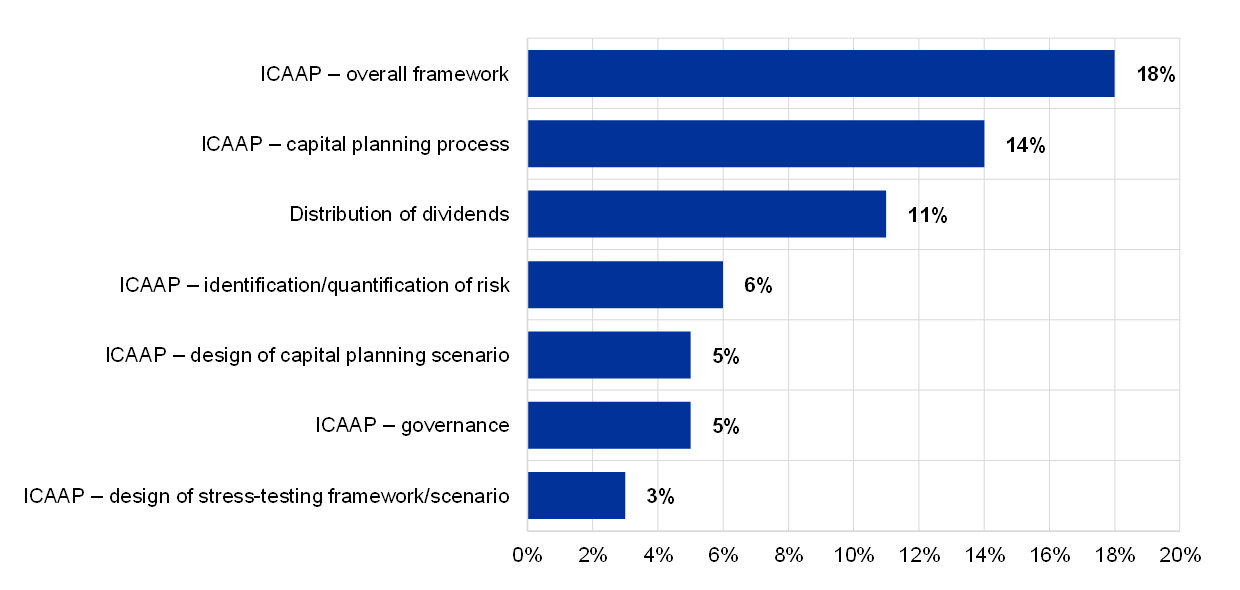
Source: SREP 2021 values based on 108 decisions.
Note: This chart does not include weaknesses which may have already been addressed by supervisory actions outside of the context of SREP 2021.
As mentioned in the ECB report on banks’ ICAAP practices, banks are expected to continuously improve their internal processes. Indeed, sound ICAAPs are key success factors for effective risk management.
5.5 Detailed analysis of other risks
5.5.1 Market risk
In SREP 2021, supervisors focused on the assessment of valuation risks, with the low interest rate environment, the extraordinary fiscal and monetary policy support measures and the search for yield leading to stretched valuations in several financial market segments. Several banks were subject to measures requiring them to revise their methodologies for quantifying valuation risks and their broader market risk control frameworks.
The vulnerabilities that were identified in the context of SREP 2021 contributed to the decision to make market risk one of the key priorities for ECB Banking Supervision in the period 2022-24. European banks should ensure that they are ready to handle any challenges stemming from an abrupt repricing of risky assets by strengthening their risk management capabilities. Banks’ variable risk management practices for counterparty credit risk are a specific source of concern in this regard, as recent market episodes involving non-bank financial institutions have shown that vulnerabilities stemming from the interplay between credit, market and counterparty risks can be exacerbated by sudden market movements.
5.5.2 Operational resilience
While the management of IT and cyber security is primarily the responsibility of banks themselves, IT and cyber security risk is a key area of focus for ECB Banking Supervision. Banks’ reliance on IT systems – and thus their vulnerability to IT-related risks – is increasing as they continue to digitalise and move towards round-the-clock availability of services. That trend predated the COVID-19 pandemic and has been accelerated by it.With sound digital transformation strategies seen as a catalyst for the fostering of efficiency, banks’ digitalisation efforts are starting to be reflected in slight increases in IT spending (albeit most of that is in the form of outsourcing). Examples of SREP measures in this field include requests for remediation plans where security vulnerabilities have been detected, requests for banks to establish an IT strategy where no such strategy has been documented, and requests for adequate staffing of critical IT functions.
5.5.3 Tackling money laundering and the financing of terrorism
While tackling money laundering and the financing of terrorism does not form part of the ECB’s supervisory mandate, the ECB plays an important role by identifying and reflecting the potential prudential consequences of money laundering and the financing of terrorism in its supervisory processes (particularly the SREP). As past cases have shown, concerns about money laundering and the financing of terrorism can have an impact on an institution’s safety and soundness, in some cases compromising its viability. At the same time, shortcomings in terms of controls on money laundering and the financing of terrorism may also raise red flags in relation to broader prudential issues that are in the ECB’s purview, such as a bank’s governance and risk management framework or the sustainability of its business model.
As in 2020, ECB Banking Supervision factored prudential concerns relating to money laundering and the financing of terrorism into the SREP 2021 assessments, leveraging exchanges of information with the relevant authorities.
Prudential concerns relating to money laundering and the financing of terrorism were reflected in different parts of the SREP 2021 assessments, primarily in relation to business models (Element 1), internal governance and risk management (Element 2), operational risk (Element 3, Block 1), credit risk (Element 3, Block 1) and risks to liquidity (Element 4). Prudential concerns focused mainly on issues relating to internal governance arrangements, business models and the management of operational risk. For instance, in the area of internal governance and risk management, causes of prudential concerns about money laundering and the financing of terrorism could be rooted in weak internal control frameworks (i.e. deficiencies in the compliance function) or insufficient oversight of money laundering and financing of terrorism risks by the management body.
6 Conclusions and future outlook
The 2021 SREP cycle saw ECB Banking Supervision go back to performing a full capital assessment, with SREP scores assigned to banks’ overall risk profiles and their main elements and the issuance of formal decisions rather than just recommendations.
The results of SREP 2021 reflect both the resilience of the European banking sector and potential emerging risks and vulnerabilities.
Overall, SREP scores are broadly stable, with significant institutions maintaining solid capital and liquidity positions and most banks going beyond the levels dictated by capital requirements and guidance.
Concerns about risks on the horizon are reflected in qualitative findings and measures relating to the broader quality of banks’ internal risk control frameworks and the effectiveness and diversity of banks’ management bodies, with banks being asked to enhance both risk management and governance structures.
SREP 2021’s assessment of the risks and vulnerabilities in the banking sector has formed the basis for decisions on supervisory priorities (and corresponding activities) over the next three years – which will be long enough to make good progress in addressing the relevant vulnerabilities.
ECB Banking Supervision has assessed the main risks and vulnerabilities faced by significant institutions and established three supervisory priorities for the period 2022‑24:
- Make sure that banks emerge healthy from the pandemic. Against the backdrop of a macroeconomic outlook that is dependent on the future evolution of the pandemic, supervisors will continue their efforts to address shortcomings in banks’ credit risk management practices, with a particular focus on the identification and classification of distressed borrowers, the valuation of collateral and the adequacy of provisioning practices. Supervisors will also strengthen their focus on banks’ exposure to non-financial corporate sectors that are more sensitive to the impact of the pandemic, as well as leveraged finance, with a view to avoiding a build-up of unmitigated risks. Finally, there will be more supervisory attention on the risks posed by an excessive search for yield and, in particular, banks’ ability to withstand potential shocks affecting interest rates and credit spreads.
- Address structural weaknesses via effective digitalisation strategies and enhanced governance. Supervisors will assess banks’ digitalisation strategies to make sure that institutions have adequate arrangements in place (in terms of governance, resources, skills, risk management, etc.) to make them sustainable in the long term. Moreover, supervisors will carry out targeted initiatives to ensure that banks effectively address deficiencies in the functioning and composition of their management bodies, with a particular focus on their collective suitability and diversity.
- Tackle emerging risks. Banks are exposed to a number of emerging and evolving risks, which can materialise both in the short term and in the longer term, such as climate-related and environmental risks, increases in counterparty credit risk towards riskier and less transparent non-bank financial institutions, and operational and IT resilience risks. ECB Banking Supervision is designing targeted and staggered supervisory responses (e.g. a thematic review and a bottom-up stress test for climate‑related and environmental risks, and a targeted review and on-site inspections for counterparty credit risk) to ensure that vulnerabilities relating to these emerging risks are tackled.
While its strategic priorities are reviewed on an annual basis, ECB Banking Supervision’s ongoing risk identification and monitoring activities allow it to be flexible in adjusting its priorities (and the corresponding activities) at short notice when needed.
© European Central Bank, 2022
Postal address 60640 Frankfurt am Main, Germany
Telephone +49 69 1344 0
Website www.bankingsupervision.europa.eu
All rights reserved. Reproduction for educational and non-commercial purposes is permitted provided that the source is acknowledged.
For specific terminology please refer to the SSM glossary (available in English only).
- “Overall capital requirements and guidance” means Pillar 1 + Pillar 2 requirement + combined buffer requirement + Pillar 2 guidance. See here for additional information on the composition of the capital stack. All figures are reported as percentages of risk-weighted assets.
- Under those new rules, which were initially due to take effect when CRD V entered into force on 1 January 2021, P2R capital should have the same composition as Pillar 1 – i.e. at least 56.25% should be in CET1 and at least 75% should be in Tier 1 as a minimum requirement.
- Small market lenders and universal banks are subject to higher levels of buffers, as several banks with those business models are classified as other systemically important institutions (O-SIIs). Additional information on the systemic risk buffer is available here.
- Each reduction in the applicable P2R add-on will become effective one month after updated reporting on the implementation of the NPE coverage has been submitted to the ECB, absent any supervisory concerns. That updated reporting must include data as at the relevant reference dates – i.e. one or more of 31 March 2022, 30 June 2022 and 30 September 2022, as appropriate.
- As a result of the pragmatic approach that was adopted on account of COVID-19, SREP scores were not updated in 2020 unless there were exceptional circumstances affecting an individual bank. Consequently, SREP scores for 2020 are not included in this section.
- In 2020, as part of their pragmatic approach to the SREP process, JSTs issued qualitative recommendations (which were not legally binding). In 2021, by contrast, supervisors addressed findings by means of both requirements and recommendations when seeking to communicate their expectations regarding areas of concern. Qualitative requirements and recommendations are both regarded as “measures” for the purposes of this document. In addition to SREP measures, other remedial actions may also be requested of significant institutions on the back of on-site inspections or other supervisory activities. Those actions, however, are not included in the “measures” referred to in this document.
- A pilot project involving more granular scoring for internal governance was introduced for SREP 2021: 44% of banks were assigned a score of 3, with another 21% obtaining a score of 3+ and 13% being given a score of 3-. That pilot project will be rolled out to other risk categories in the forthcoming cycle. The new scoring methodology brought about a marginal improvement in the distribution of scores, but that is not fully visible in Chart 18, where scores are aggregated on a scale of 1 to 4.
- This is based on P2Rs, countercyclical capital buffers, systemic buffers (G‑SII, O‑SII and systemic risk buffers) and P2G as at Q1 2022, as well as CET1 ratios as at Q3 2021 after COVID-related shortfalls in Pillar 1 and Pillar 2 requirements have been covered with Additional Tier 1 and Tier 2 instruments.
- Capital headroom is defined as the difference between (i) a bank’s capital requirements and guidance and (ii) its capital ratio.