Supervisory review (SREP) - Aggregate SREP outcome for 2019
1 Overall SREP 2019 key messages
- SREP CET1 requirements and guidance (excluding systemic buffers and countercyclical buffer) for the 2019 cycle are stable overall at around 10.6% compared to the 2018 cycle.
- Business model remains a key supervisory focus with supervisors highlighting banks’ business model sustainability as a key risk area of the SREP 2019.
- Governance remains a risk area of particular supervisory concern due to deteriorating scores driven by limited effectiveness of management bodies, weaknesses in internal controls, poor data aggregation capabilities and weak outsourcing arrangements.
- When the ECB assumed its supervisory responsibilities five years ago, it stood at around €1 trillion (8% NPL ratio). By the end of September 2019, the volume of non-performing loans held by significant institutions had been reduced to €543 billion (3.4% NPL ratio).
- Operational risk driven by specific one off losses and increased IT/cyber risk for a number of significant institutions represents a key area of ongoing focus for supervisors.
- Overall, the two key risk management processes for capital and liquidity – ICAAPs and ILAAPs – show significant need for improvements, also in light of their role in the SREP which will increase in the future.
2 Capital measures
2.1 Key messages
- SREP CET1 requirements and guidance (excluding systemic buffers and countercyclical buffer) for the 2019 cycle are stable overall at around 10.6% compared to the 2018 cycle.
- Overall CET1 requirements and guidance (including systemic buffers and countercyclical buffer) slightly increase by around 20 bps, of which 10 bps are related to the increase of systemic buffers and 10 bps to the increase in countercyclical capital buffer.
- The P2G, which captures supervisory risk concerns from the outcome of the stress tests, remains stable for SREP 2019.
- The institution-specific CET1 requirements and guidance changed to reflect the evolution of the risk profile (up or down) in 30% of cases.
Chart 1
SREP CET1 requirements and guidance (excluding systemic buffers and countercyclical buffer):
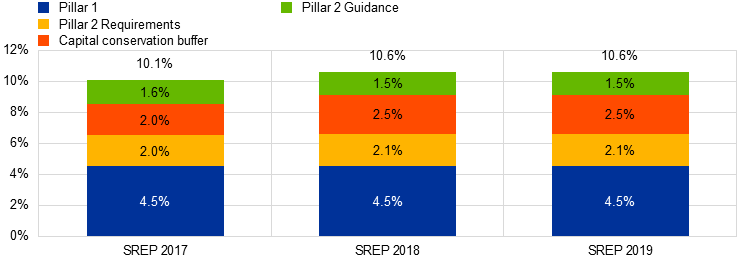
Source: SREP 2019 values based on 109 SREP 2019 decisions finalised as of 31 December 2019 applicable from 1 January 2020. SREP 2018 values based on 107 SREP 2018 decisions finalised as of 31 January 2019 and presented in the SSM SREP Methodology Booklet – 2018 edition. SREP 2017 values based on 105 SREP 2017 decisions finalised as of 30 November 2017 and presented in the SSM SREP Methodology Booklet – 2017 edition.
Note: CET1 requirements are computed only on the basis of the regulatory minimum CET1 requirements.
Chart 2
Overall CET1 requirements and guidance (including systemic buffers and countercyclical buffer):

Source: SREP 2019 values based on 109 SREP 2019 decisions finalised as of 31 December 2019 applicable from 1 January 2020. SREP 2018 values based on 107. SREP 2018 decisions finalised as of 31 January 2019 and presented in the SSM SREP Methodology Booklet – 2018 edition. SREP 2017 values based on 105 SREP 2017 decisions finalised as of 30 November 2017 and presented in the SSM SREP Methodology Booklet – 2017 edition.
Note: CET1 requirements are computed only on the basis of the regulatory minimum CET1 requirements.
2.2 Breakdown by business model
- Compared to the CET1 requirements and guidance (excluding systemic buffers and countercyclical buffer) for all SSM banks, the CET1 requirements and guidance (excluding systemic buffers and countercyclical buffer) are:
- higher for custodians and asset managers, corporate, wholesale and sectoral lenders;
- lower for G-SIBs and universal banks;
- in line for diversified lenders and small domestic and retail lenders (10.6%).
Chart 3
Breakdown of SREP CET1 requirements and guidance (excluding systemic buffers and countercyclical buffer) by business model:
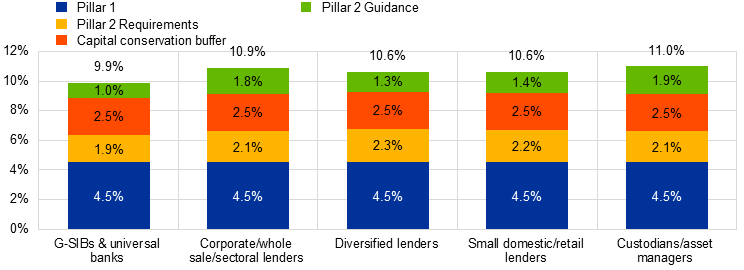
Source: SREP 2019 values based on 109 SREP 2019 decisions finalised as of 31 December 2019 applicable from 1 January 2020.
Note: CET1 requirements are computed only on the basis of the regulatory minimum CET1 requirements
Chart 4
Breakdown of overall CET1 requirements and guidance (including systemic buffers and countercyclical buffer) by business model:
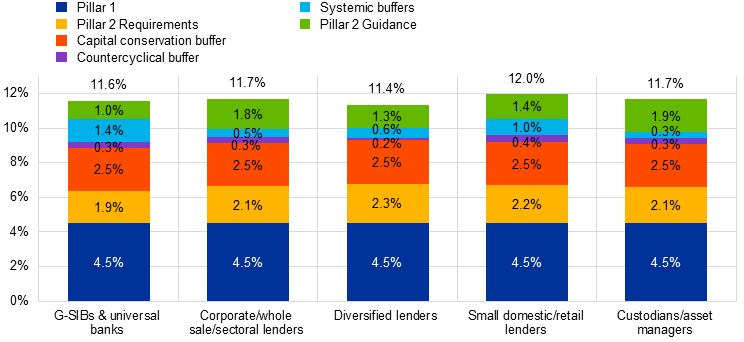
Source: SREP 2019 values based on 109 SREP 2019 decisions finalised as of 31 December 2019 applicable from 1 January 2020.
Note: CET1 requirements are computed only on the basis of the regulatory minimum CET1 requirements
2.3 Key facts
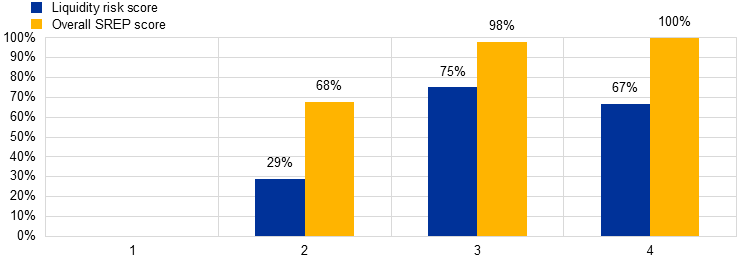
- In line with the SREP 2018 assessment, SREP 2019 CET1 requirements and guidance* increases consistently with worse SREP scores.
Chart 5
SREP CET1 requirements and guidance* by overall SREP score:

Source: SREP 2019 values based on 109 SREP 2019 decisions finalised as of 31 December 2019. SREP 2018 values based on 107 SREP 2018 decisions finalised as of 31 January 2019 and presented in the SSM SREP Methodology Booklet – 2018 edition. SREP 2017 values based on 105 SREP 2017 decisions finalised as of 30 November 2017 and presented in the SSM SREP Methodology Booklet – 2017 edition.
Note: * Pillar 1 + Pillar 2 Requirement + Capital conservation buffer + Pillar 2 Guidance. Excludes systemic buffers (G-SII, O-SII and systemic risk buffer) and countercyclical capital buffer.
- A few significant institutions are below the CET1 requirements and guidance (including systemic buffers and countercyclical buffer).
Chart 6
Overall CET1 requirements and guidance* and CET1 capital levels:
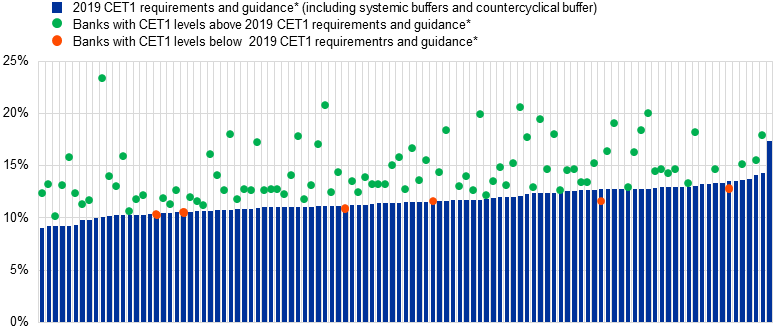
Source: SREP 2019 values based on 109 SREP 2019 decisions finalised as of 31 December 2019 applicable from 1 January 2020. Based on capital levels in Q3 2019, CET1 after covering shortfalls in Pillar 1 AT1/T2. The countercyclical capital buffer (CCyB) figures are calculated based on the exposures as of Q1 2019 and on the announced CCyB schedule as of 28 June 2019 applicable up to 1 August 2020.
Note: * Pillar 1 + Pillar 2 Requirement + capital conservation buffer + Pillar 2 Guidance + systemic buffers (G-SII, O-SII and systemic risk buffer) + countercyclical capital buffer applicable from Q1 2020.
2.4 Evolution of P2R
- P2R remains stable and risk sensitive.
- On average, P2R is higher as the score worsens with some exceptions.
- Changes are observed in P2R for around 30% of the banks, with a balanced distribution between increases and decreases.
Chart 7
Aggregate P2R changes in comparison to overall SREP score changes:
P2R |
|||||
Decrease |
No change |
Increase |
Total |
||
Overall SREP score |
Better |
2 |
4 |
0 |
6 |
No change |
12 |
68 |
12 |
92 |
|
Worse |
0 |
0 |
4 |
4 |
|
Total |
14 |
72 |
16 |
102 |
|
Source: SREP 2019 values based on 109 SREP 2019 decisions finalised as of 31 December 2019. applicable from 1 January 2020 SREP 2018 values based on 107 SREP 2018 decisions finalised as of 31 January 2019 and presented in the SSM SREP Methodology Booklet – 2018 edition.
3 Qualitative measures
3.1 Key messages
91 banks received “other” qualitative measures* (2018: 83):
- Qualitative measures are applied for all banks scored 4 in the SREP 2019, while other supervisory actions have been implemented for the remaining banks depending on the bank-specific risk profile. Qualitative measures are addressed to significant institutions via SREP decisions in order to remediate a wide range of weaknesses (regarding internal governance and risk management (including ICAAP and ILAAP, NPL, IT and data quality). Internal governance is the risk area addressed by the highest number of measures.
40 institutions received qualitative liquidity measures* (45 in 2018):
- Most of the weaknesses relate to issues on the ILAAP, the Liquidity Coverage Ratio and stress-testing framework enhancement.
Chart 8
Banks with 2019 qualitative measures* by SREP scores:
Source: SREP 2019 values based on 109 SREP 2019 decisions finalised as of 31 December 2019. SREP 2018 values based on 107 SREP 2018 decisions finalised as of 31 January 2019 and presented in the SSM SREP Methodology Booklet – 2018 edition.
Note: * In addition to requesting qualitative measures, the JSTs request other measures outside of the SREP Decision, stemming from OSIs, deep dives or day-to-day tasks carried out as part of the supervisory activity.
3.2 Breakdown by business model
- The following chart represents the breakdown of qualitative measures by business model, as outcomes of the 2019 SREP. Generally, other remedial actions may also be requested from significant institutions on the back of on-site inspections or other supervisory activities. These are not included below.
Chart 9
Breakdown of banks with 2019 qualitative measures* by SREP scores:
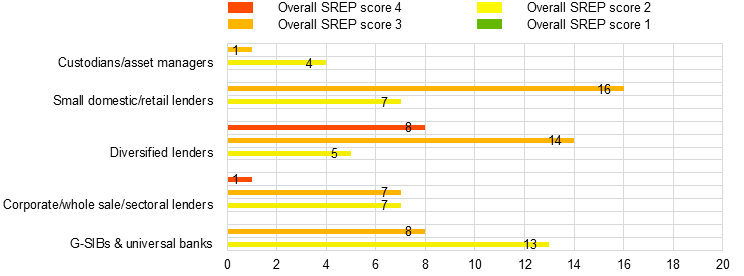
Source: SREP 2019 values based on 109 SREP 2019 decisions finalised as of 31 December 2019.
Note: * In addition to requesting qualitative measures, the JSTs request other measures outside of the SREP Decision, stemming from OSIs, deep dives or day-to-day tasks carried out as part of the supervisory activity.
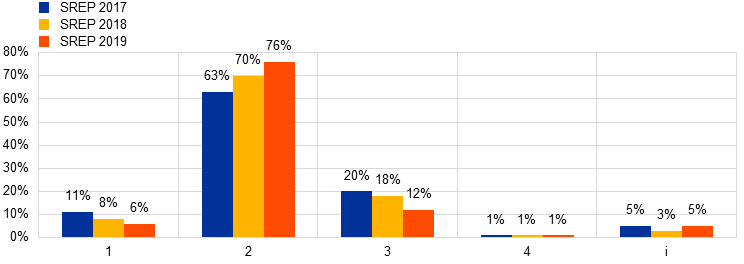
3.3 Distribution of qualitative measures* in the SREP 2019
- The following chart shows the distribution of the qualitative measures by SREP risk area, by business model and by overall SREP score.
- Governance is the risk area with the largest number of measures, followed by credit risk, for the 2019 cycle.
Chart 10
Distribution of 2019 qualitative measures by risk area:

Distribution of 2019 qualitative measures by business model:

Distribution of 2019 qualitative measures by overall SREP score:

Source: SREP 2019 values based on 109 SREP 2019 decisions finalised as of 31 December 2019.
Note: * In addition to requesting qualitative measures, the JSTs request other measures outside of the SREP Decision, stemming from OSIs, deep dives or day-to-day tasks carried out as part of the supervisory activity.
3.4 Focus on internal governance
- Internal governance is the risk area which poses the greatest concern given the number of qualitative measures.
- 30% of qualitative measures concern governance: the internal control function, the management bodies and risk infrastructure, data and reporting are the main focus areas.
Chart 11
Breakdown of 2019 qualitative measures by internal governance area:
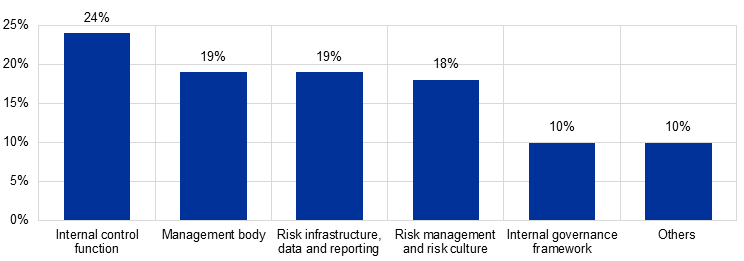
Source: SREP 2019 values based on 109 SREP 2019 decisions finalised as of 31 December 2019.
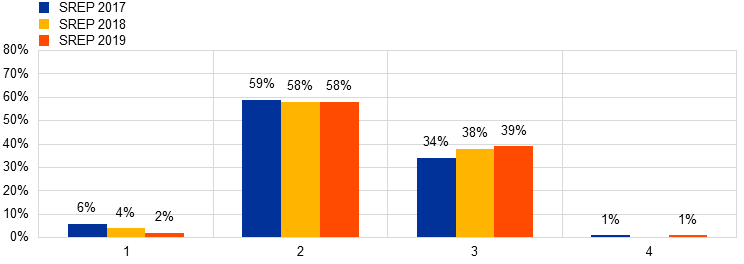
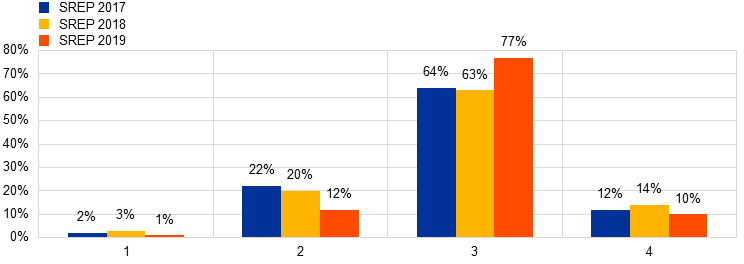
4 Evolution of scores
4.1 Key messages
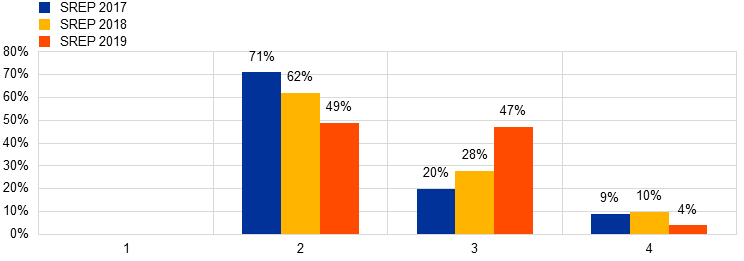
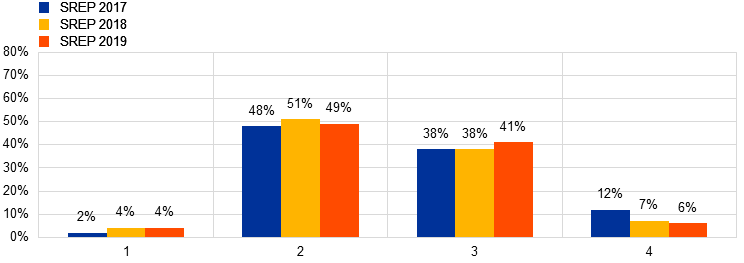
- Overall SREP assessment score distribution for 2019 remained stable compared to 2018.
- 90% of overall SREP scores remained constant in the period 2018-19, however the high spread of weak governance and operational risk scores are a concern to supervisors.
- The number of banks receiving “weaker” (score 3) overall scores has been increasing in recent years.
Chart 12
Overall SREP scores 2017, 2018 and 2019:
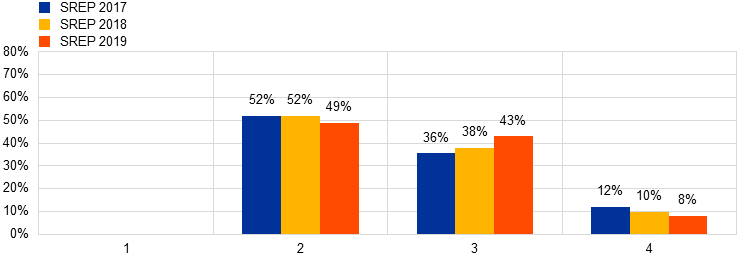
Source: SREP 2019 values based on 109 SREP 2019 decisions finalised as of 31 December 2019. SREP 2018 values based on 107 SREP 2018 decisions finalised as of 31 January 2019 and presented in the SSM SREP Methodology Booklet – 2018 edition. SREP 2017 values based on 105 SREP 2017 decisions finalised as of 30 November 2017 and presented in the SSM SREP Methodology Booklet – 2017 edition.
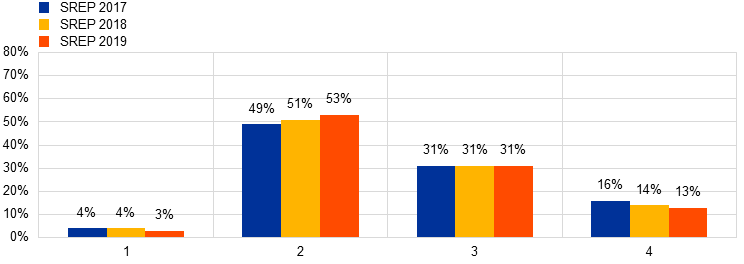
- Using an RWA weighting approach, there was a decrease in the number of banks receiving a score of 4 in 2019.
- Score 3 banks have shown an increase year on year since 2017 while score 2 banks showed a decrease in 2019.
- No significant institutions are scored 1 from an overall perspective.
Chart 13
Overall SREP scores 2017, 2018 and 2019 weighted by RWAs*:
Source: SREP 2019 values based on 109 SREP 2019 decisions finalised as of 31 December 2019. SREP 2018 values based on 107 SREP 2018 decisions finalised as of 31 January 2019 and presented in the SSM SREP Methodology Booklet – 2018 edition. SREP 2017 values based on 105 SREP 2017 decisions finalised as of 30 November 2017 and presented in the SSM SREP Methodology Booklet – 2017 edition.
Note: * Risk weighted Assets based on Q2 2019.
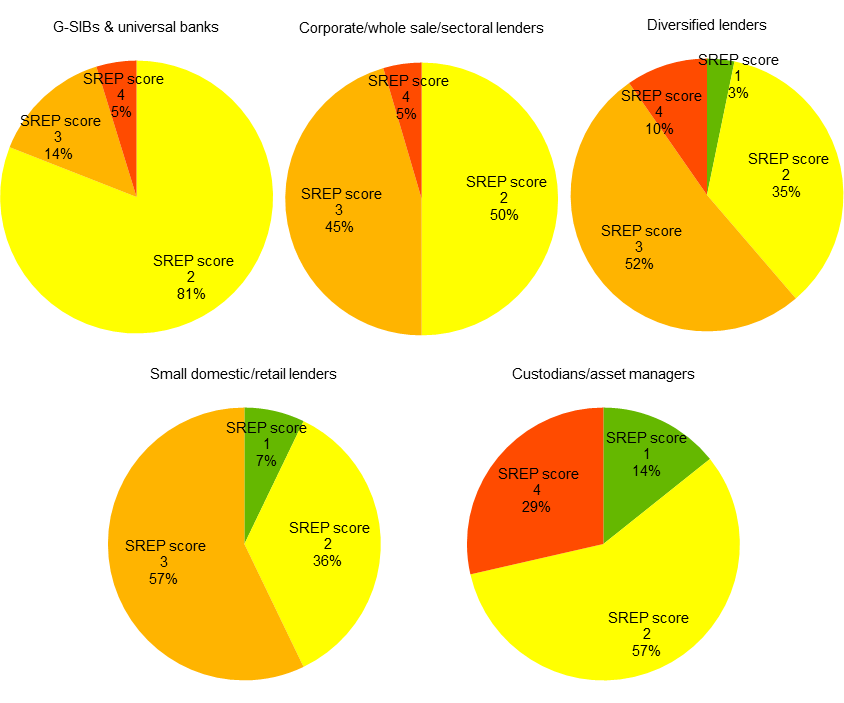
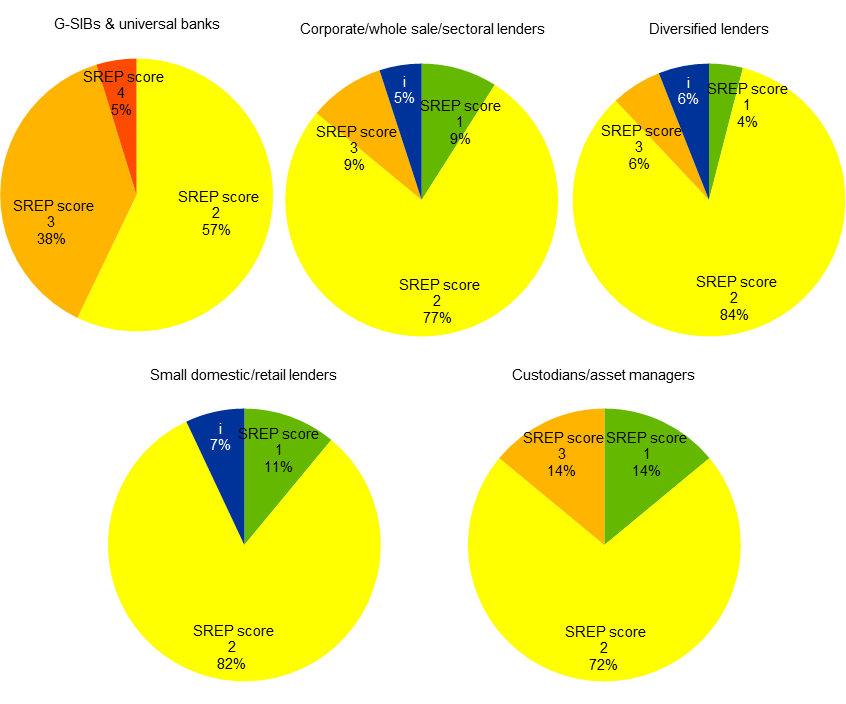
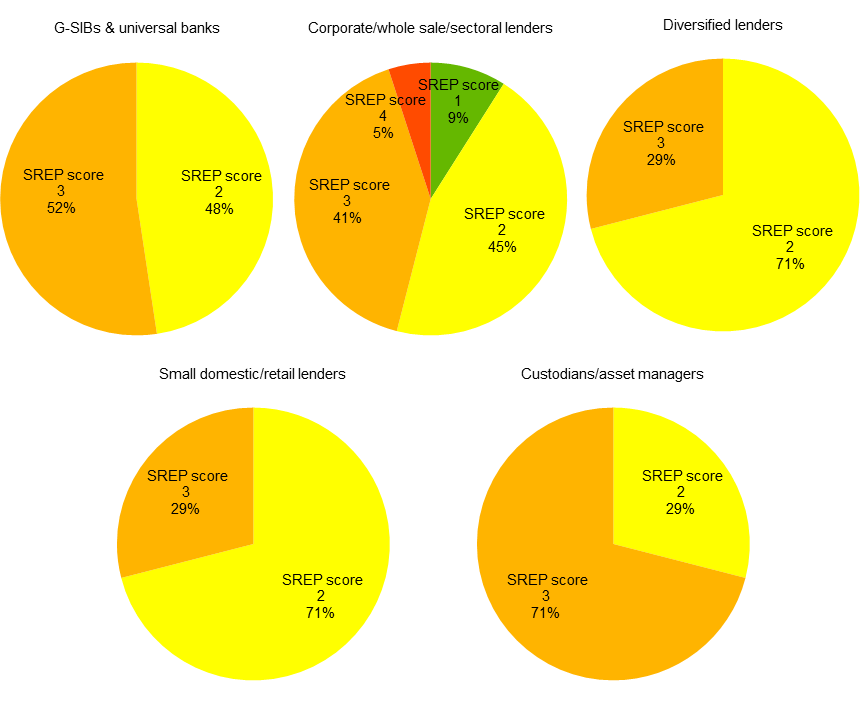
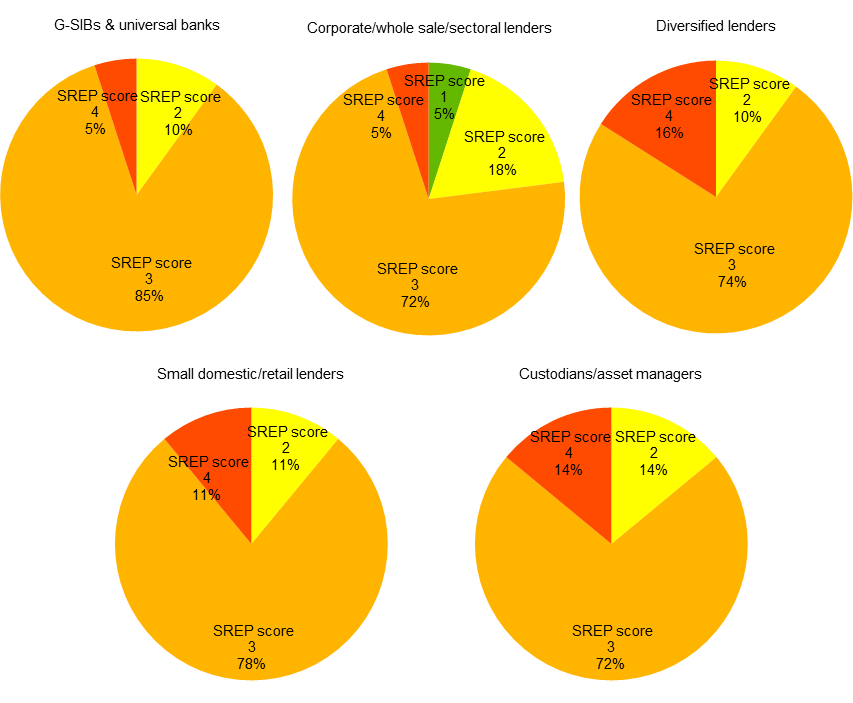
4.2 Breakdown by business model
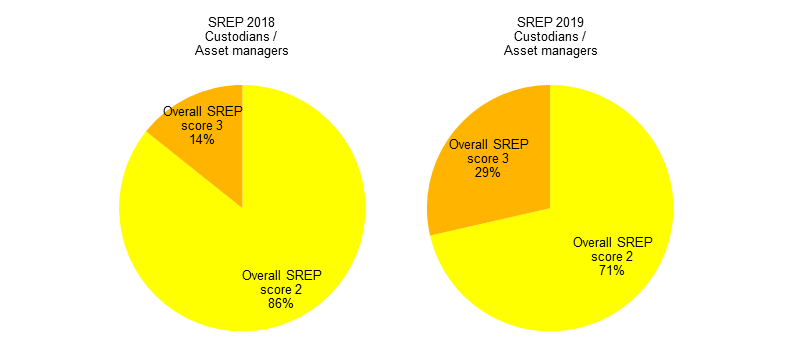
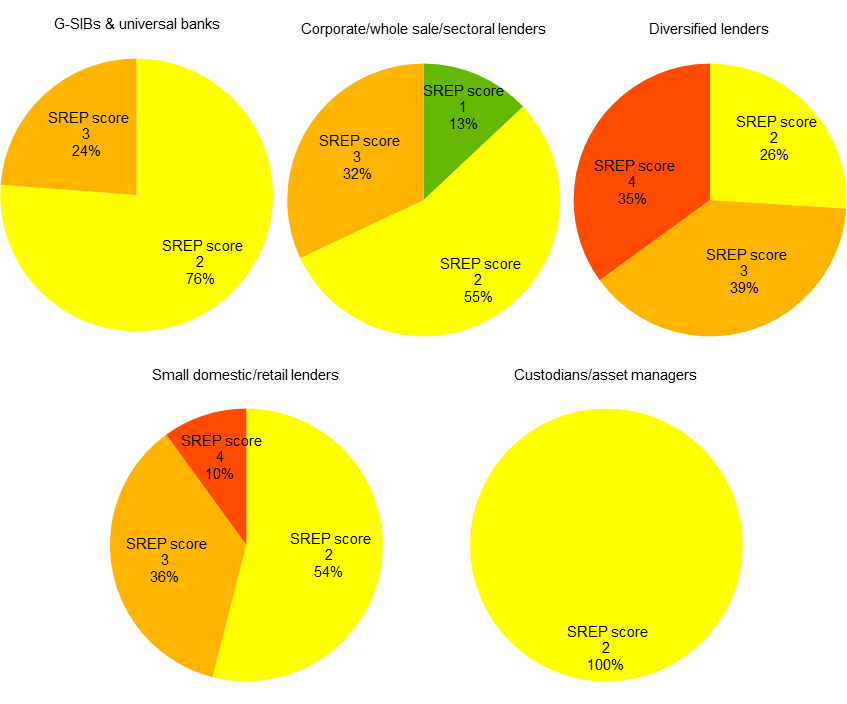
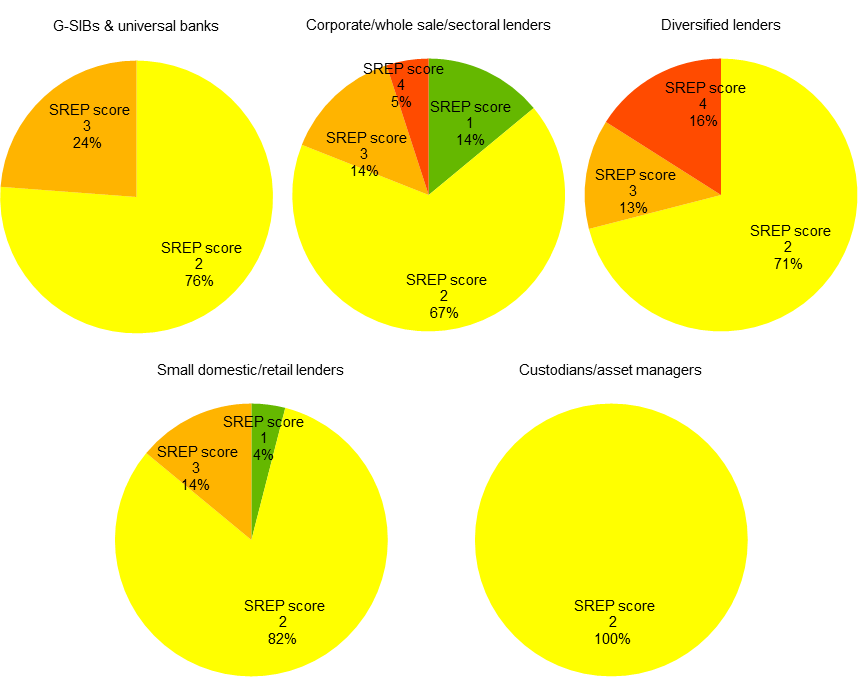
- The following charts show the distribution of overall SREP scores in 2019 and 2018 across various business model categories of significant institutions.
- The overall SREP score is slightly worse for all business models from 2018 to 2019, with an increase of score 3 and decrease of score 2.
- There is a high concentration in score 3 for small domestic, retail lenders and diversified lenders.
- Diversified lenders have the largest proportion of score 4 banks per business model category.
Chart 14
G-SIBs and universal banks overall SREP scores 2018 and 2019:
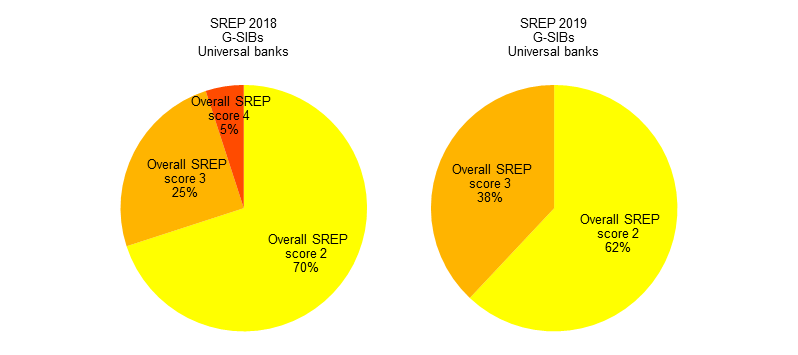
Chart 15
Corporate, wholesale and sectoral lenders overall SREP scores 2018 and 2019:
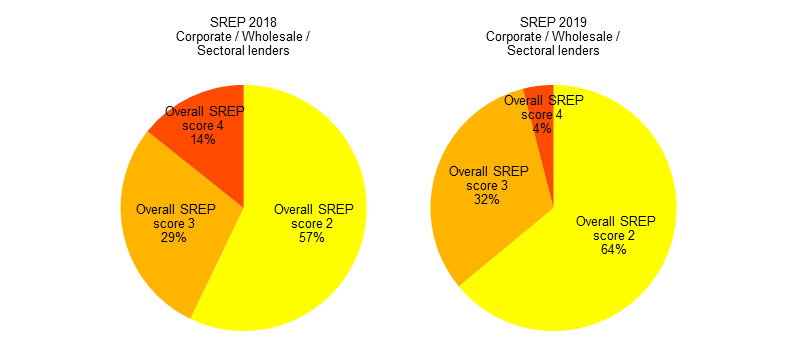
Chart 16
Diversified lenders overall SREP scores 2018 and 2019:
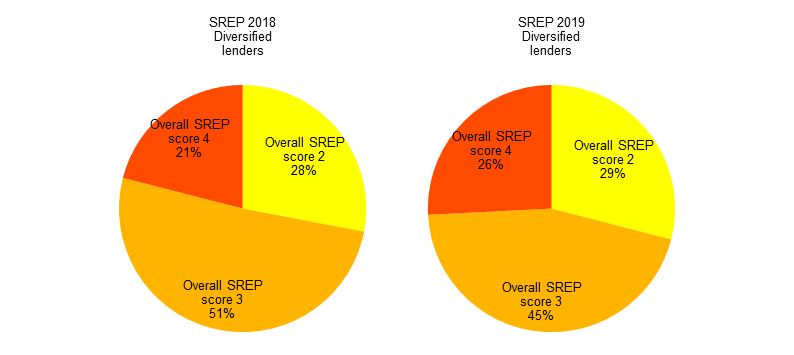
Chart 17
Small domestic and retail lenders overall SREP scores 2018 and 2019:
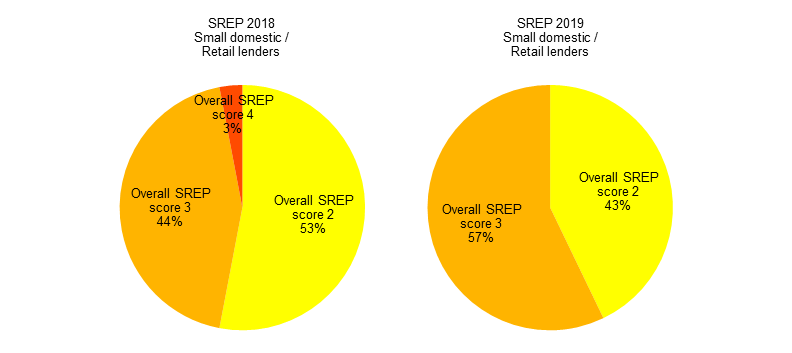
Chart 18
Custodians and asset managers overall SREP scores 2018 and 2019:
Source: SREP 2019 values based on 109 SREP 2019 decisions finalised as of 31 December 2019.
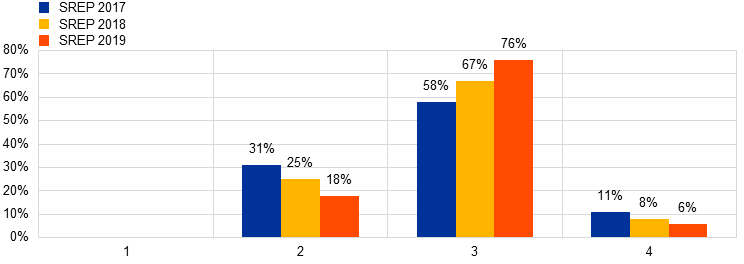
5 Element 1: Business model
5.1 Key messages
- On aggregate, BMA scores for significant institutions are clustered in scores 2 and 3.
- The evolution of profitability across significant institutions between SREP 2018 and 2019 was mixed:
- several institutions show low and/or decreasing returns;
- most significant institutions’ earnings are below their cost of capital, which impairs the capacity to generate more capital;
- supervisory attention is focused on banks’ future resilience and the sustainability of their business models and such aspects are incorporated into the SREP business model assessment.
Chart 19
Element 1: Business model SREP scores 2017, 2018 and 2019:
Source: SREP 2019 values based on 109 SREP 2019 decisions finalised as of 31 December 2019. SREP 2018 values based on 107 SREP 2018 decisions finalised as of 31 January 2019 and presented in the SSM SREP Methodology Booklet – 2018 edition. SREP 2017 values based on 105 SREP 2017 decisions finalised as of 30 November 2017 and presented in the SSM SREP Methodology Booklet – 2017 edition.
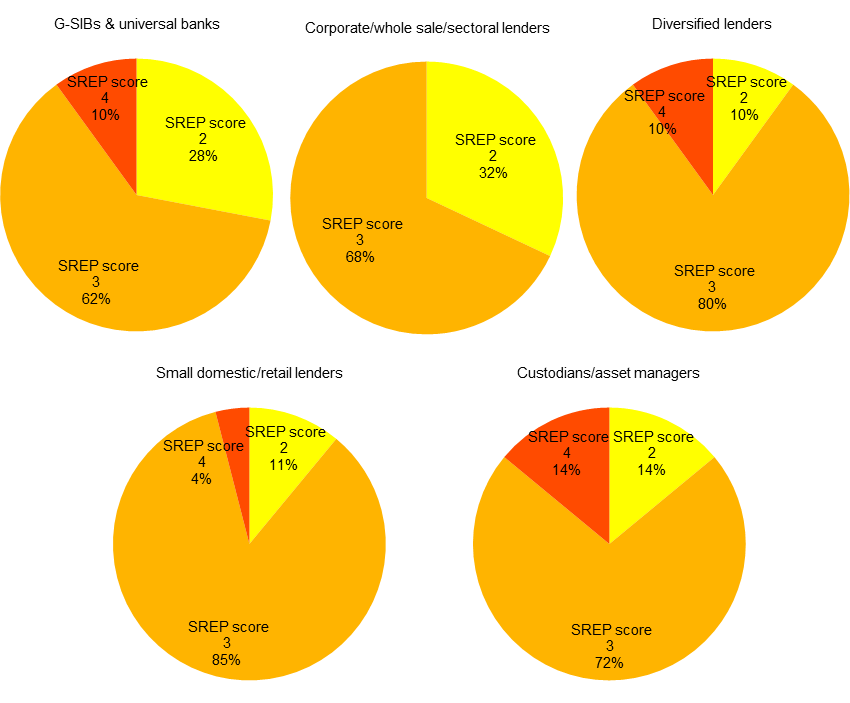
5.2 Breakdown by business model
- The following shows the distribution of business model risk scores across various business model categories of significant institutions.
- G-SIBs are mainly concentrated in score 2 with some instances of scores 3 and 4.
- Custodians and asset managers have the largest proportion of score 4 banks per business model category.
Chart 20
Breakdown of business model SREP scores by business model:
Source: SREP 2019 values based on 109 SREP 2019 decisions finalised as of 31 December 2019.
5.3 Focus on 2018 profitability
- The data for Cost of Equity (CoE) are based on significant institutions’ own reported self-assessment and are not estimated by the ECB.
- The majority of reporting banks did not earn their self-assessed CoE in 2018, despite some banks reporting a very low CoE.
Chart 21
ROE vs. COE:
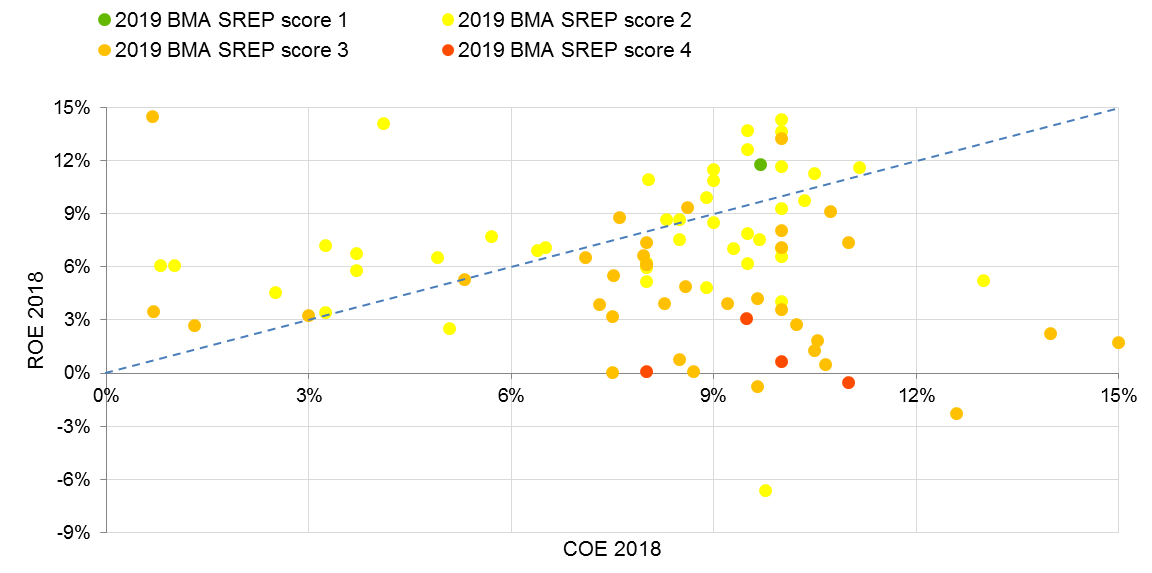
Source: FINREP, banks’ own estimates as reported for the Profitability Forecast Exercise. SREP 2019 values based on 109 SREP 2019 decisions finalised as of 31 December 2019.
Notes: Some 13 banks project CoEs below 5% which sets their hurdle very low and even gives an optimistic bias to this picture. For further details see Andrea Enria: Is less more? Profitability and consolidation in the European banking sector.
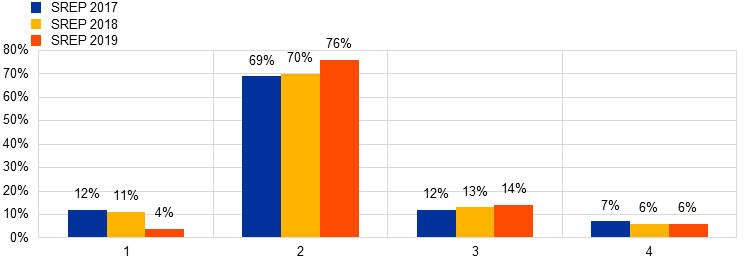
6 Element 2: Internal governance and risk management
6.1 Key messages
- The trends and score evolution in internal governance are an area for supervisory concern.
- Around 82% of institutions are scored 3 or 4 on the basis of the SREP 2019, with an overall worsening of the scores visible.
- An increased number of significant institutions (+25%) have scores 3 and 4 on outsourcing compared to 2018.
- Supervisors are concerned about:
- weak management board effectiveness;
- weak risk management and control of outsourcing related risks;
- poor data aggregation capabilities with many banks demonstrating weak alignment with BCBS 239 principles;
- weak anti-money laundering controls and procedures.
- Around 10% of significant institutions which exhibit problems with their capital ratios are scored 3 or 4 on remuneration, not presenting proper incentives schemes.
Chart 22
Element 2: Internal governance SREP scores 2017, 2018 and 2019:
Source: SREP 2019 values based on 109 SREP 2019 decisions finalised as of 31 December 2019. SREP 2018 values based on 107 SREP 2018 decisions finalised as of 31 January 2019 and presented in the SSM SREP Methodology Booklet – 2018 edition. SREP 2017 values based on 105 SREP 2017 decisions finalised as of 30 November 2017 and presented in the SSM SREP Methodology Booklet – 2017 edition.
6.2 Breakdown by business model
- The following shows the distribution of internal governance risk scores across various business model categories of significant institutions.
- There is a high concentration in score 3 across all business models.
- Some G-SIBs, diversified lenders, small domestic/retail lenders and custodians/asset managers are scored 4 in governance risk.
Chart 23
Breakdown of internal governance SREP scores by business model:
Source: SREP 2019 values based on 109 SREP 2019 decisions finalised as of 31 December 2019.
7 Element 3: Risks to capital
7.1 Credit risk
7.1.1 Key messages
- When the ECB assumed its supervisory responsibilities five years ago, it stood at around €1 trillion (8% NPL ratio). By the end of September 2019, the volume of NPLs held by significant institutions had been reduced to €543 billion (3.4% NPL ratio). The NPL reduction has accelerated over the past two years and has been particularly rapid in countries with high levels of NPLs, showing the great effort of the banking system in pursuing this goal and the effectiveness of the supervisory actions.
- However, there is continued need for follow up action by significant institutions on resolving NPLs.
- For 2020 and beyond, there will be an increasing focus on banks’ compliance with ECB coverage expectations on both the stock and the new flows.
- Significant institutions’ Stage 2 IFRS 9 Exposures exhibit on aggregate a coverage of 3.7% based on supervisory data as at the end of 2018. IFRS 9 is a key focus of supervisors and consistent application of accounting practices is an ongoing focus of JSTs.
Chart 24
Element 3: Risks to capital – credit risk SREP scores 2017, 2018 and 2019:
Source: SREP 2019 values based on 109 SREP 2019 decisions finalised as of 31 December 2019. SREP 2018 values based on 107 SREP 2018 decisions finalised as of 31 January 2019 and presented in the SSM SREP Methodology Booklet – 2018 edition. SREP 2017 values based on 105 SREP 2017 decisions finalised as of 30 November 2017 and presented in the SSM SREP Methodology Booklet – 2017 edition.
7.1.2 Breakdown by business model
- The following shows the distribution of credit risk scores across various business model categories of significant institutions.
- G-SIB’s’ scores are concentrated in score 2 and score 3.
- Diversified lenders’ scores are the most distributed across score 2, score 3 and score 4.
Chart 25
Breakdown of credit risk SREP scores by business model:
Source: SREP 2019 values based on 109 SREP 2019 decisions finalised as of 31 December 2019.
7.1.3 Focus on non-performing loans
7.1.3.1 Introduction
- The ECB published its “Guidance to banks on non-performing loans” (NPL Guidance) in March 2017, setting out the manner in which it expects banks to manage their NPLs. The objective of the NPL Guidance is to establish a consistent, best-practice approach to managing NPLs[1] in individual banks across the euro area.
- The NPL Guidance should help banks to significantly and continuously reduce high levels of NPLs, thereby benefitting the individual banks, the banking sector in general and the economy as a whole.
- Following the completion and publication of the NPL Guidance in March 2017, the ECB asked significant institutions with high levels of NPL[2] to submit strategies to address their NPL issues and define their own portfolio-level reduction targets over the medium term.
- Following the publication of the “Addendum to the ECB Guidance to banks on non-performing loans” in March 2018, the ECB revised its supervisory expectations for prudential provisioning for new non-performing loans to account for new EU regulation in its ECB NPL technical note published in August 2019.
- In the context of European Council Action Plan to tackle NPL, the EBA published Guidelines (EBA/GL/2018/06) on management of non-performing and forborne exposures that apply from 30 June 2019. The ECB has notified the EBA of its intention to comply with the EBA Guidelines.
Chart 26
NPL evolution for SIs
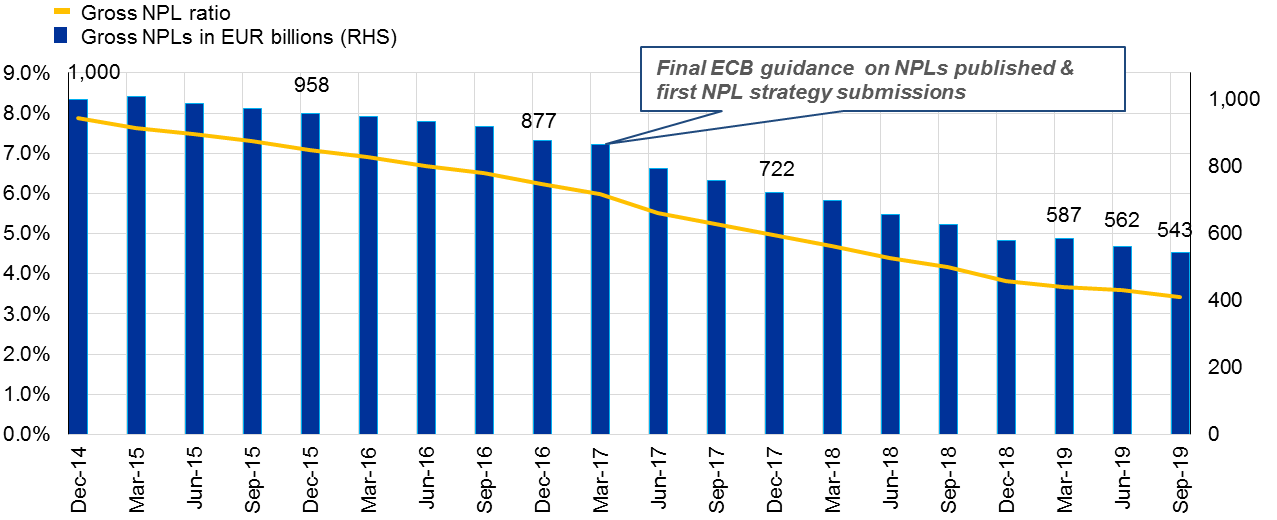
Source: ECB technical letter on NPL’s dated August 2019 (updated with Q3, 2019 supervisory data).
- Significant institutions with higher levels of NPLs communicated their NPL reduction strategies to the ECB for the first time in 2017 and have updated them twice since then.
7.1.3.2 NPL reduction strategies’ progress for six months to end-June 2019
- The following flow chart date is representative of 32 significant institutions and demonstrates their six-month non-performing loan reduction performance to end-June 2019 performance against 2019 full-year targets.
- On an aggregate basis, the banks performed well to end-June 2019 already achieving 40% of their end-year target.
- The largest reduction drivers for the six-month period came from loan repayments (borrowers repaying contractual agreed amounts) and sales (sales includes portfolio sales, securitisations and reclassification under IFRS 9 rules to held for sale). Seasonality related to sales/SRTs which are more concentrated typically in the second half of the year.
- JSTs continue to monitor banks’ performance against their own targets as part of normal supervisory engagement. Such supervisory engagement and associated actions are fully incorporated into the annual SREP process.
Chart 27
Planned NPL reduction for 2019: Year-end plans for 2019 against H1 2019 actuals:
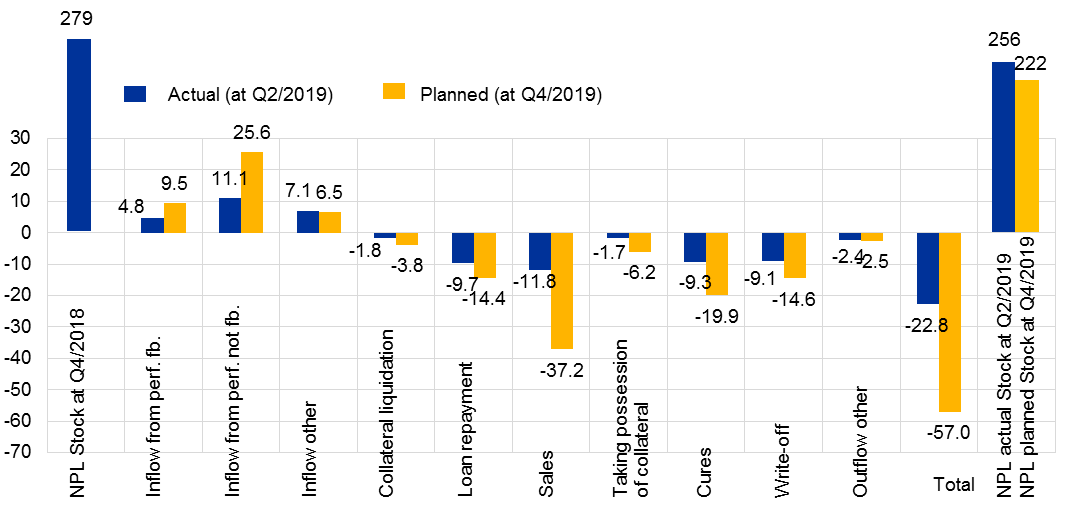
Source: ECB.
7.1.3.3 Looking ahead: NPA reduction strategies: three-year projected horizon
- Banks with higher levels of NPLs are expected to have three-year reduction strategies in place for NPAs (non-performing loans and foreclosed assets[3]).
- The following represents the actual existing stock of non-performing assets for year-end 2018 for 32 high-NPL banks[4]. The 2019-21 bar charts represent the banks’ own projected level of volume reduction of NPAs over the period end-2019 to end-2021.
Chart 28
NPA reduction strategies: Planned evolution of non-performing assets

Source: ECB.
- As part of the NPL reduction strategies, banks are expected to forecast the reduction of NPLs by portfolio, reduction option and vintage bucket.
- The purpose of this is for JSTs to be aware of whether the banks are intending to address NPLs of older vintages in a sufficient manner.
- Based on the following chart, the banks are projecting a reduction in volume of very old NPL vintages over the period 2019-21. Vintages of two-five years are projected by banks to remain constant and there is a projected increase in the relative share of unlikely to pay loans.
- JSTs as part of their engagement with banks analyse such movements and underlying drivers, compare against peers and follow up and seek bank remediation on issues where identified.
Chart 29
NPL reduction strategies: Planned evolution of NPLs by loan vintages
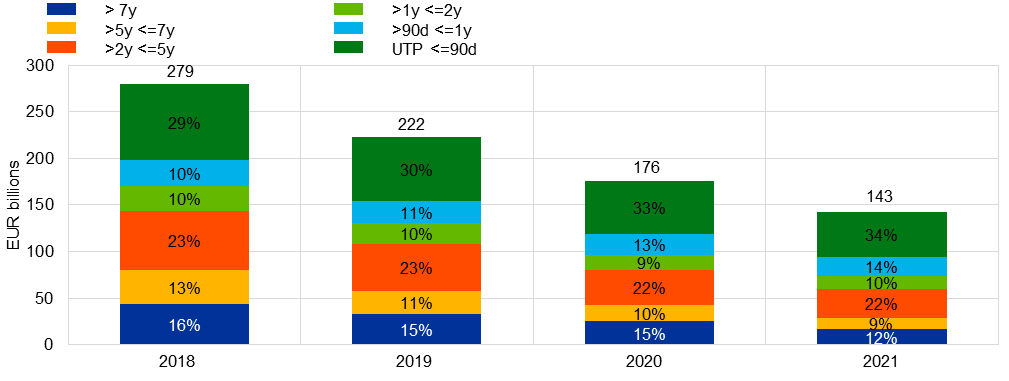
Source: ECB.
7.2 Market risk
7.2.1 Key messages
- The market risk score has captured the volatility in the financial markets since 2018. Credit spread risk has been assessed as material for around half of the significant institutions.
- The overall SREP scores of significant institutions generally reflect the perception by the market of their risk profiles. CDS spreads are higher for significant institutions with worse SREP scores, in line with their risk profile.
Chart 30
Element 3: Risks to capital – market risk SREP scores 2017, 2018 and 2019:
Source: SREP 2019 values based on 109 SREP 2019 decisions finalised as of 31 December 2019. SREP 2018 values based on 107 SREP 2018 decisions finalised as of 31 January 2019 and presented in the SSM SREP Methodology Booklet – 2018 edition. SREP 2017 values based on 105 SREP 2017 decisions finalised as of 30 November 2017 and presented in the SSM SREP Methodology Booklet – 2017 edition.
Note: “i” refers to the significant institutions with market risk considered immaterial from a SREP methodology perspective.
7.2.2 Breakdown by business model
- The following shows the distribution of market risk scores across various business model categories of significant institutions.
- There is a high concentration in score 2 across all business models.
- G-SIB’s scores are mainly concentrated in score 2 and score 3 and this is the only business model category to have a proportion of score 4.
- All business models, expect for G-SIBs and universal banks have some banks scored 1 in market risk for 2019.
Chart 31
Breakdown of market risk SREP scores by business model:
Source: SREP 2019 values based on 109 SREP 2019 decisions finalised as of 31 December 2019.
Note: “i” refers to the significant institutions with market risk considered immaterial from a SREP methodology perspective.
7.3 Interest rate risk in the banking book
7.3.1 Key messages
- Scores are concentrated in score 2 and score 3 for IRRBB risk.
- IRRBB risk was generally stable for 2019.
Chart 32
Element 3: Risks to capital – IRRBB SREP scores 2017, 2018 and 2019:
Source: SREP 2019 values based on 109 SREP 2019 decisions finalised as of 31 December 2019. SREP 2018 values based on 107 SREP 2018 decisions finalised as of 31 January 2019 and presented in the SSM SREP Methodology Booklet – 2018 edition. SREP 2017 values based on 105 SREP 2017 decisions finalised as of 30 November 2017 and presented in the SSM SREP Methodology Booklet – 2017 edition.
7.3.2 Breakdown by business model
- The following shows the distribution of IRRBB scores across various business model categories of significant institutions.
- There is a high concentration in score 2 and score 3 across all business models categories.
Chart 33
Breakdown of IRRBB SREP scores by business model:
Source: SREP 2019 values based on 109 SREP 2019 decisions finalised as of 31 December 2019.
7.4 Operational risk
7.4.1 Key messages
- Some significant institutions that reported material operational losses are scored 3 or 4. These losses are mostly due to conduct risk events.
- Some significant institutions underestimated their 2018 losses in the stress test even in the adverse scenario. Back-testing and continued monitoring of risk parameters should be a key focus for significant institutions.
Chart 34
Element 3: Risks to capital – operational risk SREP scores 2017, 2018 and 2019:
Source: SREP 2019 values based on 109 SREP 2019 decisions finalised as of 31 December 2019. SREP 2018 values based on 107 SREP 2018 decisions finalised as of 31 January 2019 and presented in the SSM SREP Methodology Booklet – 2018 edition. SREP 2017 values based on 105 SREP 2017 decisions finalised as of 30 November 2017 and presented in the SSM SREP Methodology Booklet – 2017 edition.
7.4.2 Breakdown by business model
- The following shows the distribution of operational risk scores across various business model categories of significant institutions.
- There is a high concentration in score 3 across all business models.
- Diversified lenders and custodians and asset managers have the highest proportion of score 4.
Chart 35
Breakdown of operational risk SREP scores by business model:
Source: SREP 2019 values based on 109 SREP 2019 decisions finalised as of 31 December 2019.
7.4.3 Focus on conduct losses
- For the period end 2016 to end 2018, conduct losses represent a consistently large proportion of overall significant institutions’ operational losses.
- For the period to end-2018, conduct losses represented 54% of overall total operational losses reported by significant institutions (€9.6 billion out of €17.9 billion).
- The most significant out of the wide range of conduct losses relate to mortgage redress issues and fines especially by US authorities for issues such as AML violations.
Chart 36
Conduct risk losses vs. non-conduct risk losses:
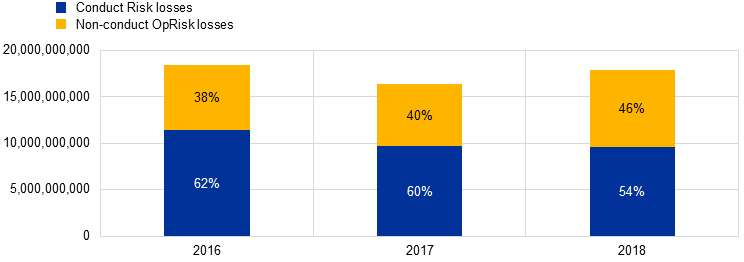
Source: 102 SIs in 2016 and 2017 with available data, 105 SIs in 2018.
Note: Conduct Risk approximated with Basel Event Type Clients, Products and Business Practices as per SSM methodology Loss amounts include losses from new events in that particular year and adjustments of losses first accounted for and reported in previous years. These amounts are floored at 0 for each bank and year (as adjustments can also be negative).
8 Element 4: Risks to liquidity
8.1 Key messages
- Many significant institutions have missed their own funding plan targets for 2018, as outlined in the EBA funding plan reports.
- Overall scores show in general a good liquidity position of banks and it is in line with the results of the Liquidity Stress Test (LiST) exercise.
- LiST 2019: Sensitivity Analysis of Liquidity Risk – Stress Test 2019 was carried out by the ECB to assess banks’ ability to withstand hypothetical idiosyncratic liquidity shocks. The results are being used in the SREP assessment and were discussed with the banks. The two main outcome metrics of the LiST, survival period and cliff effect, had an impact on the Liquidity Adequacy Score (Element 4), while the qualitative information (data availability and quality, timeliness of submissions) informed Element 2. The results did not have an impact on the capital requirements. For further details, please refer to Sensitivity Analysis of Liquidity Risk – Stress Test 2019 Final results.
Chart 37
Element 4: Risks to liquidity SREP scores 2017, 2018 and 2019:
Source: SREP 2019 values based on 109 SREP 2019 decisions finalised as of 31 December 2019. SREP 2018 values based on 107 SREP 2018 decisions finalised as of 31 January 2019 and presented in the SSM SREP Methodology Booklet – 2018 edition. SREP 2017 values based on 105 SREP 2017 decisions finalised as of 30 November 2017 and presented in the SSM SREP Methodology Booklet – 2017 edition.
8.2 Breakdown by business model
- The following shows the distribution of liquidity risk scores across various business model categories of significant institutions.
- There is a high concentration in score 2 across all business models with varying proportions of scores 1, 3 and 4 depending on business model category.
Chart 38
Breakdown of liquidity risk SREP scores by business model:
Source: SREP 2019 values based on 109 SREP 2019 decisions finalised as of 31 December 2019.
9 ICAAP/ILAAP key messages
- Overall ICAAPs and ILAAPs show significant need for improvements.
- The biggest areas of concern are risk data and IT. Indeed, ICAAP approaches are very heterogeneous across banks, ICAAP figures reflect massive data quality issues and the quality of banks’ ILAAP submissions has not improved. ICAAP and ILAAP deficiencies are reflected in other parts of the SREP and in qualitative supervisory measures.
- The ECB published its expectations on the ICAAP and the ILAAP in its ECB Guides to ICAAP and ILAAP which are aimed at assisting institutions in strengthening their ICAAPs and ILAAPs and at encouraging the use of best practices by explaining in greater detail the ECB’s expectations of the ICAAP and the ILAAP, leading to more consistent and effective supervision.
- It is important to note that the terms “non-performing exposure” (NPE) and “non-performing loan”(NPL) are used interchangeably in this document. NPL is generally used in this document as ashorthand term as explained in Guidance to banks on non-performing loans (March 2017).
- The definition of high NPL bank” is described in paragraphs 10 to 12 of the EBA Guidelines.
- Definition of foreclosed assets as per Guidance to banks on non-performing loans (March 2017), Section 7.5.
- The definition of “high NPL bank” is described in paragraphs 10 to 12 of the EBA Guidelines.