- PRESS RELEASE
ECB publishes supervisory banking statistics on significant institutions for the third quarter of 2024
20 December 2024
[Chart 3 was updated on 4 March 2025 at 17:00 CET to correct errors in the "Non-performing loans (including cb) (left-hand scale)" measures for the years 2015-2024.]
- Aggregate Common Equity Tier 1 ratio at 15.72% in third quarter of 2024, down from 15.81% in previous quarter but up from 15.61% one year ago
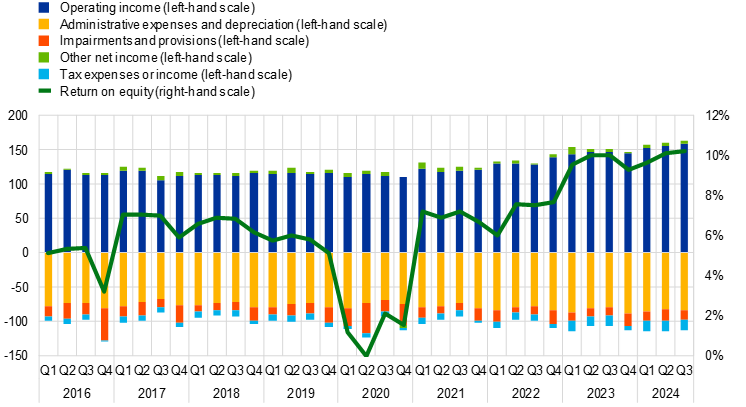
- Aggregated annualised return on equity at 10.22% in third quarter of 2024, up from 10.11% in previous quarter, representing second consecutive highest reported value since start of time series (second quarter of 2015)
- Aggregate non-performing loans ratio (excluding cash balances) stable at 2.31% compared with 2.30% in previous quarter and 2.27% in third quarter of 2023
- Share of loans showing significant increase in credit risk (stage 2 loans) at 9.67%, up from 9.45% in previous quarter and from 9.29% one year ago
Capital adequacy
The aggregate capital ratios of significant institutions (banks supervised directly by the ECB) were down quarter on quarter in the third quarter of 2024 but up from one year ago. The aggregate Common Equity Tier 1 (CET1) ratio stood at 15.72%, the aggregate Tier 1 ratio stood at 17.15% and the aggregate total capital ratio stood at 19.81%. The quarterly development was driven by the €161.29 billion increase in total risk exposure (denominator). This outweighed the growth of the capital amounts (numerators), up €20.61 billion on average from the previous quarter. The CET1 ratio ranged from 12.82% in Spain to 22.76% in Latvia in the third quarter of 2024.
Chart 1
Capital ratios and CET1 amount
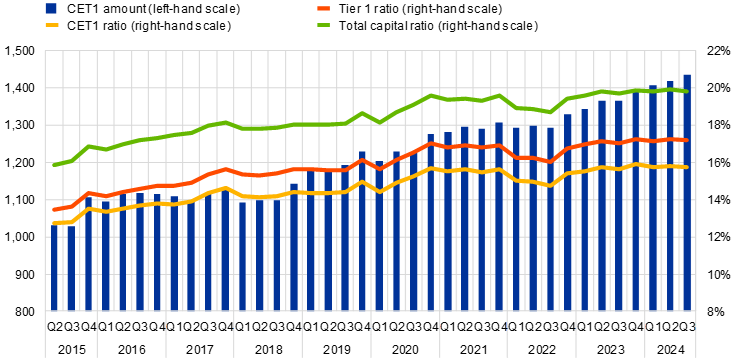
Source: ECB.
Chart 2
CET1 ratios by country
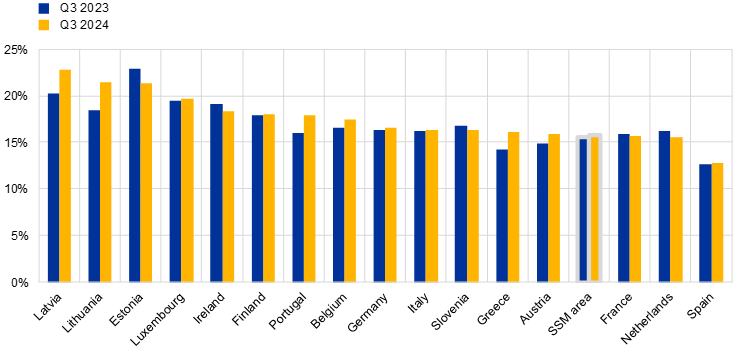
Source: ECB.
Notes: “SSM” stands for “Single Supervisory Mechanism”. Some countries participating in European banking supervision are not included in this chart, either for confidentiality reasons or because there are no significant institutions at the highest level of consolidation in that country.
Asset quality
The non-performing loans (NPL) ratio excluding cash balances at central banks and other demand deposits stood at 2.31% in the third quarter of 2024. The stock of NPLs (numerator) increased by €4.66 billion to €360.54 billion, while the total amount of loans and advances (denominator) rose by €130.29 billion to €15.59 trillion, keeping the ratio stable with respect to the previous quarter (2.30%).
At sector level, the NPL ratio in the third quarter of 2024 stood at 3.65% for loans to non-financial corporations (NFCs) (up from 3.56% in the previous quarter and 3.40% one year ago) and at 2.25% for loans to households (up from 2.23% in the previous quarter and 2.21% one year ago). The NPL ratio for loans to NFCs collateralised by commercial immovable property stood at 4.56%, down compared with 4.61% in the previous quarter, but up from 4.22% one year ago. The NPL ratio stood at 4.88% for loans to small and medium-sized enterprises, up from 4.81% and 4.52% in the previous quarter and previous year respectively.
Aggregate stage 2 loans as a share of total loans increased to 9.67% (from 9.45% in the previous quarter). The ratio rose to 13.93% considering loans to NFCs only and to 9.11% for loans to households (from 13.56% and 8.80% respectively in the previous quarter).
Chart 3
Non-performing loans
(EUR billions)
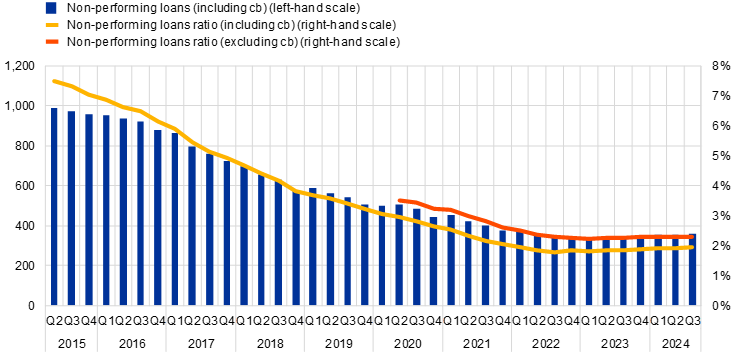
Source: ECB.
Note: “cb” stands for cash balances and other demand deposits.
Chart 4
Non-performing loans by counterparty sector
a) Breakdown of NFC portfolio by segment | b) Breakdown of household portfolio by segment |
|---|---|
 |  |
Source: ECB.
Chart 5
Stage 2 loans and advances as a share of total loans and advances subject to impairment review
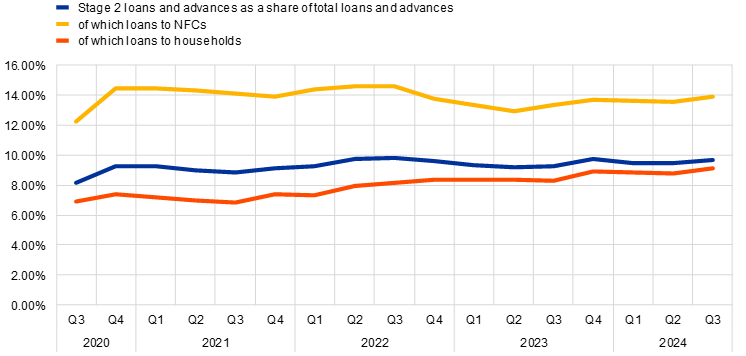
Source: ECB.
Note: Stage 2 includes assets that have shown a significant increase in credit risk since initial recognition.
Profitability
The aggregated annualised return on equity stood at 10.22% in the third quarter of 2024 compared with 10.11% in the previous quarter and 10.01% in the third quarter of 2023. A sizeable increase in operating income, mainly driven by higher net interest income, which rose by 4.10% year on year, was in fact balanced by a higher level of equity (owing to an 8.16% increase in reserves compared with one year ago).
Following the increase in 2022 and 2023, the aggregated net interest margin reached a peak of 1.56% in the third quarter of 2023. Since then, the net interest margin has remained stable at around 1.60%, albeit with noticeable structural differences across countries: it ranged from 0.89% in France to 3.69% in Latvia in the third quarter of 2024.
Chart 6
Return on equity and composition of net profit and loss
(EUR billions)
Source: ECB.
Chart 7
Net interest margin (NIM)
a) NIM by reported period | b) NIM by country |
|---|---|
 |  |
Source: ECB.
Notes: “SSM” stands for “Single Supervisory Mechanism”. Some countries participating in European banking supervision are not included in this chart, either for confidentiality reasons or because there are no significant institutions at the highest level of consolidation in that country.
Factors affecting changes
Supervisory banking statistics are calculated by aggregating the data reported by banks which report COREP (capital adequacy information) and FINREP (financial information) data at the relevant point in time. Consequently, changes from one quarter to the next can be influenced by the following factors:
- changes in the sample of reporting institutions;
- mergers and acquisitions;
- reclassifications (e.g. portfolio shifts as a result of certain assets being reclassified from one accounting portfolio to another).
For media queries, please contact Nicos Keranis, tel.: +49 172 758 7237.
Notes
- The complete set of Supervisory banking statistics with additional quantitative risk indicators is available on the ECB’s banking supervision website. The time series are also available for download from the ECB Data Portal.
European Central Bank
Directorate General Communications
- Sonnemannstrasse 20
- 60314 Frankfurt am Main, Germany
- +49 69 1344 7455
- media@ecb.europa.eu
Reproduction is permitted provided that the source is acknowledged.
Media contacts