- PRESS RELEASE
ECB publishes supervisory banking statistics on significant institutions for the third quarter of 2023
12 January 2024
- Aggregate Common Equity Tier 1 ratio at 15.61% in third quarter of 2023 (compared with 15.72% in previous quarter and 14.74% in third quarter of 2022)
- Aggregated annualised return on equity at 10.01% in third quarter of 2023 (compared with 10.04% in second quarter of 2023 and 7.55% in third quarter of 2022)
- Aggregate non-performing loans ratio (excluding cash balances) stable at 2.27% (compared with 2.26% in previous quarter)
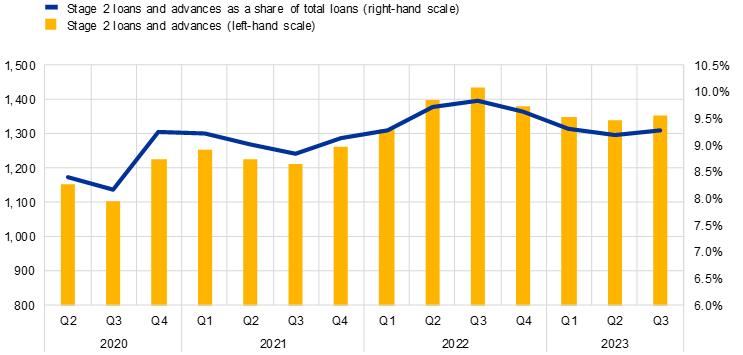
- Share of loans showing significant increase in credit risk (stage 2 loans) rose slightly to 9.29% (up from 9.19% in previous quarter)
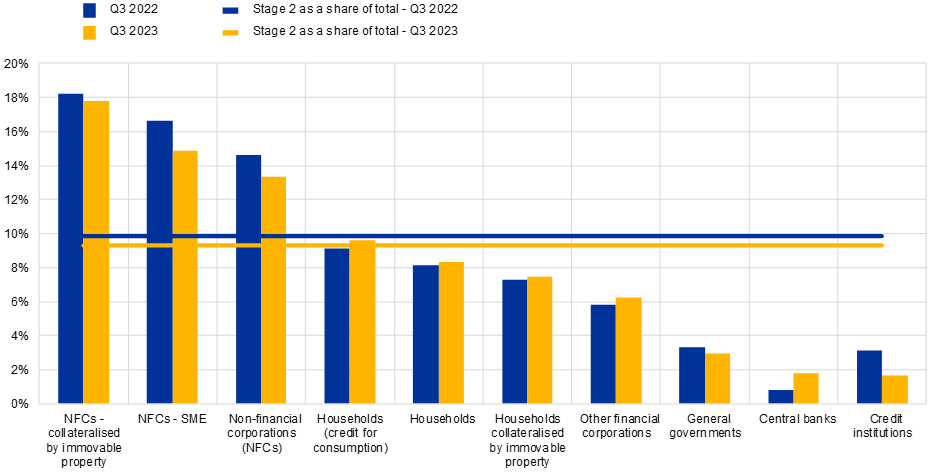
- Statistics include the ratio of loans and advances with significant increase in credit risk (stage 2) by counterparty and loan type for the first time.
Capital adequacy
The aggregate capital ratios of significant institutions (i.e. those banks that are supervised directly by the ECB) were basically unchanged in the third quarter of 2023. The aggregate Common Equity Tier 1 (CET1) ratio stood at 15.61%, the aggregate Tier 1 ratio stood at 17.03% and the aggregate total capital ratio stood at 19.69%. Aggregate CET1 ratios at country level ranged from 12.63% in Spain to 23.01% in Estonia. Across Single Supervisory Mechanism business model categories, global systemically important banks (G-SIBs) reported the lowest aggregate CET1 ratio (14.56%).
Chart 1
Capital ratios and their components
(EUR billions; percentages)
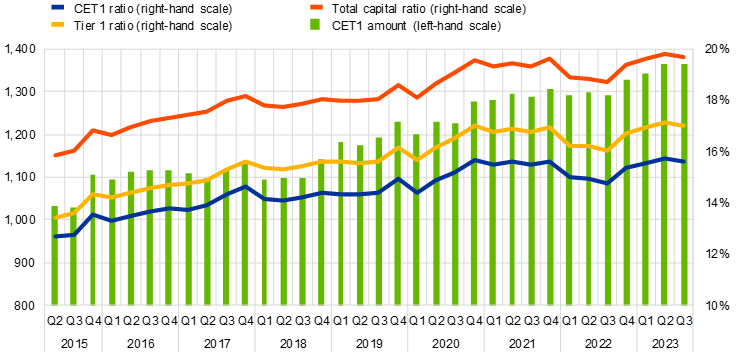
Source: ECB.
Chart 2
Capital ratios by country for the third quarter of 2023
(percentages)
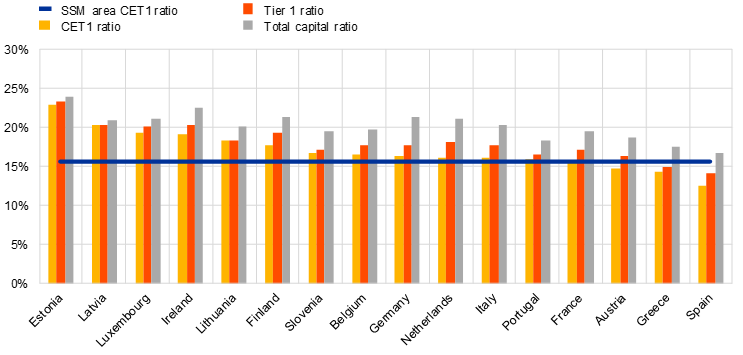
Source: ECB.
Note: Some countries participating in European banking supervision are not included in this chart, either for confidentiality reasons or because there are no significant institutions at the highest level of consolidation in that country.
Chart 3
Capital ratios by business model for the third quarter of 2023
(percentages)
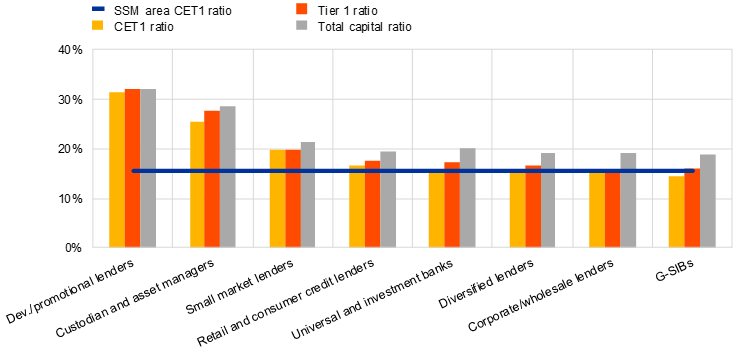
Source: ECB.
Notes: “G-SIBs” stands for “global systemically important banks”. “Dev./promotional lenders” stands for “development/promotional lenders”. SSM stands for “Single Supervisory Mechanism”.
Asset quality
The non-performing loans (NPL) ratio excluding cash balances at central banks and other demand deposits remained stable, standing at 2.27% in the third quarter of 2023. The stock of NPLs (numerator) was basically unchanged at €345 billion, while the total of loans and advances excluding cash balances (denominator) increased slightly to €15,183 billion.
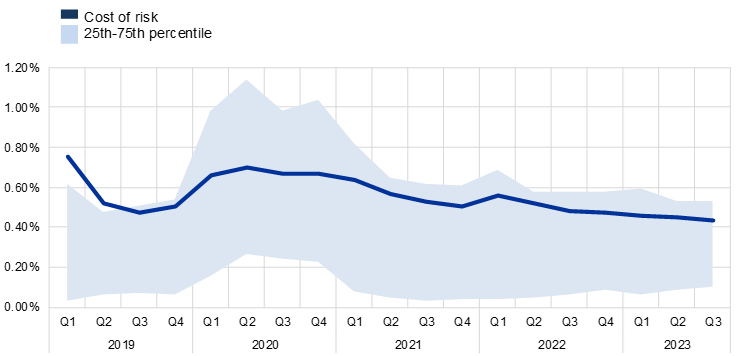
Cost of risk was stable, standing at an aggregate level of 0.43% in the third quarter of 2023 (compared with 0.45% in the previous quarter). Across significant institutions, the interquartile range narrowed to 0.43 percentage points (slightly down from 0.44 percentage points in the previous quarter).
Aggregate stage 2 loans as a share of total loans increased slightly to 9.29% (up from 9.19% in the previous quarter). The stock of stage 2 loans amounted to €1,356 billion (compared with €1,339 billion in the previous quarter).
Chart 4
Non-performing loans
(EUR billions; percentages)
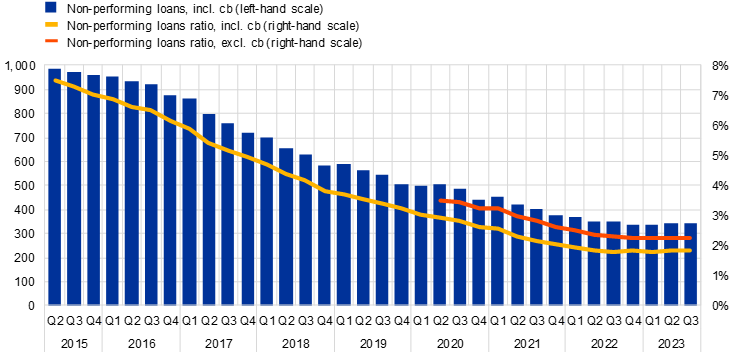
Source: ECB.
Note: “cb” refers to cash balances at central banks and other demand deposits.
Chart 5
Cost of risk
(percentages)
Source: ECB.
Chart 6
Loans and advances subject to impairment review
(EUR billions; percentages)
Source: ECB.
Note: Stage 2 includes assets that have shown a significant increase in credit risk since initial recognition.
Loans and advances with significant increase in credit risk (stage 2) by counterparty
From now on, supervisory banking statistics include the counterparty breakdown of the share of loans and advances with significant increase in credit risk (stage 2). The stage 2 ratio exhibits different dynamics at sector level, ranging from 17.82% for loans to non-financial corporations (NFCs) collateralised by immovable property to 1.65% for loans to credit institutions in the third quarter of 2023.
Chart 7
Stage 2 loan ratio by counterparty
(percentages)
Source: ECB.
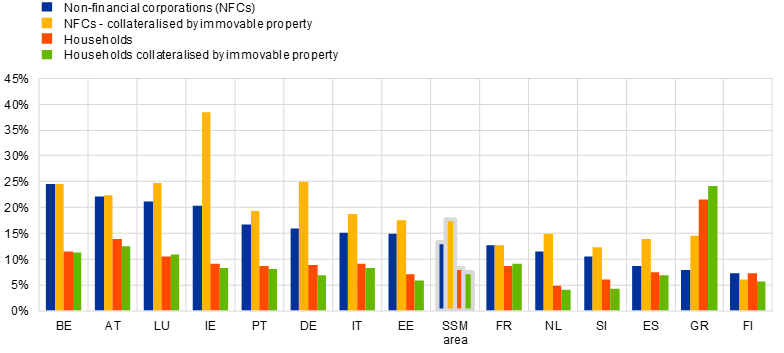
Differences in the ratios are noticeable also across jurisdictions as displayed in chart 8. Belgium reported the highest stage 2 ratio to NFCs (24.49%) compared to 7.35% in Finland.
Chart 8
Stage 2 loan ratio by counterparty and country for the third quarter of 2023
(percentages)
Source: ECB.
Note: Some countries participating in European banking supervision are not included in this chart, either for confidentiality reasons or because there are no significant institutions at the highest level of consolidation in that country.
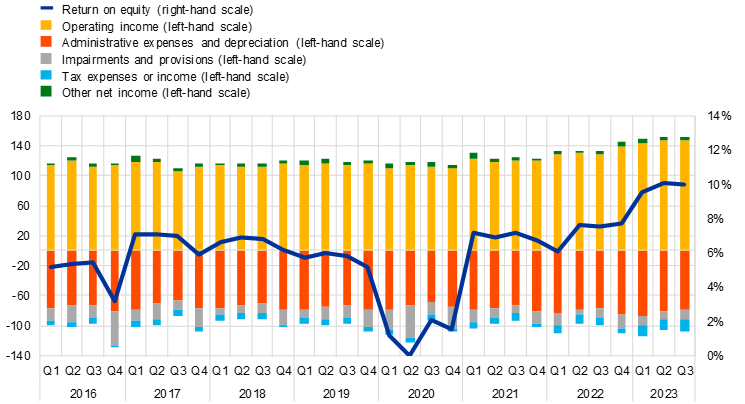
Return on equity
The aggregated annualised return on equity stood at 10.01% in the third quarter of 2023 (compared with 7.55% in the third quarter of 2022). A sizeable increase in operating income (driven by higher net interest income, which rose by 24% year on year) was the main contributor to the increase in aggregate net profit (the numerator of the return on equity).
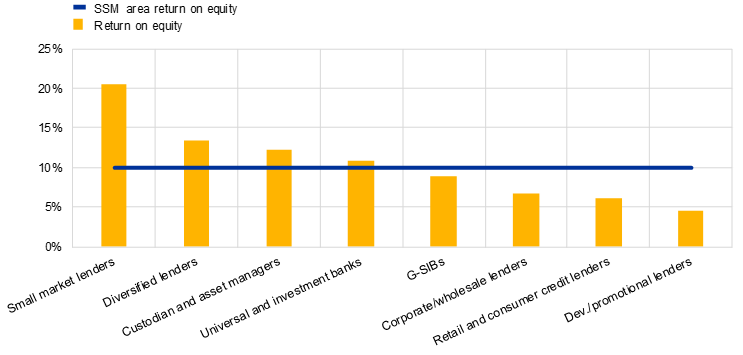
Across Single Supervisory Mechanism business model categories, the aggregate annualised return on equity ranged from 4.55% for development/promotional lenders to 20.49% for small market lenders.
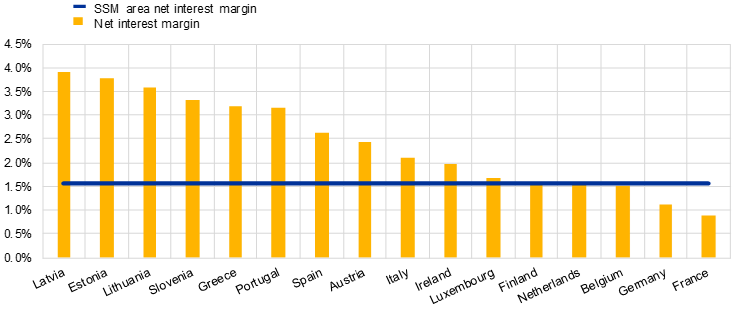
In the third quarter of 2023, the net interest margin increased further to 1.56% (compared with 1.23% one year ago), while showing structural differences across countries. This ratio ranged from 0.89% in France to 3.90% in Latvia.
Chart 9
Return on equity and composition of net profit and loss
(EUR billions; percentages)
Source: ECB.
Chart 10
Return on equity by business model for the third quarter of 2023
(percentages)
Source: ECB.
Note: “G-SIBs” stands for “global systemically important banks”. “Dev./promotional lenders” stands for “Development/promotional lenders”. SSM stands for “Single Supervisory Mechanism”.
Chart 11
Net interest margin by country for the third quarter of 2023
(percentages)
Source: ECB.
Note: Some countries participating in European banking supervision are not included in this chart, either for confidentiality reasons or because there are no significant institutions at the highest level of consolidation in that country.
Factors affecting changes
Supervisory banking statistics are calculated by aggregating the data that are reported by banks which report COREP (capital adequacy information) and FINREP (financial information) at the relevant point in time. Consequently, changes from one quarter to the next can be influenced by the following factors:
- changes in the sample of reporting institutions;
- mergers and acquisitions;
- reclassifications (e.g. portfolio shifts as a result of certain assets being reclassified from one accounting portfolio to another).
For media queries, please contact Philippe Rispal, tel.: +49 69 1344 5482.
Notes
- The complete set of Supervisory banking statistics with additional quantitative risk indicators is available on the ECB’s banking supervision website.
European Central Bank
Directorate General Communications
- Sonnemannstrasse 20
- 60314 Frankfurt am Main, Germany
- +49 69 1344 7455
- media@ecb.europa.eu
Reproduction is permitted provided that the source is acknowledged.
Media contacts