- Press release
ECB publishes supervisory banking statistics for the fourth quarter of 2021
8 April 2022
- Aggregate Common Equity Tier 1 ratio remained stable at 15.48% in fourth quarter of 2021
- Aggregated annualised return on equity decreased to 6.72% (compared with 7.19% in previous quarter, and up from 1.53% one year ago)
- Aggregate non-performing loans ratio fell further to 2.06% (down from 2.17% in previous quarter), with stock of non-performing loans declining to €374 billion (down from €401 billion in previous quarter)
- Share of loans that show a significant increase in credit risk (stage 2 loans) slightly up in fourth quarter at 9.14% (compared with 8.85% in previous quarter), but still below level recorded one year ago (9.27%)
Capital adequacy
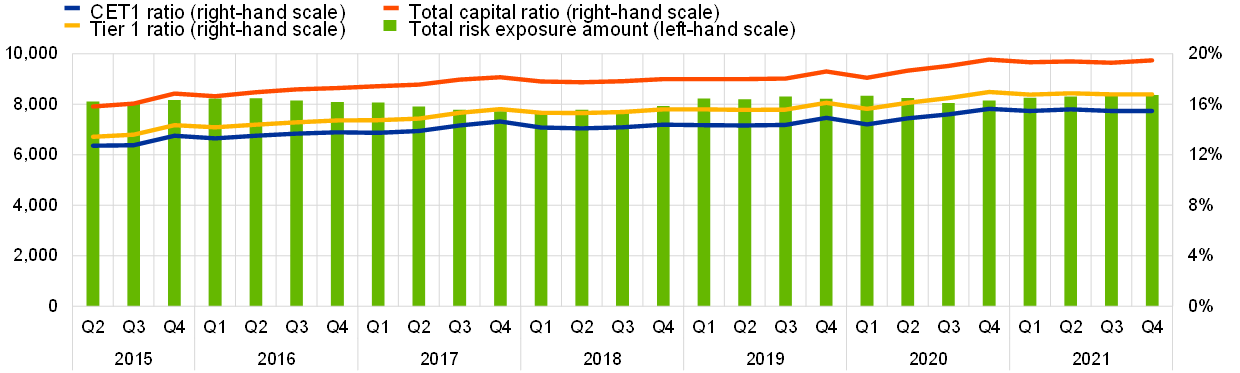
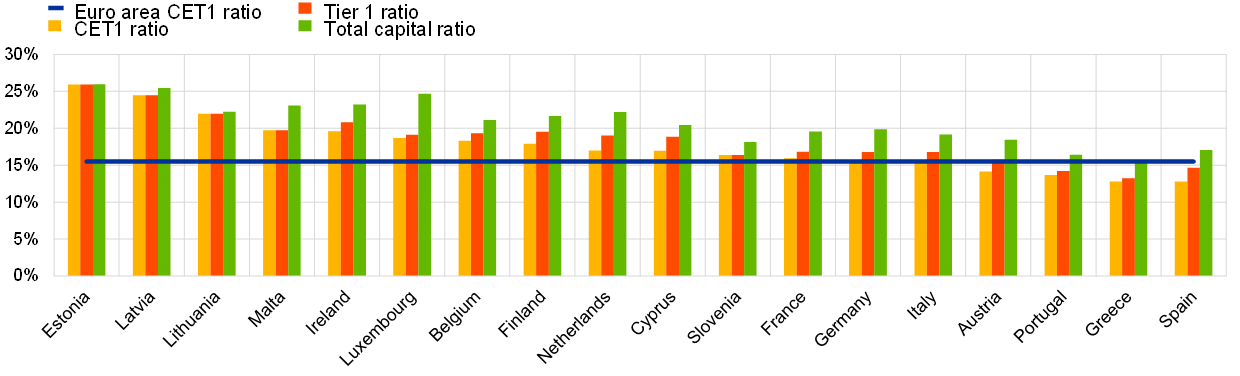
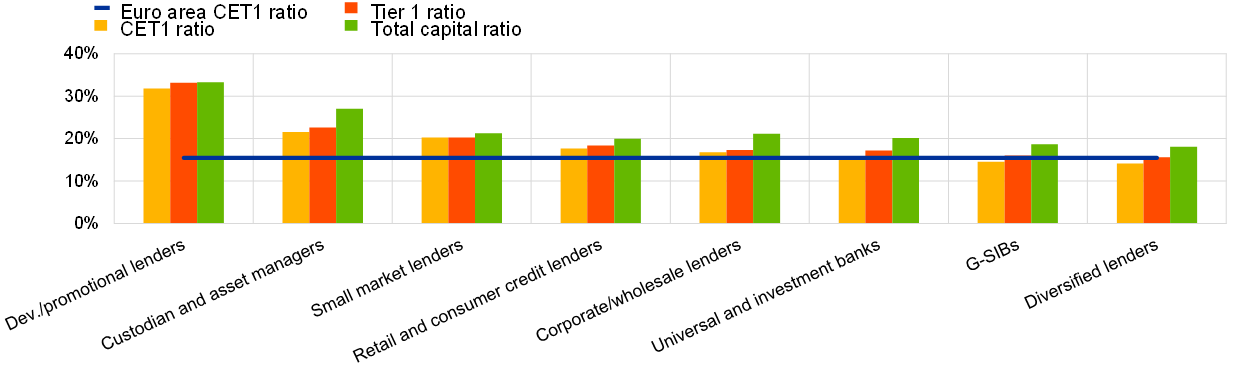
The aggregate capital ratios of significant institutions (i.e. those banks that are supervised directly by the ECB) remained stable in the fourth quarter of 2021. The aggregate Common Equity Tier 1 (CET1) ratio stood at 15.48%, the aggregate Tier 1 ratio stood at 16.80% and the aggregate total capital ratio stood at 19.48%. Aggregate CET1 ratios at the country level ranged from 12.80% in Spain and Greece to 25.91% in Estonia. Across Single Supervisory Mechanism business model categories, diversified lenders reported the lowest aggregate CET1 ratio (14.17%) and development/promotional lenders reported the highest (31.86%).
Chart 1
Capital ratios and their components by reference period
(EUR billions; percentages)
Source: ECB.
Chart 2
Capital ratios by country for the fourth quarter of 2021
(percentages)
Source: ECB.
Note: Some countries participating in European banking supervision are not included in this chart, either for confidentiality reasons or because there are no significant institutions at the highest level of consolidation in that country.
Chart 3
Capital ratios by business model for the fourth quarter of 2021
(percentages)
Source: ECB.
Note: G-SIBs stands for global systemically important banks. “Dev./promotional lenders” stands for Development/promotional lenders.
Asset quality
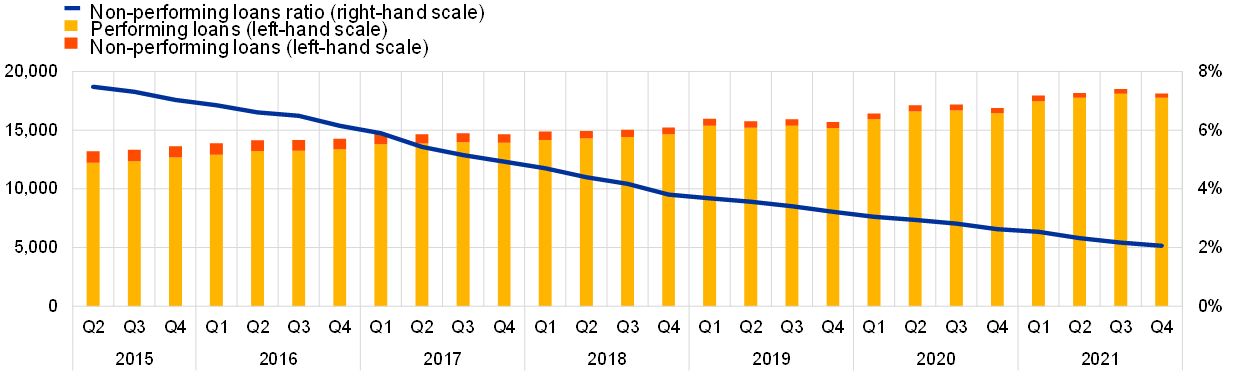
The aggregate non-performing loans (NPL) ratio decreased further to 2.06% in the fourth quarter of 2021, the lowest level recorded since supervisory banking statistics were first published in the second quarter of 2015. The decrease was driven by a further decline in the stock of NPLs to €374 billion (compared with €401 billion in the previous quarter). At the country level, the average NPL ratio ranged from 0.58% in Luxembourg to 7.04% in Greece. Across business model categories, custodians and asset managers reported the lowest aggregate NPL ratio (0.23%) and diversified lenders reported the highest (3.27%).
The aggregate stage 2 loans as a share of total loans increased for the first time during 2021, reaching 9.14% in the fourth quarter (up from 8.85% in the previous quarter, and down from 9.27% last year). The stock of stage 2 loans amounted to €1,261 billion (compared with €1,215 billion in the previous quarter).
Chart 4
Non-performing loans by reference period
(EUR billions; percentages)
Source: ECB.
Chart 5
Non-performing loans ratio by country for the fourth quarter of 2021
(percentages)
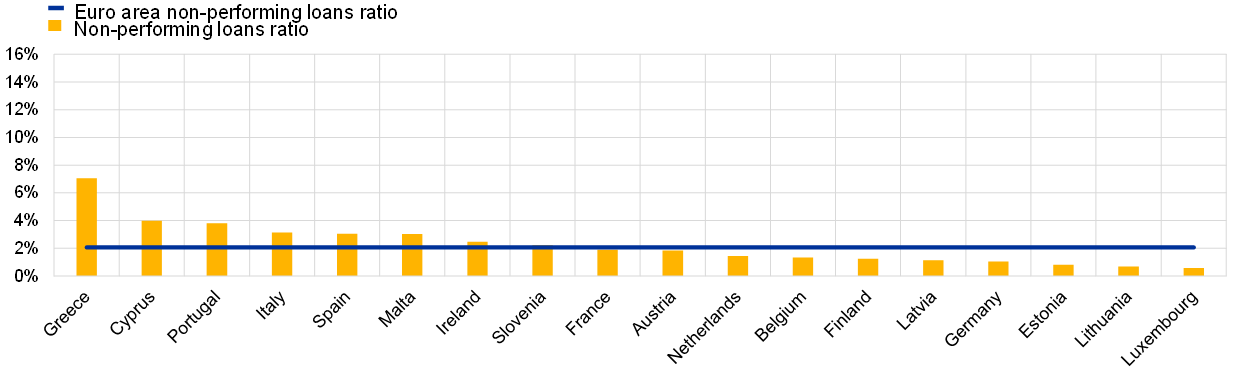
Source: ECB.
Note: Some countries participating in European banking supervision are not included in this chart, either for confidentiality reasons or because there are no significant institutions at the highest level of consolidation in that country.
Chart 6
Non-performing loans ratio by business model for the fourth quarter of 2021
(percentages)
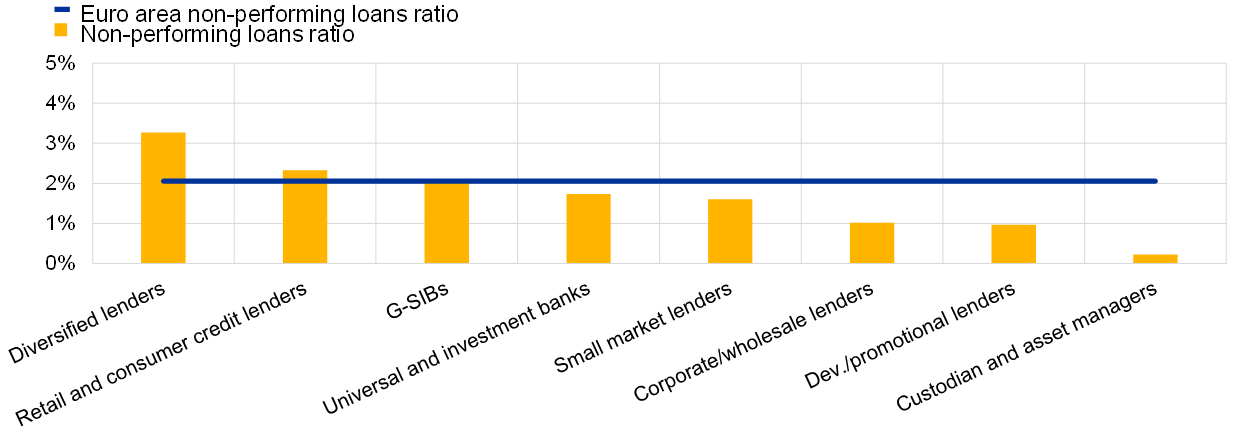
Source: ECB.
Note: G-SIBs stands for global systemically important banks. “Dev./promotional lenders” stands for Development/promotional lenders.
Chart 7
Loans and advances subject to impairment review by reference period
(EUR billions; percentages)
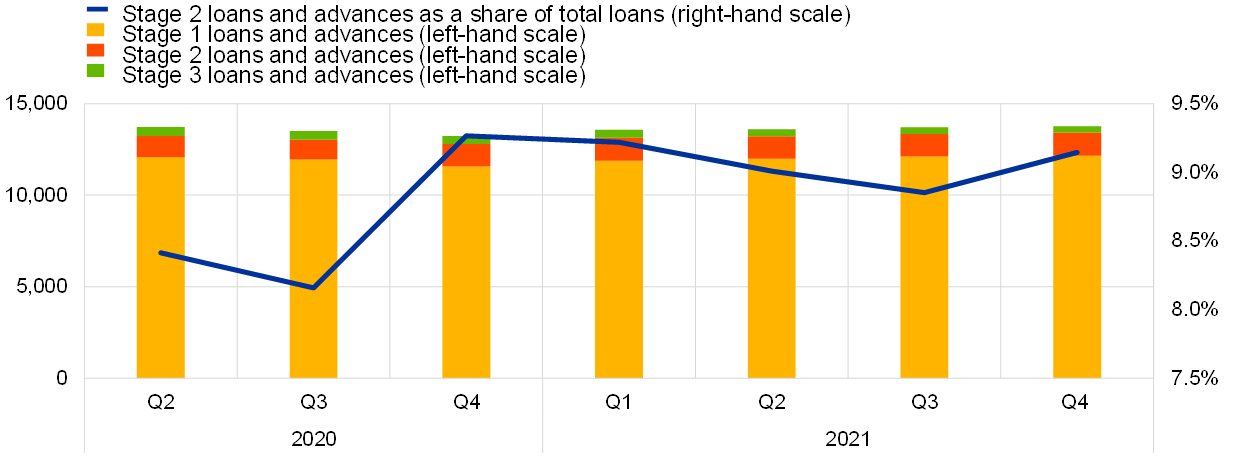
Source: ECB.
Return on equity
The aggregated annualised return on equity decreased to 6.72% in the fourth quarter of 2021 (compared with 7.19% in the previous quarter, and up from 1.53% one year ago). The generation of operating income remained largely stable (€121 billion in the fourth quarter of 2021, compared to €120 billion in the third quarter), while administrative expenses and depreciation as well as impairments and provisions increased.
Chart 8
Return on equity and composition of net profit and loss by reference period
(EUR billions; percentages)
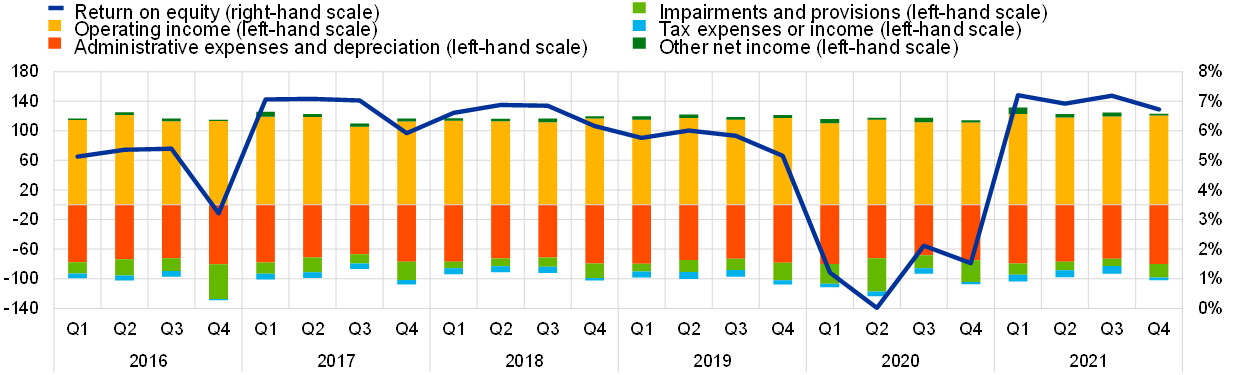
Source: ECB.
Funding
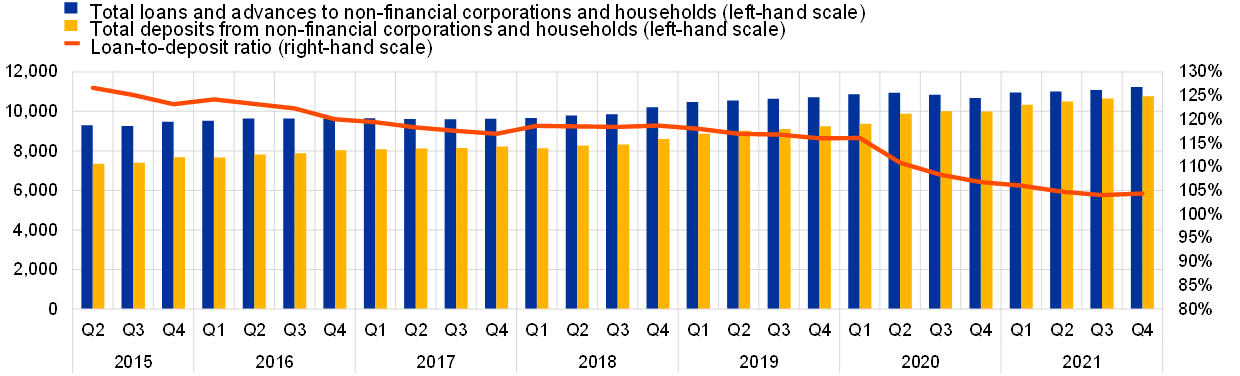
The aggregate loan-to-deposit ratio stood at 104.37% in the fourth quarter of 2021, up from 104.03% in the previous quarter. The increase in deposits (+€105 billion compared with the third quarter of 2021) was overcompensated by an increase in loans and advances to non-financial corporations and households (+€146 billion compared with the third quarter of 2021).
Chart 9
Loan-to-deposit ratio by reference period
(EUR billions; percentages)
Source: ECB.
Loans and advances subject to COVID-19-related measures
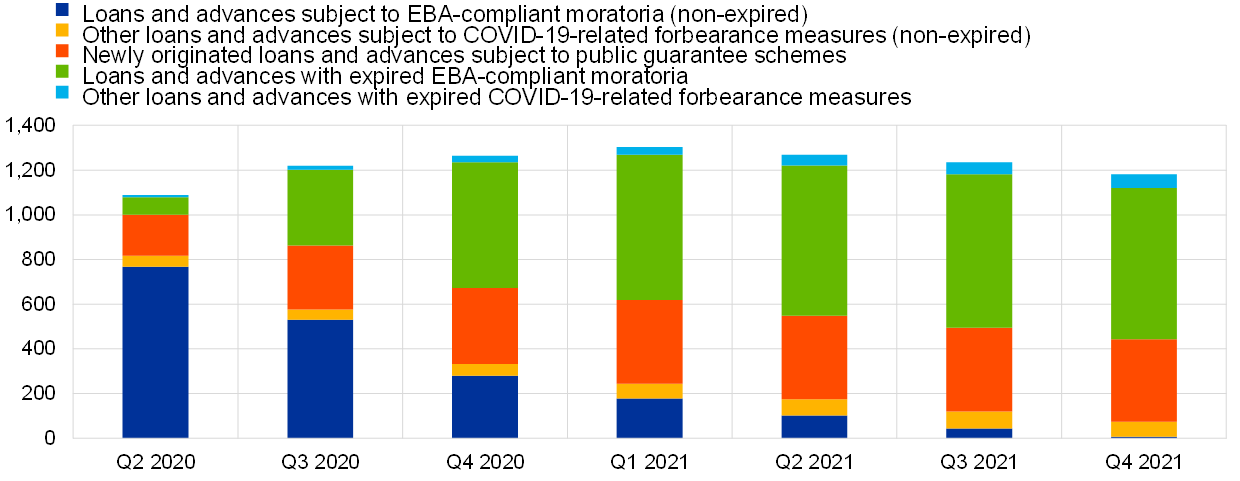
In the fourth quarter of 2021 the total loans and advances subject to COVID-19-related measures decreased further to €444 billion, down from €494 billion in the previous quarter. The decrease was driven by loans and advances subject to non-expired moratoria compliant with European Banking Authority (EBA) guidelines, which declined to €6 billion from €44 billion in the third quarter of 2021. Loans and advances with expired COVID-19-related measures decreased slightly for the first time to €738 billion, of which €207 billion (28.01%) are in stage 2 and €52 billion (7.02%) are non-performing.
Chart 10
Loans and advances subject to COVID-19-related measures by reference period
(EUR billions)
Source: ECB.
Factors affecting changes
Supervisory banking statistics are calculated by aggregating the data that are reported by banks which report COREP (capital adequacy information) and FINREP (financial information) at the relevant point in time. Consequently, changes from one quarter to the next can be influenced by the following factors:
- changes in the sample of reporting institutions;
- mergers and acquisitions;
- reclassifications (e.g. portfolio shifts as a result of certain assets being reclassified from one accounting portfolio to another).
For media queries, please contact Philippe Rispal, tel.: +49 69 1344 5482.
Notes
- The complete set of Supervisory banking statistics with additional quantitative risk indicators is available on the ECB’s banking supervision website.
Eiropas Centrālā banka
Komunikācijas ģenerāldirektorāts
- Sonnemannstrasse 20
- 60314 Frankfurt am Main, Germany
- +49 69 1344 7455
- media@ecb.europa.eu
Pārpublicējot obligāta avota norāde.
Kontaktinformācija plašsaziņas līdzekļu pārstāvjiem