- 12 July 2019
- PRESS RELEASE
ECB publishes supervisory banking statistics for the first quarter of 2019
- Capital ratios for significant institutions remain stable in the first quarter of 2019, with total capital ratio at 17.99% and CET1 at 14.34%.
- NPL ratio decreases further to 3.67%, lowest level since time series first published in 2015.
- Liquidity coverage ratio increases to 149.71%.
Capital adequacy
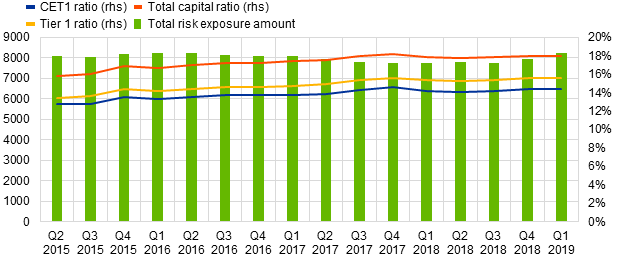
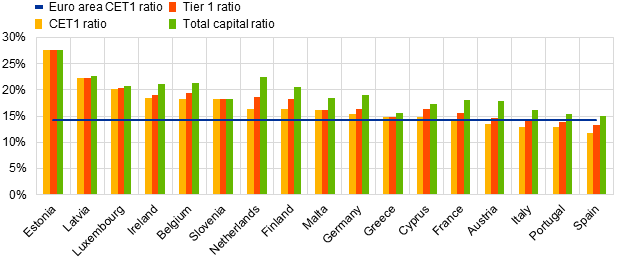
Capital ratios for significant institutions remained stable in the first quarter of 2019. The Common Equity Tier 1 (CET1) ratio stood at 14.34%, the Tier 1 ratio at 15.59% and the total capital ratio at 17.99%. Average CET1 capital ratios at participating Member State level range from 11.77% in Spain to 27.69% in Estonia.
Chart 1
Total capital ratio and its components by reference period
(EUR billions, percentages)
Source: ECB.
Chart 2
Capital ratios by country Q1 2019
(Percentages)
Source: ECB.
Note: Data for some countries are not displayed either for confidentiality reasons or because there are no significant institutions at the highest level of consolidation.
Asset quality
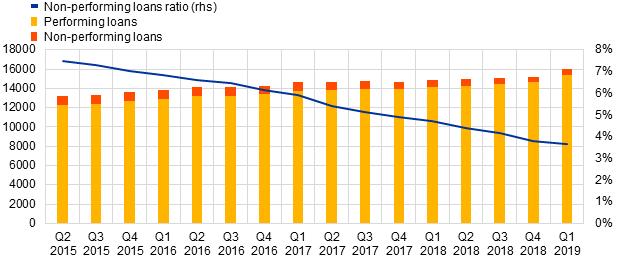
The non-performing loans ratio (NPL ratio) decreased further to 3.67% in the first quarter of 2019, which was the lowest level since supervisory banking statistics were first published in the second quarter of 2015.
Chart 3
Non-performing loans by reference period
(EUR billions, percentages)
Source: ECB.
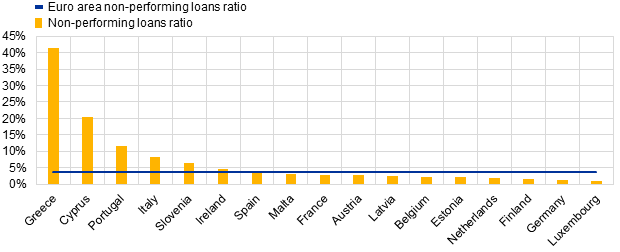
Chart 4
Non-performing loans ratio by country Q1 2019
(Percentages)
Source: ECB.
Note: Data for some countries are not displayed either for confidentiality reasons or because there are no significant institutions at the highest level of consolidation.
Liquidity
The liquidity coverage ratio increased to 149.71% in the first quarter of 2019, from 145.78% in the previous quarter. The average values range from 74.07% in Greece[1] to 387.21% in Slovenia.
Chart 5
Liquidity coverage ratio by reference period
(EUR billions, percentages)
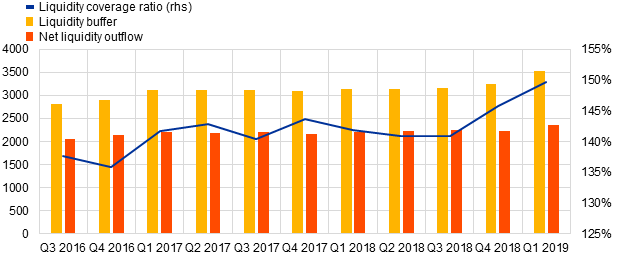
Source: ECB.
Chart 6
Liquidity coverage ratio by country Q1 2019
(Percentages)
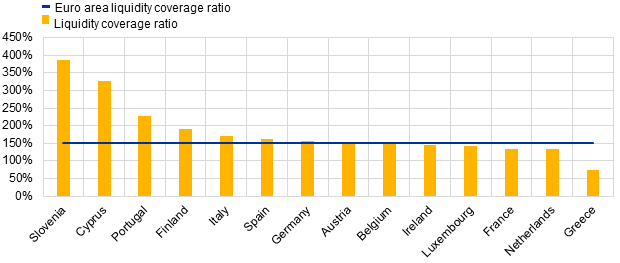
Source: ECB.
Note: Data for some countries are not displayed either for confidentiality reasons or because there are no significant institutions at the highest level of consolidation.
Factors affecting changes
Supervisory banking statistics are calculated by aggregating data reported by banks that report COREP (capital adequacy information) and FINREP (financial information) at that point in time. Changes in the amounts shown from one quarter to another can be influenced by the following factors:
- changes in the sample of reporting institutions;
- mergers and acquisitions;
- reclassifications (e.g. portfolio shifts where certain assets are reclassified from a particular accounting portfolio to another).
For media queries, please contact Esther Tejedor tel.: +49 69 1344 95596.
Notes
- The complete set of Supervisory banking statistics with additional quantitative risk indicators is available on the ECB’s banking supervision website.
- The figures for Greek banks are affected by external factors that temporarily hinder the use of the liquidity coverage ratio as an appropriate liquidity risk indicator.