1 Introduction
The geopolitical shock caused by Russia’s invasion of Ukraine together with the immediate macro-financial consequences has increased uncertainty and risks to the European economy and financial system. The rebound in economic activity observed in the first half of 2022, resulting among other things from the progressive lifting of pandemic-related restrictions, has slowed down over the course of the year. The outbreak of the war led to a series of economic sanctions from the West followed by retaliatory measures from Russia, which resulted in surging prices for energy, food and other commodities, as well as disrupted energy supplies. Inflationary pressures increased as a result, leading major central banks, including the European Central Bank (ECB), to accelerate the pace of monetary policy normalisation.
The profitability of banks supervised by the ECB has so far benefited from rising interest rates. At the same time, the combination of lower growth, higher prices and tighter financing conditions will likely challenge the debt servicing capacity of more indebted borrowers, potentially resulting in asset quality deterioration and subsequent credit losses, together with a higher cost of risk. Moreover, the normalisation of monetary policy is leading to higher funding costs, requiring banks to further diversify their sources of funds. On top of this, persistently high uncertainty may translate into market turbulence and episodes of high volatility, which may lead to a further repricing in financial markets and subsequent mark-to-market losses on banks’ balance sheets or lower earnings from market-related activities. Recent episodes of heightened counterparty credit risk in energy derivatives portfolios and towards non-bank financial institutions, such as liability-driven investment funds in the United Kingdom, suggest a need for reinforced risk management practices.
Alongside the immediate risks stemming from the macro-financial environment, banks are facing several medium-term challenges and opportunities, such as advancing digitalisation across the financial system and the transition to the green economy, that require closer scrutiny from supervisors. Moreover, the current geopolitical situation and banks’ increasing reliance on IT systems have caused operational and IT/cyber-related risks to surge and increased the need for banks to tackle structural deficiencies in their outsourcing arrangements and their IT security and cyber resilience frameworks.
The 2022 Supervisory Review and Evaluation Process (SREP) was carried out against the backdrop of the current economic conditions and dynamics in financial markets. This report summarises the outcome of the 2022 SREP cycle. It covers the assignment of SREP scores to banks’ overall risk profiles and their main elements (Chapter 2), the determination of Pillar 2 capital requirements (P2Rs) and guidance (P2G) (Chapter 3) and qualitative measures (Chapter 4). Chapter 5 contains a detailed analysis of selected elements identified as supervisory priorities for 2022-24, as used by the supervisors in their assessments.
SREP scores remained broadly the same overall. A marginal improvement was observed thanks to better key risk indicators, such as non-performing loans (NPLs) while, in the light of the prevailing uncertainty, the overall assessment was conservative. The overall capital requirements and guidance increased to 15% of risk-weighted assets (RWA) on average after 14.7% of RWA in the 2021 SREP cycle. Banks identified as significant institutions maintain solid capital and liquidity positions, with the vast majority going beyond the levels dictated by capital requirements and guidance.
Qualitative measures were issued primarily in the areas of credit risk and internal governance, where supervisors looked at the broader quality of banks’ internal risk control frameworks and the effectiveness of banks’ management bodies.
ECB Banking Supervision took concrete steps to tackle worrying developments in leveraged finance, as the aggregate exposures of significant institutions to leveraged transactions continued to increase and underwriting standards deteriorated further, indicating that banks had responded inadequately to dedicated supervisory guidance issued in 2017. On 30 March 2022 the ECB published a letter to the institutions setting out detailed expectations regarding the setup of their internal risk appetite frameworks for leveraged transactions. The letter aimed to ensure that significant institutions have in place a comprehensive, well-designed risk appetite framework to help them capture and effectively manage all key risks, building on the principles published in 2017. A specific capital add-on was included in the P2R decision for a few institutions with very high exposure to the risks from leveraged transactions or highly deficient risk controls in this line of business.
Also in 2022 the ECB had to tackle several instances of coverage for non-performing exposures not meeting supervisory expectations by imposing a dedicated add-on in the P2R decision.
2 Evolution of scores
2.1 Key messages
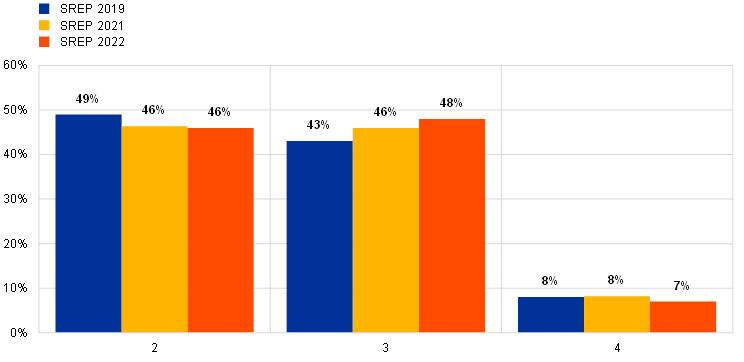
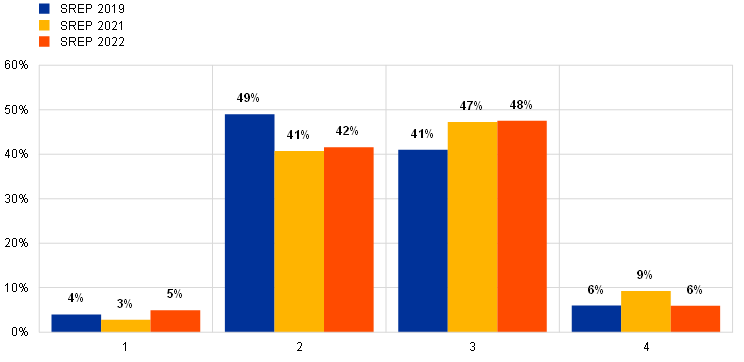
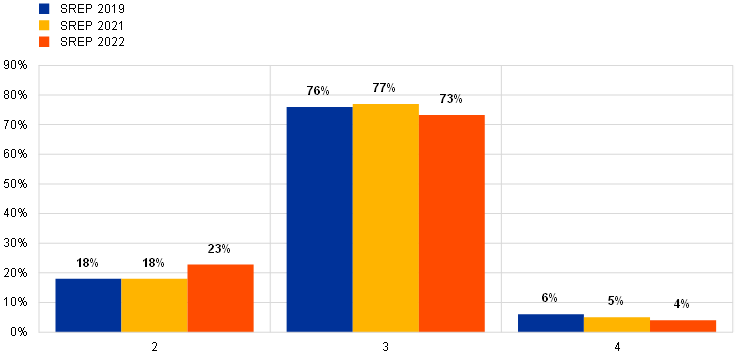
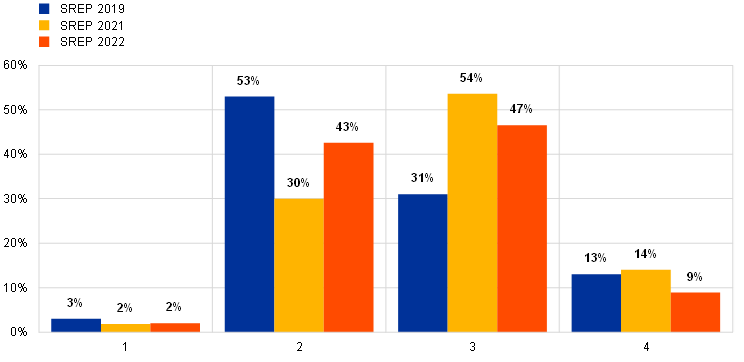
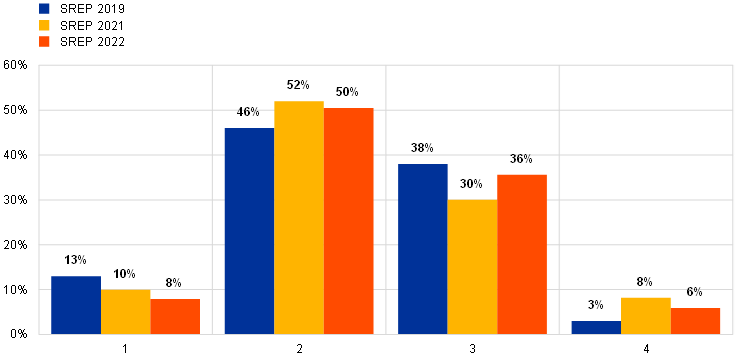
The average overall SREP scores for 2022 were broadly the same as in previous cycles (Chart 1), with only a minor increase in the share of banks with a score of 3 and a parallel decrease in the share of banks with a score of 4. Supervisors have remained cautious in their assessments amid the exogenous shocks stemming from the lingering effects of the coronavirus (COVID-19) pandemic and the war in Ukraine. In 2022 92% of institutions received the same overall SREP score as in 2021 while 4% saw their scores worsen (Chart 2).
Chart 1
Overall SREP scores
(percentages)
Source: ECB (SREP database).
Note: 2019 SREP values based on 109 decisions; 2021 SREP values based on 108 decisions; 2022 SREP values based on 101 decisions. ECB Banking Supervision adopted a pragmatic approach to its SREP assessment in 2020 in response to the extraordinary circumstances at the onset of the pandemic. The pragmatic assessment focused on banks’ handling of the challenges stemming from the pandemic and kept P2Rs and P2G unchanged at 2019 levels. ECB Banking Supervision went back to a full SREP cycle in 2021.
There are no banks with an overall SREP score of 1. Rounding differences might apply throughout the document.
Chart 2
Changes to banks’ overall SREP scores in 2022 relative to 2021
(percentages)

Source: ECB (SREP Database).
Note: This chart is based on a subsample of banks that were assessed in both the 2021 and 2022 SREP cycles, meaning that it differs slightly from Chart 1 in that regard.
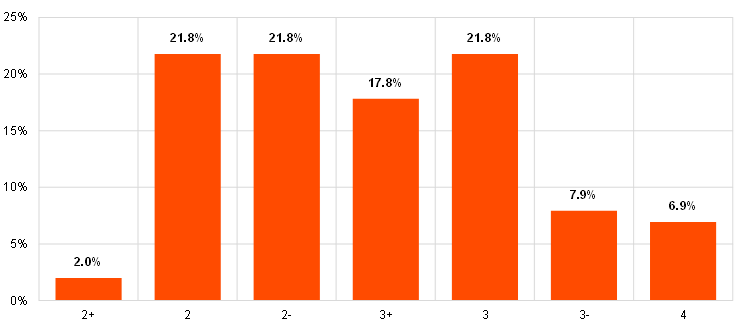
In order to introduce more granular and accurate scoring of the SREP assessment, score qualifiers are used with the scores 2 and 3 (2+, 2, 2-, 3+, 3, 3-). Chart 3 shows the distribution of overall SREP scores in 2022 including the qualifiers.
Chart 3
Distribution of overall SREP scores with qualifiers
(percentages)
Source: ECB (SREP Database).
Note: There are no banks with an overall SREP score of 1.
2.2 Breakdown by business model
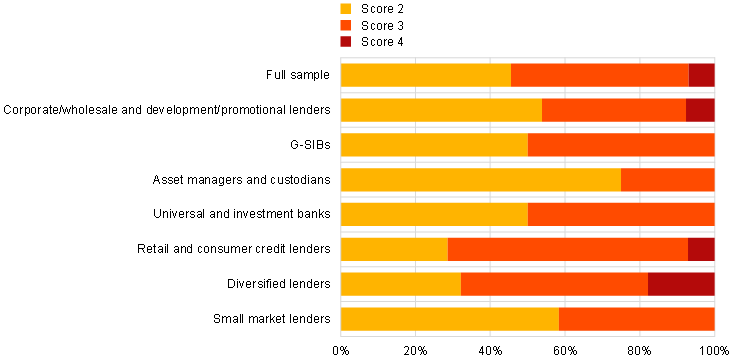
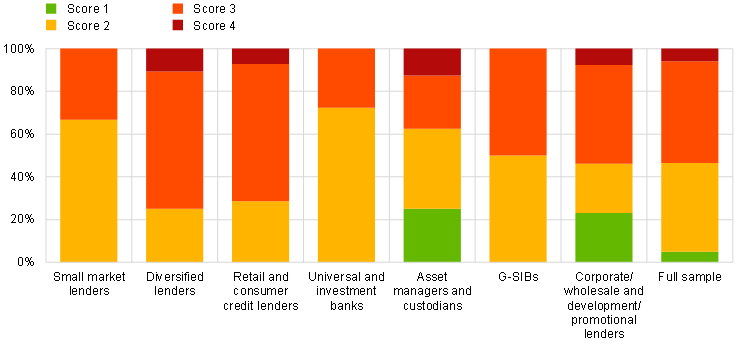
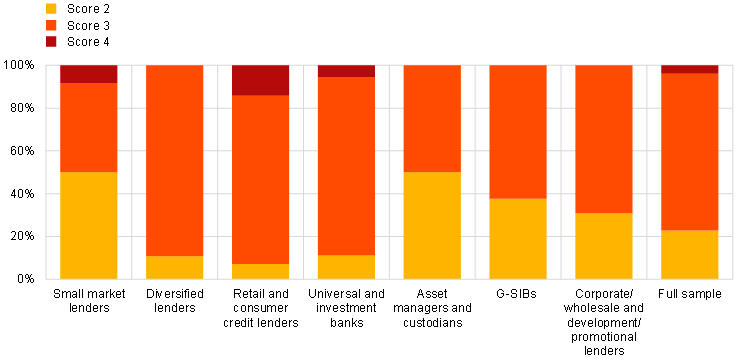
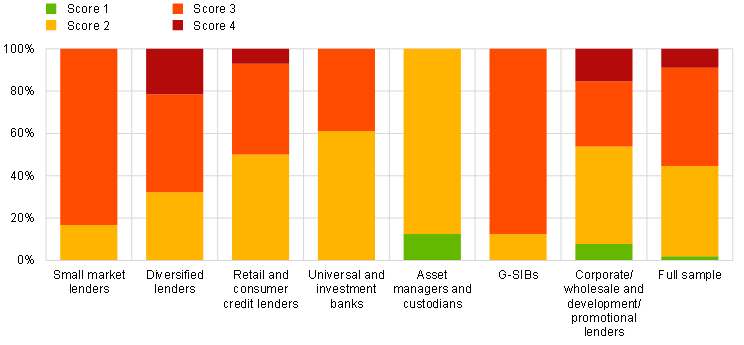
Chart 4 shows the distribution of overall SREP scores in 2022 for different business models:
- the overall SREP scores are concentrated around scores of 2 and 3;
- a majority of asset managers and custodians, small market lenders, and corporate/wholesale and development/promotional lenders have a score of 2;
- more than half of retail and consumer credit lenders and diversified lenders have scores of 3 or 4;
- diversified lenders have the highest proportion of scores of 4.
Chart 4
Breakdown of overall SREP scores by business model
(percentages)
Source: ECB (SREP Database).
Note: 2022 SREP values based on 101 decisions. Corporate/wholesale lenders and development/promotional lenders have been grouped together in this chart to preserve statistical confidentiality.
3 Capital requirements and guidance
3.1 Key messages
The weighted average of overall capital requirements and guidance has remained largely stable over the last few years, with a slight increase in the requirements applicable in 2023. The aggregate capital requirements in 2023 are estimated at 15% of risk-weighted assets (RWA), after 14.7% in 2022 resulting from the 2021 SREP assessment.
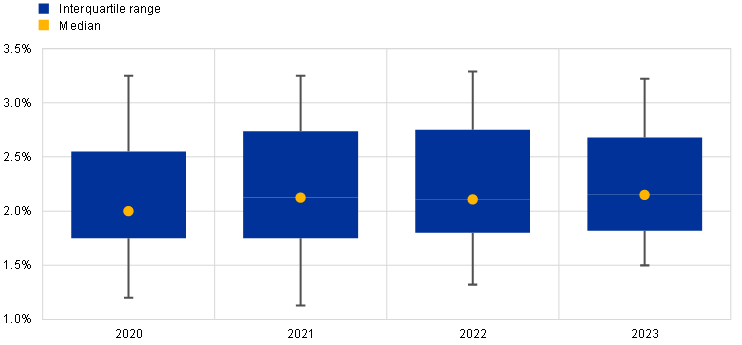
Pillar 2 requirements (P2Rs) for total capital remain in line with the requirements set out in previous years, at around 2% of RWA (as against 1.9% in 2022), incorporating NPE P2R add-ons (Section 3.2), and a new P2R add-on for leveraged finance introduced during the 2022 SREP cycle.[1] The distribution of P2R for total capital in 2023 shows a smaller range than in 2022.
Chart 5
Distribution of total capital P2Rs
(percentages)
Source: ECB Supervisory Banking Statistics and SREP Database.
Notes: Sample selection follows the Supervisory Banking Statistics (SBS) methodological note for 2020 (SBS sample based on 112 entities), 2021 (SBS sample based on 114 entities) and 2022 (SBS sample based on 112 entities). For 2023, the sample is based on 107 entities with applicable P2R in February 2023. The chart shows P2Rs according to year of applicability (i.e. 2023 includes P2Rs decided in the 2022 SREP cycle and applicable in 2023).
The CET1 P2Rs have also remained broadly the same as last year, at around 1.1%. The CET1 P2R interquartile range is the smallest observed in recent years.
Chart 6
Distribution of CET1 P2Rs
(percentages)
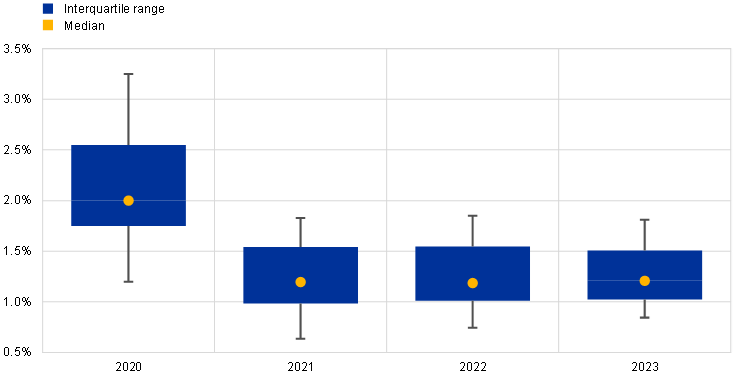
Source: ECB Supervisory Banking Statistics and SREP Database.
Notes: Sample selection follows the Supervisory Banking Statistics (SBS) methodological note for 2020 (SBS sample based on 112 entities), 2021 (SBS sample based on 114 entities) and 2022 (SBS sample based on 112 entities). For 2023, the sample is based on 107 entities with applicable P2R in February 2023. The chart shows P2Rs according to year of applicability (i.e. 2023 includes P2Rs decided in the 2022 SREP cycle and applicable in 2023).
Chart 7 shows the evolution of overall capital requirements and guidance over recent years. During 2022 several national competent authorities announced increases in the countercyclical capital buffers (CCyBs) and systemic risk buffers (SRBs) applicable as of beginning of 2023, taking the average combined buffer requirement to 3.8% in the first quarter of 2023 from 3.6% in the first quarter of 2022. The change is mainly driven by an increase in the aggregate CCyB from 0.03% to 0.22%. Further increases already announced for 2023 will lead to a higher average CCyB by the end of the year.
Given that no SSM-wide capital stress test was performed in 2022, Pillar 2 guidance (P2G) remains largely unchanged compared with 2021, at 1.3%.
Chart 7
Evolution of overall capital requirements and P2G
(percentages)
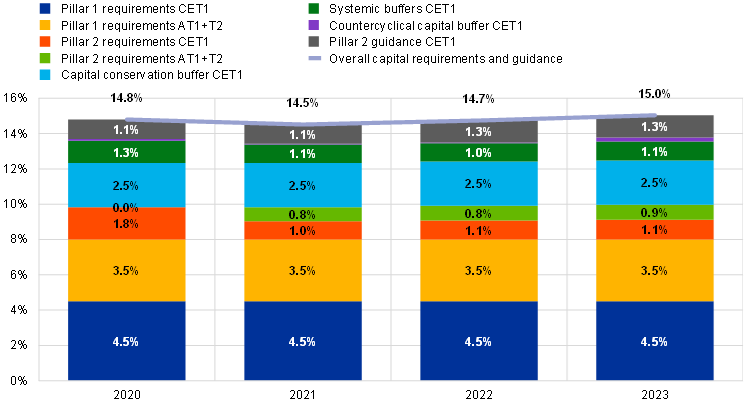
Source: ECB Supervisory Banking Statistics and SREP Database.
Notes: Sample selection follows the Supervisory Banking Statistics (SBS) methodological note for 2020 (SBS sample based on 112 entities), 2021 (SBS sample based on 114 entities) and 2022 (SBS sample based on 112 entities). For 2023, the sample is based on 107 entities with applicable P2R in February 2023. The chart shows RWA-weighted data as at Q3 2022. “Overall capital requirements” means Pillar 1 + P2R + combined buffer requirement [capital conservation buffer + systemic buffers (G-SII, O-SII, SyRB) + CCyB]. The reference date for the combined buffer requirement is Q1 in each year. P2G is added on top of overall capital requirements. Under CRD V, P2R capital should have the same composition as Pillar 1, i.e. at least 56.25% should be CET1 and at least 75% Tier 1.
Chart 8 shows the overall capital requirements and P2G to be met with CET1 capital. The average increased slightly, estimated at 10.7% in 2023 resulting from the 2022 SREP cycle compared to 10.4% resulting from the 2021 SREP cycle.[2]
Chart 8
Evolution of overall capital requirements and P2G in CET1
(percentages)
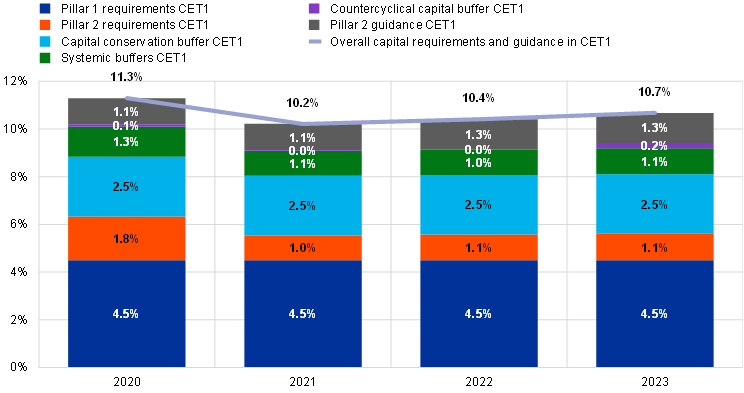
Source: ECB Supervisory Banking Statistics and SREP Database.
Notes: Sample selection follows the Supervisory Banking Statistics (SBS) methodological note for 2020 (SBS sample based on 112 entities), 2021 (SBS sample based on 114 entities) and 2022 (SBS sample based on 112 entities For 2023, the sample is based on 107 entities with applicable P2R in February 2023. The chart shows RWA-weighted data as at Q3 2022. “Overall capital requirements” means Pillar 1 + P2R + combined buffer requirement [capital conservation buffer + systemic buffers (G-SII, O-SII, SyRB) + CCyB]. The reference date for the combined buffer requirement is Q1 in each year. P2G is added on top of overall capital requirements. Under CRD V, P2R capital should have the same composition as Pillar 1, i.e. at least 56.25% should be CET1 and at least 75% Tier 1.
Chart 9 shows the breakdown of average capital requirements and guidance for each business model as of the first quarter of 2023. Overall capital requirements and guidance are set at the highest level for small market lenders, corporate/wholesale lenders, universal and investment banks, and G-SIBs. In terms of P2R, it is set at a higher level for small market lenders (2.3%) and retail and consumer credit lenders (2.3%) and is lowest for development/promotional lenders (1.8%) and G-SIBs (1.8%).
Chart 9
Overall capital requirements and guidance by business model
(percentages)
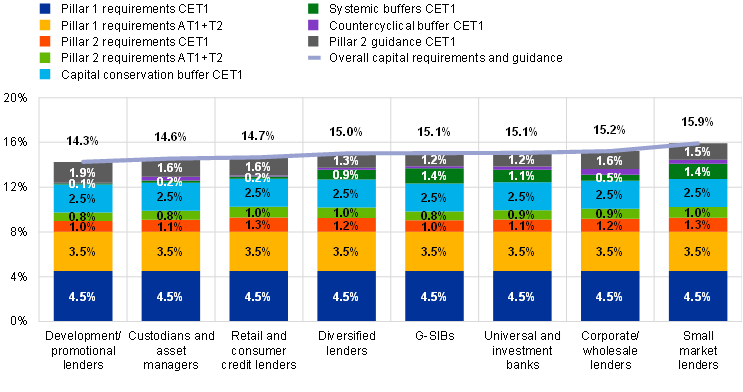
Source: ECB Supervisory Banking Statistics and SREP Database.
Notes: The sample is based on 107 entities with applicable P2R in February 2023. The chart shows RWA-weighted data as at Q3 2022. Systemic buffers (G-SII, O-SII and SyRB) and CCyBs are the levels anticipated for Q1 2023. “Overall capital requirements” means Pillar 1 + P2R + capital conservation buffer + systemic buffers (G-SII, O-SII, SyRB) + CCyB. P2G is added on top of overall capital requirements. Under CRD V, P2R capital should have the same composition as Pillar 1, i.e. at least 56.25% should be CET1 and at least 75% Tier 1.
3.2 NPE Pillar 2 requirement add-on
The 2022 SREP cycle resulted in NPE P2R add-ons for 24 significant institutions where a shortfall was identified relative to the ECB’s coverage expectations, as the cover for risks arising from aged non-performing exposures (NPEs) was assessed to be inadequate.
Chart 10
NPE shortfall add-ons
(total, basis points)
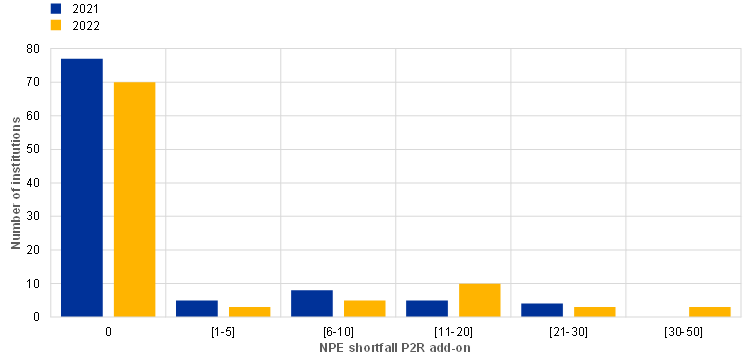
Source: ECB internal calculation.
The relevant institutions have been encouraged to close these provisioning gaps by posting the maximum level of provisions permitted under the relevant accounting standards. If the accounting treatment does not match the prudential provisioning expectations, institutions also have the option of adjusting their CET1 capital at their own initiative.
The Joint Supervisory Teams discussed the implications of those expectations with institutions as part of the annual supervisory dialogues. Their outcomes were taken into account in the SREP, as most institutions took action to further reduce the shortfall in the course of 2022. These actions helped push the aggregate shortfall in NPE provisions down from 12 basis points to 7 basis points over the year, compared with a final aggregate shortfall of 4 basis points in the 2021 SREP cycle.
While the SREP decisions are generally adopted once a year, the institutions can ask for their P2R add-ons linked to NPE coverage shortfalls to be updated at three quarterly time windows. They can do so if they reduce their NPE coverage shortfall during the year by means of further NPE disposals, increases in provisions or voluntary deductions from their CET1 capital. Accordingly, individual NPE P2R add-ons may be lowered in the course of 2023 in the event that further provisioning gaps are closed. In 2022 the add-ons imposed on three institutions in 2021 were reduced as a result of higher provisions and deductions from CET1.
A few banks opted to release amounts of NPE coverage, which led to their P2R add-ons being reinstated. The ECB continues to closely monitor these dynamics.
4 Qualitative measures
4.1 Key messages
Qualitative measures were issued to the vast majority of significant institutions in the 2022 SREP cycle to address supervisory findings (96 banks, or 95% of the 2022 SREP sample). Compared with 2021, there was an increase of 14% in the total number of measures issued.
Most new SREP measures address deficiencies with regard to internal governance (28%), credit risk (18%) and capital adequacy (14%).
- Even though their number is falling, measures to mitigate internal governance and risk management-related deficiencies have been imposed on 76% of significant institutions, which represents the highest percentage across all types of measures (Chart 11). Overall, the deficiencies identified in the assessment of governance and risk management mainly relate to the management body, risk management framework, internal audit function, compliance function, risk data aggregation and reporting. This reflects the focus areas for supervisory scrutiny in line with the SSM supervisory priorities for 2022-24.
- There was also a decrease in the volume of credit risk measures in 2022, while measures relating to capital adequacy and the ICAAP remained largely stable compared with the previous year.
Chart 11
Qualitative measures
(percentages)
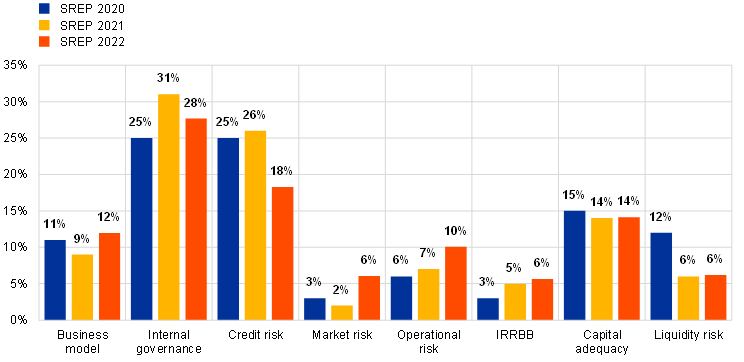
Source: ECB (SREP Database).
Note: 2020 SREP values based on 112 decisions; 2021 SREP values based on 108 decisions; 2022 SREP values based on 101 decisions. This chart does not include weaknesses addressed by supervisory actions outside of the SREP cycles.
4.2 Distribution of qualitative measures in the 2022 SREP cycle
Chart 12 shows a breakdown by business model of measures issued in the 2022 SREP cycle. Diversified lenders have the highest concentration of SREP measures, averaging more than ten per bank. Small market lenders, corporate and wholesale lenders, and development and promotional lenders have the lowest concentration, averaging fewer than five measures per bank.
Chart 12
Breakdown of qualitative measures by business model
(percentages)
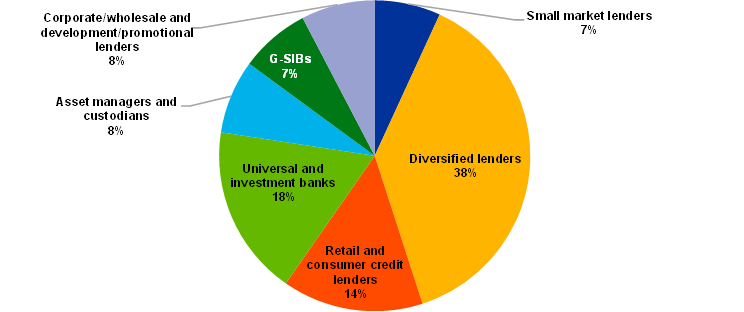
Source: ECB (SREP Database).
Notes: 2022 SREP values based on 101 decisions. This chart does not include weaknesses addressed by supervisory actions outside of 2022 SREP cycle. Corporate/wholesale lenders and development/promotional lenders have been grouped together in this chart to preserve statistical confidentiality.
The banks with an overall SREP score of 4 were issued an average of 11 qualitative measures, while the average number for score 3 banks was ten (Chart 13). Among banks with a score of 4, credit risk measures were the most common type. For further information on qualitative measures, please refer to Chapter 5.
Chart 13
Average number of qualitative measures by overall SREP score
(totals)
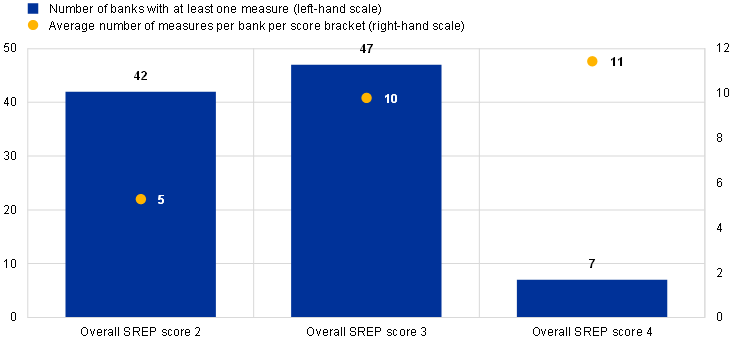
Source: ECB (SREP Database).
Notes: 2022 SREP values based on 101 decisions. There are no banks with an overall SREP score of 1. This chart does not include weaknesses addressed by supervisory actions outside of the 2022 SREP cycle.
5 Detailed analysis
5.1 Element 1: Business model
5.1.1 Key messages
The business model scores have remained broadly the same in the 2022 SREP cycle (Chart 14), with supervisors focusing on the forward-looking view given the complex context. 5% of banks have seen their scores improve, associated with enhancements in strategic steering and a rebound in sustainable sources of revenue.
In 2021 banks saw their profitability surge on the back of lower impairments and rising net fee and commission income and net trading income. At the same time, net interest income remained broadly unchanged amid rising lending volumes and a bottoming-out of margins. The growth in net fee and commission income was largely driven by asset management activities, while net trading income was underpinned by those institutions with larger investment banking businesses (see the box entitled “Sustainability of recent euro area investment banking strength and debt capital market integration”, Financial Stability Review, ECB, November 2021). Against the backdrop of the deteriorating economic situation triggered by Russia’s war in Ukraine and inflationary pressures, bank profitability proved robust in 2022. Aggregate return on equity (ROE) reached 7.6% in the third quarter of 2022, benefiting from growth in net interest income generated by the steepening of the yield curve. Investment banking revenues have come under pressure, while credit impairments have increased, albeit remaining contained. Supervisors are keeping a vigilant watch on bank profitability against the backdrop of the worsening macroeconomic outlook and deteriorating capital market conditions.
Supervisory concerns regarding bank business models are primarily associated with long-standing issues tackling structural inefficiencies and improving strategic steering capabilities.
Chart 14
Element 1: Business model SREP scores
(percentages)
Source: ECB (SREP Database).
Notes: 2019 SREP values based on 109 decisions; 2021 SREP values based on 108 decisions; 2022 SREP values based on 101 decisions. ECB Banking Supervision adopted a pragmatic approach to its SREP assessment in 2020 in response to the extraordinary circumstances at the onset of the pandemic. The pragmatic assessment focused on banks’ handling of the challenges stemming from the pandemic and kept P2Rs and P2G unchanged at 2019 levels. ECB Banking Supervision went back to a full SREP cycle in 2021.
5.1.2 Breakdown by business model
Chart 15 shows the distribution of business model SREP scores across significant institutions with different types of business model.
Chart 15
Breakdown of business model SREP scores by business model
(percentages)
Source: ECB (SREP Database).
Note: 2022 SREP values based on 101 decisions. Corporate/wholesale lenders and development/promotional lenders have been grouped together in this chart to preserve statistical confidentiality.
Progress in addressing structural concerns about business models has been limited (Section 5.1.3). The key specific developments in the individual groups in 2022 were:
- G-SIBs have enjoyed a rebound in revenues, an improvement in cost efficiency attributable to rising operating income and a fall in the cost of risk;
- universal and investment banks can also point to a post-pandemic recovery, with improvements in the cost of risk, revenue generation and cost efficiency;
- the profitability of diversified lenders has continued to be constrained by structural weaknesses and a high cost of risk amid significant disposals of NPLs and capital increases;
- corporate/wholesale lenders have remained weak in terms of income generation, while showing progress with regard to restructuring and business transformation;
- the profitability of promotional/development lenders has increased, coupled with good cost efficiency and a low cost of risk;
- retail and small consumer lenders have shown some improvement in profitability, albeit constrained by cost inefficiencies;
- small market lenders have seen their profitability decline, attributable to one-off events, while showing improvements in the cost of risk and cost efficiency;
- asset managers and custodians have enjoyed some improvement in profitability, while there is still a need for further cost containment.
5.1.3 Focus on profitability and structural factors in 2022
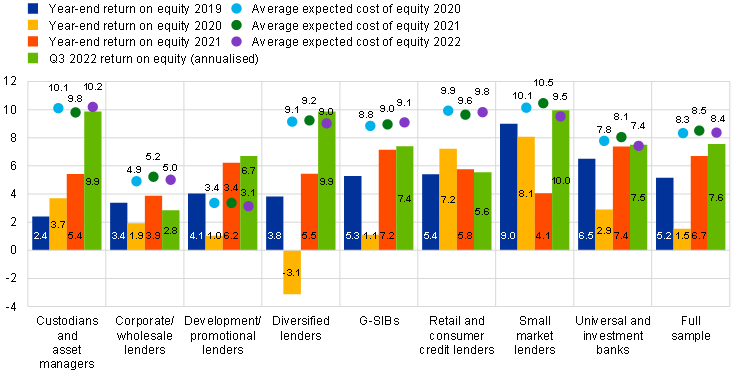
ROE grew significantly in 2021, driven by the post-pandemic economic recovery, to reach an aggregate of 6.7%. ROE has continued to grow in 2022, despite the macroeconomic and geopolitical pressures, and reached 7.6% for the first three quarters of the year (Chart 16). The improvement has largely been driven by increased net interest income supported by both volume and margin effects. The growth in net fee and commission income came to a halt in 2022 as asset prices fell, impacting income from asset management. Furthermore, fees from securities issuance also declined, but remain at a high level after strong growth over the last few years.
Operating expenses rose slower than inflation as banks continued down their path of digitalisation and parallel branch closures. Impairments remained subdued in the first half of the year, but banks with significant exposure to Russia increased loan loss provisions. With impairments picking up in the third quarter of 2022, financial results of significant institutions started to more broadly reflect the deteriorating growth figures, high inflation and gas price increases triggered by reduced gas supplies, all of which have had an impact on household disposable income and corporate profits.
Overall, business models have proven relatively robust to the rapid changes in business conditions but, in the light of future challenges related to the bleak macroeconomic outlook, banks cannot afford to become complacent and need to focus on strategic steering in uncertain times, keep costs under control and remain vigilant on their risk-taking.
Chart 16
Return on equity and cost of equity by business model
(percentages)
Source: ECB Supervisory Banking Statistics and internal calculations.
Note: Weighted average. Sample selection follows the Supervisory Banking Statistics methodological note. Cost of equity as self-reported by SIs. Due to data availability constraints, the sample for cost of equity comprises a lower number of entities than the sample for return on equity. Average expected cost of equity 2022 based on 93 entities.
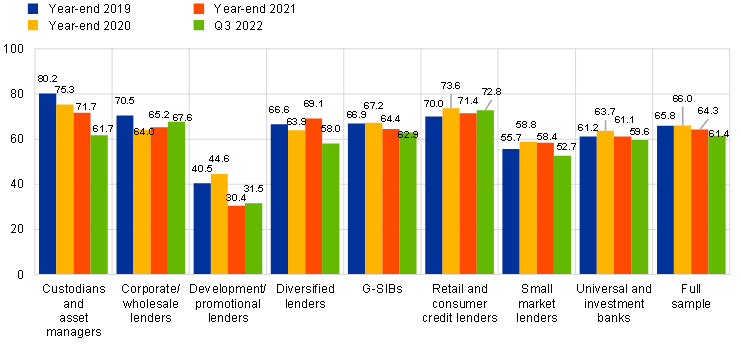
Structural factors still remain the key supervisory concern, as they weigh on the sustainability of the profits generated by significant institutions. Although banks have stepped up their efforts to cut costs, their cost/income ratios remain structurally high and sticky (61.4% on aggregate for the first three quarters of 2022). Asset managers and custodians, and development and promotional lenders showed significant cost improvements during 2021 (Chart 17). In 2022 inflationary pressures amplified by energy price shocks have weighed on banks’ operating expenses and cost of risk. In the first three quarters of 2022, only asset managers and custodians, diversified lenders and small market lenders showed considerable improvements in cost/income ratios, mostly driven by the revenue side. Retail and consumer credit lenders and corporate and wholesale lenders had significantly above-average cost/income ratios.
Chart 17
Cost/income ratio by business model
(percentages)
Source: ECB Supervisory Banking Statistics.
Note: Weighted average. Sample selection follows the Supervisory Banking Statistics (SBS) methodological note.
Digitalisation continues to be a priority for ECB Banking Supervision. Banks’ efforts in developing and executing sound digital transformation strategies are acknowledged, while the need for further progress is also emphasised. ECB Banking Supervision has launched several digitalisation-related initiatives across the banking sector with a view to monitoring the healthy adoption of digital transformation that makes business models more robust. The outcome of these initiatives will inform the supervisory assessment in the next SREP cycle.
5.1.4 Supervisory expectations
In the 2022 SREP cycle, supervisors continued to focus on long-standing issues affecting the robustness of business models in order to tackle structural inefficiencies while also addressing issues identified as part of the ECB’s thematic review on climate-related and environmental (C&E) risks. The majority of measures (Chart 18) related to the sustainability of business models over the medium and long-term horizon rather than to short-term viability. To address banks’ preparedness for managing climate-related risk, 23% of the measures on business model risk were issued in this area. The next largest groups of measures related to necessary strategic changes and strategic plan updates (15%), cost review or cost reduction (12%) and strategic governance and implementation (10%).
Chart 18
Detailed breakdown of business model-related measures
(percentages)
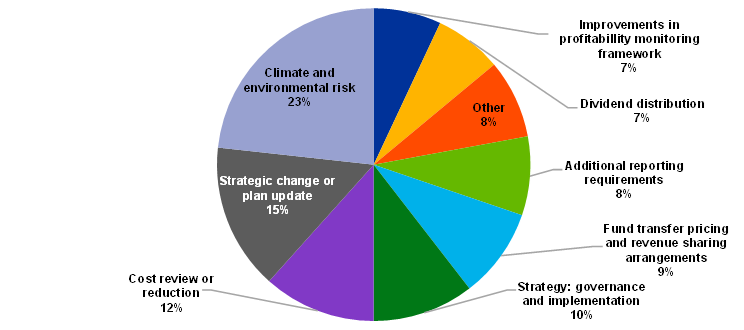
Source: ECB (SREP Database).
Note: 2022 SREP values based on 101 decisions. This chart does not include weaknesses addressed by supervisory actions outside of the 2022 SREP cycle.
5.2 Element 2: Internal governance and risk management
5.2.1 Key messages
Despite the progress made by significant institutions over the last few years, internal governance and risk management remains an area of elevated concern for ECB Banking Supervision. The 2022 SREP findings on internal governance and risk management can be grouped together in the following areas:
- concerns regarding the effectiveness of management bodies in terms of their composition (including lack of formally independent board members[3]), collective suitability and oversight role, as manifested by the absence of a strong challenging culture and/or weak decision-making;
- issues related to the risk management framework, mainly regarding the risk appetite and the practices employed to manage C&E risks;
- insufficient attention paid by of the management body to compliance and internal audit functions, hampering their operational functionality, as indicated by the inadequate resources allocated to those functions (in both qualitative and quantitative terms);
- persisting fragmented and non-harmonised IT landscapes, with negative consequences for data aggregation and reporting, compounded by slow progress with the remediation programmes drawn up over recent years. This is continuing to hamper the ability of banks to swiftly produce accurate non-standardised reports.
These issues are reflected in internal governance and risk management scores (Chart 19). No bank had a score of 1 in 2022, whereas 73% of institutions had a score of 3. For 62.5% of the significant institutions, the scores remained unchanged compared with 2021.
Chart 19
Element 2: Internal governance SREP scores
(percentages)
Source: ECB (SREP Database).
Notes: 2019 SREP values based on 109 decisions; 2021 SREP values based on 108 decisions; 2022 SREP values based on 101 decisions. ECB Banking Supervision adopted a pragmatic approach to its SREP assessment in 2020 in response to the extraordinary circumstances at the onset of the pandemic. The pragmatic assessment focused on banks’ handling of the challenges stemming from the pandemic and kept P2Rs and P2G unchanged at 2019 levels. ECB Banking Supervision went back to a full SREP cycle in 2021.
There are no banks with an Internal Governance score of 1.
5.2.2 Breakdown by business model
Chart 20 shows the distribution of internal governance and risk management scores across significant institutions with different business models.
There is a high concentration in scores of 3 across all business models.
There are three business models that have institutions with a score of 4: small market lenders, retail and consumer credit lenders, and universal and investment banks.
Chart 20
Breakdown of internal governance SREP scores by business model
(percentages)
Source: ECB (SREP Database).
Note: 2022 SREP values based on 101 decisions. Corporate/wholesale lenders and development/promotional lenders have been grouped together in this chart to preserve statistical confidentiality.
5.2.3 Focus on management bodies
In the 2022 SREP cycle, ECB Banking Supervision has highlighted the following concerns regarding significant institutions’ management bodies:
- suboptimal compositions of the management body (including in terms of IT experience among board members and lack of formally independent board members) and allocation of responsibilities, compromising the management body’s oversight and challenging capacity, especially in its supervisory function;
- inadequate succession planning and its practical implementation.
In early 2022 ECB Banking Supervision targeted those institutions which did not have in place diversity policies or internal targets for gender diversity at board level. Since then, progress has been made in this respect, with the institutions developing and approving specific policies and targets. However, most significant institutions still have weaknesses regarding diversity at board level, mainly in terms of aspects other than gender, such as age and geographical provenance. In addition, the actual representation of the under-represented gender generally remained below the targets.
5.2.4 Supervisory expectations
In the 2022 SREP cycle, the largest group of qualitative measures relating to internal governance and risk management focuses on the need to improve the management body (32%), followed by measures relating to the risk management framework (17%), internal audit (12%), the compliance function (11%) and risk data aggregation and reporting (9%).
Chart 21
Breakdown of qualitative measures relating to internal governance and risk management
(percentages)
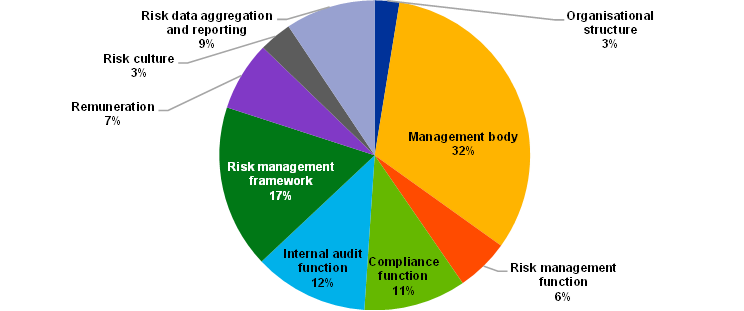
Source: ECB (SREP Database).
Notes: 2022 SREP values based on 101 decisions. This chart does not include weaknesses which may have already been addressed by supervisory actions outside of the 2022 SREP cycle. One qualitative measure could be allocated to several subcategories.
The focus of qualitative measures on management bodies increased further in 2022, in line with the SSM supervisory priorities for 2022-24, with at least one measure in this area being addressed to almost half of the significant institutions.
By contrast, the number of measures addressing risk data aggregation and reporting remained somewhat limited in 2022, despite this being the worst rated subcategory of internal governance. This can be attributed to the large number of measures in this area in 2020 together with past measures still being implemented.
Heightened supervisory scrutiny is envisaged in this area, as reflected in the SSM supervisory priorities for 2023-25.
5.3 Element 3 – Block 1: Credit risk
5.3.1 Key messages
Positive credit quality developments, such as the continuing reduction of non-performing loans (NPLs) mostly by means of sales and write-offs by high-NPL banks, contributed to marginal improvements in average credit risk scores. However, the scores remained the same for more than half of the significant institutions due to the uncertain macroeconomic outlook and signs of latent credit risk: Stage 2 (S2) ratios and forbearance remained above pre-pandemic levels, while S2 coverage dropped below pre-pandemic levels for many banks. Additionally, the remaining pockets of risk such as exposures to leveraged finance, the uncertain macroeconomic and geopolitical outlook, together with persisting deficiencies in credit risk management frameworks and practices, limited further improvements in scores.
Supervisors’ efforts to ensure that credit risk is adequately assessed, classified and measured on banks’ balance sheets were emphasised with the letters sent to CEOs in 2020 (“Dear CEO letters”). In 2022 credit risk scores are still underpinned by persisting risk control deficiencies. Progress in remediation under measures issued in previous cycles informed the 2022 SREP assessments, as also reflected in the SREP qualitative measures outlined in Section 5.3.5 below.
In parallel with the 2022 SREP cycle, ECB Banking Supervision carried out a targeted review of governance and high-level management of counterparty credit risk, with a focus on over-the-counter derivatives with non-banking counterparties, as part of the SSM supervisory priorities for 2022-24. The review highlighted material shortcomings compared with supervisory expectations and good practices observed in the industry. This specifically related to customer due diligence, the definition of risk appetite, stress testing and default management. These outcomes will be factored into the SREP for 2023 and taken into account when planning further supervisory activities.
Chart 22
Element 3: Credit risk SREP scores
(percentages)
Source: ECB (SREP Database).
Notes: 2019 SREP values based on 109 decisions; 2021 SREP values based on 108 decisions; 2022 SREP values based on 101 decisions. ECB Banking Supervision adopted a pragmatic approach to its SREP assessment in 2020 in response to the extraordinary circumstances at the onset of the pandemic. The pragmatic assessment focused on banks’ handling of the challenges stemming from the pandemic and kept P2Rs and P2G unchanged at 2019 levels. ECB Banking Supervision went back to a full SREP cycle in 2021.
5.3.2 Breakdown by business model
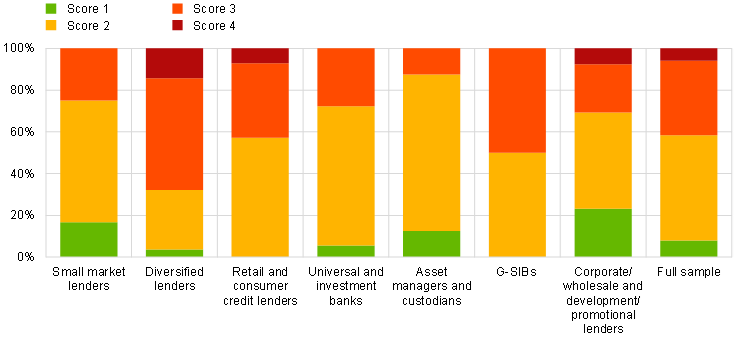
Significant differences remain between business models in terms of credit risk scores (Chart 23):
- G-SIBs, diversified lenders and small market lenders are concentrated in scores of 3;
- there is a cluster of asset managers and custodians, and universal and investment banks in scores of 2;
- diversified lenders have the largest proportion of banks scoring 4.
Chart 23
Breakdown of credit risk SREP scores by business model
(percentages)
Source: ECB (SREP Database).
Note: 2022 SREP values based on 101 decisions. Corporate/wholesale lenders and development/promotional lenders have been grouped together in this chart to preserve statistical confidentiality.
5.3.3 Focus on asset quality and credit risk management frameworks
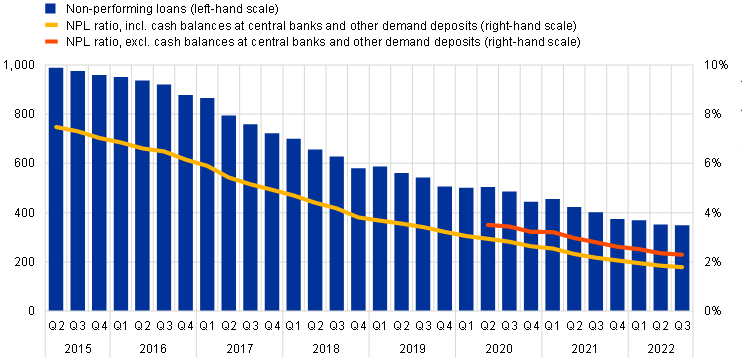
Asset quality continued to improve in 2022. The volume of NPLs held by significant institutions had dropped to €349 billion by the end of September 2022, a reduction of 65% since end of June 2015 (Chart 24).
Chart 24
NPLs held by significant institutions
(EUR billions, percentages)
Source: ECB Supervisory Banking Statistics.
Notes: Weighted average. Sample selection follows the Supervisory Banking Statistics (SBS) methodological note.
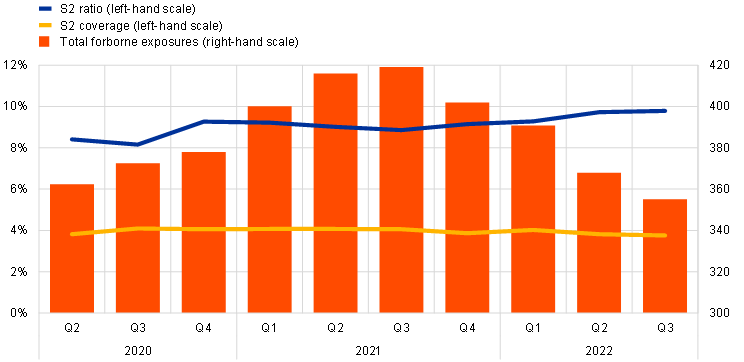
In the third quarter of 2022 S2 loans and advances (loans and advances subject to impairment review) increased to 9.8% of total loans and advances from the pandemic level of 8.4% seen in the second quarter of 2020 (Chart 25). Provisions for S2 loans and advances dropped below the levels observed before the pandemic for many of the banks, but on average stayed broadly flat year on year at 3.8%. Although total forborne exposures have gradually fallen from their pandemic peak of €420 billion in the third quarter of 2021, they nevertheless remained above their pre-pandemic levels (€355 billion in third quarter of 2022 compared with €332 billion at the end of 2019).
Chart 25
S2 ratio, S2 coverage and total forborne exposures
(percentages, EUR billions)
Source: ECB Supervisory Banking Statistics.
Note: Weighted average. Sample selection follows the Supervisory Banking Statistics (SBS) methodological note. S2 ratio and S2 coverage available in SDW as of Q2 2020.
5.3.4 Focus on vulnerable sectors
In line with the objective of strengthening the supervisory focus on significant institutions’ exposures towards vulnerable sectors, the pandemic and also the normalisation of interest rates, two targeted reviews were launched to investigate banks’ practices in managing commercial real estate (CRE) and residential real estate (RRE) exposures.
The targeted review of commercial real estate aimed at assessing how well prepared the banks are to deal with a deterioration in the CRE market. The normalisation of interest rates has had an impact on borrowers’ repayment capacity, increased refinancing risk and negatively affected asset valuations. The impact has been further amplified by the sharp increase in construction costs caused by supply chain bottlenecks. The review showed that banks might not have the ability to deal with emerging risks in a timely manner, relying excessively on manual processes and failing to adequately capture forward-looking information when assessing borrower repayment capacity, especially in the current macroeconomic conjuncture of rising costs and interest rates. The review also found that banks were not adequately assessing the climate-related risk of their loan portfolios, mainly due to a failure to collect real data on the energy performance of underlying collateral. The outcomes of the exercise were communicated to banks in dedicated operational acts or incorporated into existing supervisory engagements, with remedial actions mostly scheduled for assessment envisaged during the course of 2023.
The SSM supervisory priorities for 2022-24 call for banks to pro-actively tackle the build-up of unmitigated risks and address any related deficiencies in their credit risk management frameworks. The combination of lower growth, high inflation and rising interest rates will have an impact on households’ debt servicing capacity. Given that household indebtedness has grown in most countries since 2017, and that rising house prices increase the risk of overvaluation, the risk of a property price correction in the medium term has increased. The ongoing targeted review of residential real estate focuses on the identification of credit risk deficiencies in underwriting practices, as well as on the resilience of banks’ RRE portfolios in the current macroeconomic environment.
5.3.5 Supervisory expectations
Supervisors addressed bank-specific concerns regarding credit risk by issuing a significant number of SREP qualitative measures, with 62 banks receiving such measures (Chart 26). 34% of the qualitative measures pertain to strategic and operational plans covering the level of NPEs, NPE coverage expectations and the related reporting.
Focusing on the SSM supervisory priorities for 2022-24, 44% of the qualitative measures relate to shortcomings in the area of credit risk management frameworks (all credit risk management categories listed below other than NPEs, C&E risks, Internal models/ICAAP and Other), notably including focus areas in the “Dear CEO letter” initiative, and to the implementation of the EBA’s Guidelines on loan origination and monitoring.
Credit risk management concerns stemming from C&E risks account for the second highest share of measures (for more details, please refer to Section 5.5.3). The increased number of measures also reflects greater focus of supervisory actions in this risk area.
Chart 26
Breakdown of credit risk-related qualitative measures
(percentages)
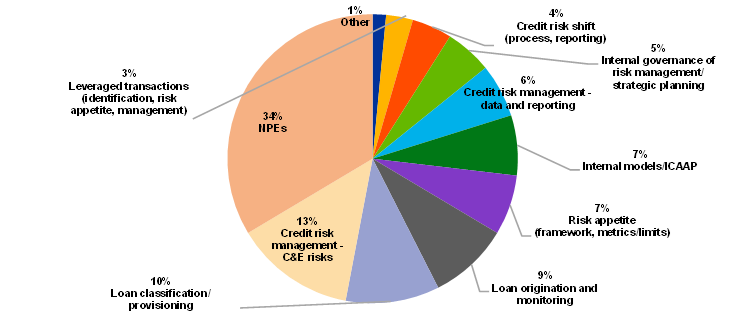
Source: ECB (SREP Database).
Note: 2022 SREP values based on 101 decisions. This chart does not include weaknesses which may have already been addressed by supervisory actions outside of the 2022 SREP cycle.
5.4 Element 3 – Capital adequacy and Element 3 - Block 2: ICAAP
5.4.1 Key messages
Capital adequacy scores have remained broadly the same, with few changes in their distribution relative to 2021. 92% of significant institutions were assigned the same score as in the previous SREP assessment cycle, whereas for 4% the score deteriorated and 4% received an improved score (Chart 27).
Chart 27
Element 3: Capital adequacy SREP scores
(percentages)
Source: ECB (SREP Database).
Notes: 2019 SREP values based on 109 decisions; 2021 SREP values based on 108 decisions; 2022 SREP values based on 101 decisions. ECB Banking Supervision adopted a pragmatic approach to its SREP assessment in 2020 in response to the extraordinary circumstances at the onset of the pandemic. The pragmatic assessment focused on banks’ handling of the challenges stemming from the pandemic and kept P2Rs and P2G unchanged at 2019 levels. ECB Banking Supervision went back to a full SREP cycle in 2021.
In the 2022 SREP cycle, supervisors focused especially on assessing institutions’ capital planning frameworks, processes, capacity and quality, against the background of political and macroeconomic uncertainties. These factors have an impact on the reliability and timeliness of updates to banks’ capital projections and underline the importance of significant institutions having prudent, forward-looking capital plans at their disposal.
Chart 28
Capital headroom to overall capital requirements and P2G as at Q3 2022
(percentages)
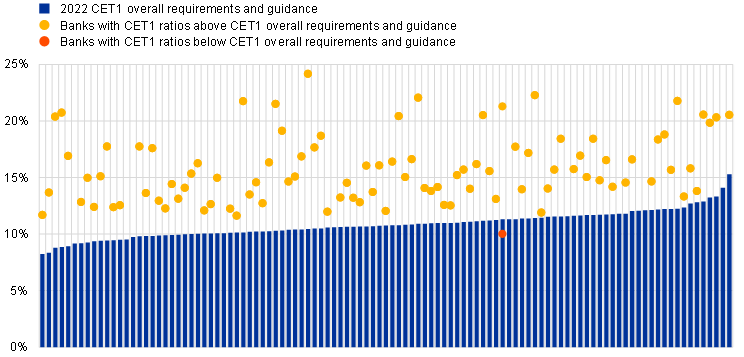
Sources: ECB Supervisory Banking Statistics and SREP Database.
Notes: Pillar 2 CET1 requirements as per published list of P2Rs applicable as at Q1 2023 and Pillar 2 CET1 guidance as per EBA Stress Test 2021. CET1 ratios are as at Q3 2022. Systemic buffers (G-SII, O-SII and SyRB) and CCyBs are the levels anticipated for Q1 2023 and included in the 2022 CET1 requirements and guidance. Each blue line represents a significant institution’s overall capital requirements and guidance in CET1.
5.4.2 Breakdown by business model
Regarding the distribution of capital adequacy scores broken down by business model, there is a strong concentration of scores of 2 and 3 among G-SIBs and universal and investment banks, followed by retail and consumer credit lenders.
Chart 29
Breakdown of capital adequacy SREP scores by business model
(percentages)
Source: ECB (SREP Database).
Note: 2022 SREP values based on 101 decisions. Corporate/wholesale lenders and development/promotional lenders have been grouped together in this chart to preserve statistical confidentiality.
As part of the ECB’s package of pandemic-related relief measures,[4] institutions were given the flexibility to dip into their capital conservation buffer, or their P2G, until the end of 2022. Based on data from the second quarter of 2022, only one institution had capital levels below the required sum of capital requirements, buffers and guidance (compared with six in the third quarter of 2021).
5.4.3 Supervisory expectations
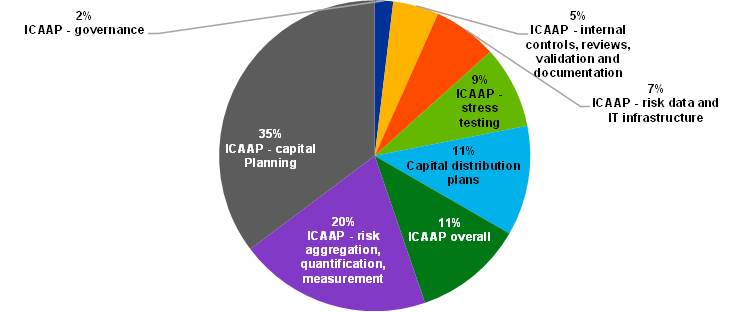
In a number of cases, ECB Banking Supervision expressed ongoing concerns about the reliability of banks’ capital planning frameworks and their ability to produce reliable capital projections under baseline and adverse scenarios as part of their overall ICAAP assessments. Consequently, 35% of ICAAP-related recommendations issued in the 2022 SREP cycle require institutions to improve the relevant frameworks, processes, capacities and quality. Moreover, 20% of the ICAAP-related recommendations focus on risk aggregation and the quantification and measurement process. As outlined in the ECB Guide to the internal capital adequacy process (ICAAP), institutions are expected to continuously improve their ICAAP and practices, as these constitute key success factors in their effective risk management.
Chart 30
Breakdown of ICAAP-related qualitative recommendations
(percentages)
Source: ECB (SREP Database).
Note: 2022 SREP values based on 101 decisions. This chart does not include weaknesses which may have already been addressed by supervisory actions outside of the 2022 SREP cycle.
5.5 Other risks
5.5.1 Market risk and interest rate risk in the banking book
The tightening of financing conditions and the normalisation of the ECB’s monetary policy have put pressure on positions exposed to credit spread risk and interest rate risk. Consequently, these areas were a priority for ECB Banking Supervision in 2022. In parallel with the SREP process, the ECB carried out a targeted review of interest rate risk and credit spread risk in order to assess banks’ exposures and risk appetite as well as the robustness of their risk management systems.
In terms of credit spread risk, supervisors noted that market fluctuations only have a limited sensitivity on banks’ capital and cautioned that this effect could be put to the test in stressed market conditions. There are risks remaining to a sudden repricing of credit spreads, due to changes in market participants’ expectations for the sustainability of debt issuers. Despite the limited sensitivity on capital, supervisors are encouraging banks to remain vigilant and properly measure and manage credit spread risk exposures. More precisely, focusing on the significant stock of positions in the banking book with credit spread risk exposure, supervisors noted that banks should carefully consider the impact from credit spread fluctuations irrespective of their accounting classification, in order to (i) be prepared for possible situations that require a market valuation through sale, or (ii) prevent potential loss of confidence in the institution’s medium-term viability that could affect its funding conditions due to lack of transparency. In the same vein, banks should avoid reclassifying exposures from fair value to amortised cost accounting when episodes of market volatility become apparent, with the aim of artificially containing the fluctuation of regulatory metrics. Instead, they should periodically stress exposures to credit spread risk using adverse scenarios that are aligned with historical experience of financial stress.
In terms of interest rate risk, supervisors concluded that, while most banks have a balanced positioning to cope with monetary policy normalisation, modelling of expected impacts should be strengthened. Although banks are supported by their profitability from the earnings channel, they should also carefully monitor and measure the impact of rising interest rates on their economic value of equity, which in several cases could be materially negative. Specifically, banks’ expectations in this regard are shaped by their modelling of customer behaviour in terms of deposit balances and early loan repayments; ECB Banking Supervision has expressed concerns about the ability of these models to perform in an environment of rapidly rising interest rates due to deficiencies in model calibration, model validation and back-testing practices.
The outcomes of the reviews of both interest rate risk and credit spread risk will be factored into next year’s SREP and taken into account when planning further supervisory activities.
5.5.2 Operational risk
Over the past few years, operational risk has consistently been the SREP element with the worst average scores.
The main deficiencies in the operational resilience framework include (i) the management of risks related to IT outsourcing and reliance on third-party service providers for critical functions and services, and (ii) IT security and cyber risk management, including cyber hygiene measures and cyber resilience. More specifically, operational risk (including IT and cyber risk) has increased recently as a consequence of accelerated digitalisation triggered by the pandemic, changes in consumer preferences, competition from fintechs, an increased reliance on IT outsourcing and stronger headwinds stemming from the current geopolitical situation.
During the 2022 SREP cycle, banks remained resilient to operational risk overall. Both the total number of operational loss events and loss volumes during the first half of 2022 remained similar in size to previous years. The only exception can be found in external fraud, where gross operational losses were up by almost 60% year on year, albeit still to contained levels.
Looking ahead, key challenges for banks are (i) increasing reputational and legal risks, especially for cross-border banking groups, as compliance with the growing number of swiftly adopted sanctions against Russia might prove challenging, (ii) increasing cyber risk, and (iii) increasing IT outsourcing risk.
5.5.3 Climate-related risk
Climate change poses risks to the economy and the financial sector. ECB Banking Supervision aims to ensure that banks have a safe and prudent approach to identifying, assessing and managing climate-related and environmental (C&E) risks and that they transparently disclose the risks they are exposed to. The aim is to gradually integrate C&E risks into the regular supervisory cycle and treat them in the same way as any other material risks.
Noteworthy supervisory work in 2022 included incorporating the thematic review on C&E risk and climate stress test results in the SREP.
More than 40 qualitative measures were issued to 30 significant institutions in the 2022 SREP cycle. On top of SREP measures for severe weaknesses identified in the thematic review, each significant institution received a feedback letter highlighting any shortcomings in its practices compared with the supervisory expectations.
The qualitative integration of C&E risks had an impact on the SREP scores of a small number of institutions, although this did not translate into higher overall capital requirements.
The C&E SREP measures were issued primarily in the areas of governance (26%), credit risk (14%) and business model (17%). 19% of the measures (“Multiple SREP risks”) include combinations of the three risk areas and, in a few instances, market risk and operational risk.
The vast majority of qualitative measures were concentrated in topics related to strategic and operational plans, indicating that supervisors consider this area to be a key enabler for better management of C&E risks.
The supervisors’ observations covered a wide variety of topics aimed at ensuring that C&E risks are properly integrated into strategy-setting processes and risk management frameworks. Among other things, specific examples relate to enhancing materiality assessments across relevant risks (credit, market, liquidity, operational, etc.), improving internal stress tests, expanding scenario analyses to ensure that appropriate key risk indicators are determined, set and monitored at a deeper strategic level, widening management reporting scope and frequency, and embedding further crucial elements in the risk appetite framework.
5.5.4 Risk of excessive leverage
The risk of excessive leverage (REL) was assessed for the first time in the 2022 SREP cycle with a view to identifying banks that may be subject to qualitative measures or P2Rs for the leverage ratio. REL assessments cover the contingent leverage originating from the extensive use of derivatives, securities financing transactions, off-balance-sheet items, regulatory arbitrage or institution-specific risks in items excluded from leverage ratio Pillar 1 requirement.
According to the methodology, an REL assessment is only performed if any of the risk drivers of the contingent leverage are identified as material, based on pre-defined indicators. In the 2022 SREP cycle, such assessments were performed for 36 institutions, with 18 resulting in low risk and the remaining 18 in moderate or higher risk. Following the assessments, qualitative measures were issued for four institutions.
Elevated REL was identified mostly in relation to step-in risk and symptoms of window-dressing activities, for which a more comprehensive analysis is envisaged over the coming years.
6 Conclusions and outlook
ECB Banking Supervision performed a full SREP assessment in 2022, with SREP scores assigned to banks’ overall risk profiles and their main elements. The results of the 2022 SREP cycle reflect both the resilience of and improvements in the European banking sector, while also highlighting remaining vulnerabilities and emerging potential risks. ECB Banking Supervision will continue with its focused efforts to promote prudent behaviour and the proactive management of risk, ensuring that banks remain resilient and continue supporting the real economy during challenging times.
Overall, SREP scores, capital requirements and guidance have remained broadly stable, with significant institutions maintaining solid capital and liquidity positions, which in most cases are well in excess of the levels dictated by capital requirements and guidance.
The 2022 SREP assessment of the risks and vulnerabilities in the banking sector provided input for the SSM supervisory priorities for the next three years, as published on 12 December 2022.
The SSM supervisory priorities for the 2023-25 period are:
- Strengthening resilience to immediate macro-financial and geopolitical shocks.
- Addressing digitalisation challenges and strengthening management bodies’ steering capabilities.
- Stepping up efforts in addressing climate change.
Supervisory priorities will also inform and support Joint Supervisory Teams in implementing priority areas at individual bank level for the 2023 SREP cycle. The supervisory priorities promote effectiveness and consistency in supervisory planning and foster the efficient allocation of resources. Supervisory priorities also make it easier to set risk tolerance levels and provide guidance for prioritising risks in the SREP, bearing in mind that vulnerabilities and challenges may differ from bank to bank.
© European Central Bank, 2023
Postal address 60640 Frankfurt am Main, Germany
Telephone +49 69 1344 0
Website www.bankingsupervision.europa.eu
All rights reserved. Reproduction for educational and non-commercial purposes is permitted provided that the source is acknowledged.
For specific terminology please refer to the SSM glossary (available in English only).
HTML ISBN 978-92-899-5561-4, ISSN 2811-6887, doi:10.2866/056839, QB-CX-23-001-EN-Q
For further information, please refer to ECB Banking Supervision, “Guidance on leveraged transactions”, ECB, May 2017; and the ECB letter to CEOs on leveraged transactions dated 28 March 2022.
The average amount of overall capital requirements in CET1 continues to remain well below the requirements issued in the 2019 SREP cycle, owing to the changed rules on the composition of capital to fulfil the Pillar 2 requirements, which came into effect in 2020 (brought forward by one year as part of ECB Banking Supervision’s pandemic-related capital relief measures).
As interpreted in Section 9 of the Joint ESMA and EBA Guidelines on the assessment of the suitability of members of the management body and key function holders (EBA/GL/2021/06), EBA, July 2021.
For further information, please refer to the ECB’s response to the coronavirus pandemic.