- PRESS RELEASE
ECB publishes supervisory banking statistics for the third quarter of 2020
13 January 2021
- Capital ratios of significant institutions increase in third quarter of 2020, with aggregate total capital ratio standing at 19.05% (up from 18.66% in second quarter of 2020)
- Aggregate NPL ratio falls to 2.82% – lowest level since data first published in 2015
- Annualised return on equity bounces back to stand at 2.12% (up from 0.01% in second quarter of 2020, but down from 5.83% in third quarter of 2019)
- Liquidity coverage ratio rises to 170.94% (up from 165.52% in second quarter of 2020)
- Leverage ratio increases to 5.63% in the third quarter of 2020 (up from 5.33% in second quarter of 2020)
Capital adequacy
Aggregate capital ratios for significant institutions, (i.e. banks that are supervised directly by the ECB) increased in the third quarter of 2020 relative to the previous quarter. The aggregate Common Equity Tier 1 (CET1) ratio stood at 15.21%, the aggregate tier 1 ratio stood at 16.51%, and the aggregate total capital ratio stood at 19.05%. Aggregate CET1 ratios at country level ranged from 12.54% in Spain to 28.78% in Estonia. Across SSM business models, global systemically important banks (G-SIBs) reported the lowest aggregate CET1 ratio (14.12%) and development/promotional lenders reported the highest (30.56%).
Chart 1
Total capital ratio and its components by reference period
(EUR billions; percentages)
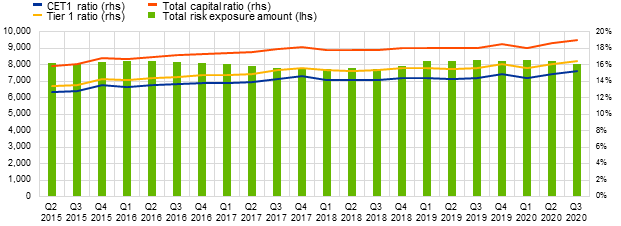
Source: ECB.
Chart 2
Capital ratios by country for the third quarter of 2020
(percentages)
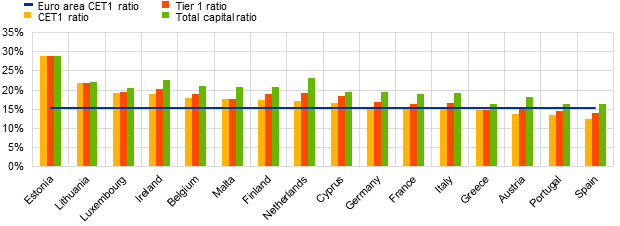
Source: ECB.
Note: Some countries participating in European banking supervision are not included in this chart, either for confidentiality reasons or because there are no significant institutions at the highest level of consolidation in that country.
Chart 3
Capital ratios by business model for the third quarter of 2020
(percentages)
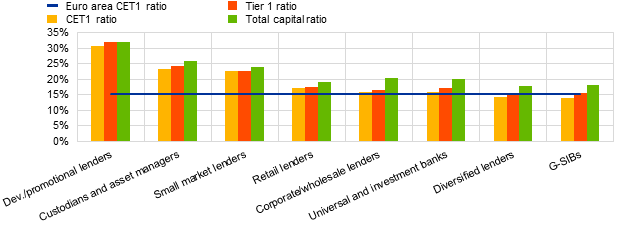
Source: ECB.
Note: “Dev./promotional lenders” refers to development and promotional lenders; “retail lenders” refers to retail and consumer credit lenders.
Asset quality
The aggregate non-performing loans (NPL) ratio fell to 2.82% in the third quarter of 2020. The stock of NPLs declined by 3.6%, falling from €503 billion in the second quarter of 2020 to €485 billion in the third quarter of 2020. At country level, the average NPL ratio ranged from 0.75% in Luxembourg to 28.85% in Greece.
Chart 4
Non-performing loans by reference period
(EUR billions; percentages)
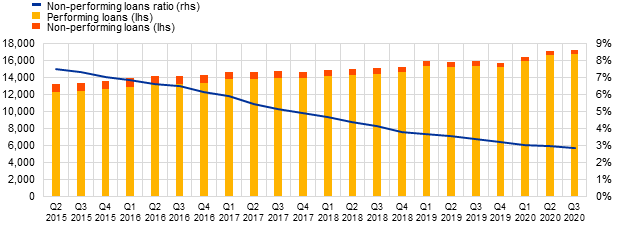
Source: ECB.
Chart 5
Non-performing loans ratios by country for the third quarter of 2020
(percentages)
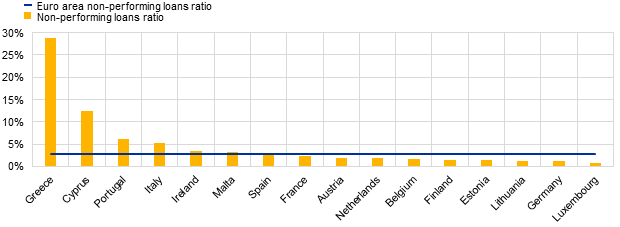
Source: ECB.
Note: Some countries participating in European banking supervision are not included in this chart, either for confidentiality reasons or because there are no significant institutions at the highest level of consolidation in that country.
Chart 6
Non-performing loans ratios by business model for the third quarter of 2020
(percentages)
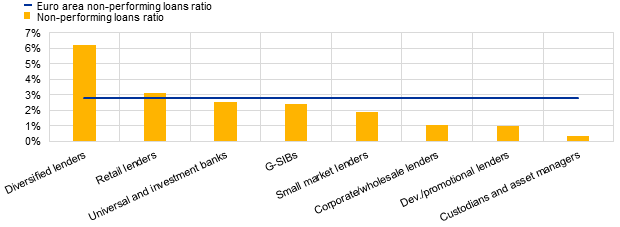
Source: ECB.
Note: “Dev./promotional lenders” refers to development and promotional lenders; “retail lenders” refers to retail and consumer credit lenders.
Return on equity
The annualised Return on Equity (RoE) stood at an aggregate level of 2.12% in the third quarter of 2020 − down from 5.83% a year earlier, but up from 0.01% in the second quarter of 2020. When looking at changes relative to the third quarter of 2019, a decline in aggregate net profits can be observed, which was driven mainly by a fall in operating income and an increase in impairments and provisions.
Chart 7
Return on equity and composition of net profit and loss by reference period
(EUR billions; percentages)
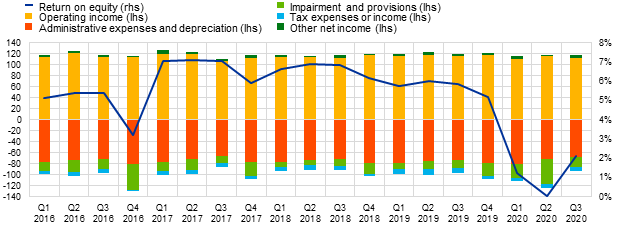
Source: ECB.
Liquidity
The aggregate liquidity coverage ratio rose to 170.94% in the third quarter of 2020, up from 165.52% in the previous quarter. That upward trend was driven mainly by a 4.9% increase in the aggregate liquidity buffer. In the third quarter of 2020, 97 significant institutions (out of a total of 110) had a liquidity coverage ratio in excess of 150%.
Chart 8
Liquidity coverage ratio by reference period
(EUR billions; percentages)
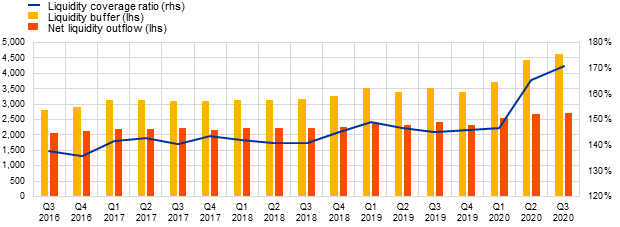
Source: ECB.
Leverage
The aggregate leverage ratio (transitional definition) rose to 5.63% in the third quarter of 2020, up from 5.33% in the previous quarter. That increase was driven by a 5.6% reduction in total exposure (the denominator in the leverage ratio), which fell from €25,016 billion in the second quarter of 2020 to €23,611 billion in the third quarter. It is worth noting in this regard that on 17 September 2020 the ECB announced that banks supervised directly by the ECB were allowed to exclude certain central bank exposures from their leverage ratios.
Chart 9
Leverage ratio by reference period
(EUR billions; percentages)
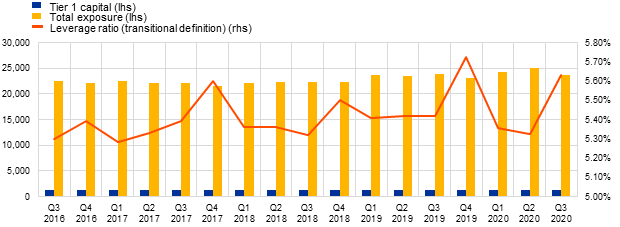
Source: ECB.
Factors affecting changes
Supervisory banking statistics are calculated by aggregating the data that are reported by banks which report COREP (capital adequacy information) and FINREP (financial information) at the relevant point in time. Consequently, changes in the amounts shown from one quarter to another can be influenced by the following factors:
- changes in the sample of reporting institutions;
- mergers and acquisitions;
- reclassifications (e.g. portfolio shifts as a result of certain assets being reclassified from one accounting portfolio to another).
For media queries, please contact Philippe Rispal, tel.: +49 69 1344 5482.
Notes
- The complete set of Supervisory banking statistics with additional quantitative risk indicators is available on the ECB’s banking supervision website.
European Central Bank
Directorate General Communications
- Sonnemannstrasse 20
- 60314 Frankfurt am Main, Germany
- +49 69 1344 7455
- media@ecb.europa.eu
Reproduction is permitted provided that the source is acknowledged.
Media contacts