- PRESS RELEASE
ECB publishes supervisory banking statistics for the first quarter of 2020
24 July 2020
- Capital ratios of significant institutions decline slightly in first quarter of 2020, with aggregate total capital ratio standing at 18.11% (down from 18.53% in fourth quarter of 2019)
- Aggregate NPL ratio declines further to stand at 3.05%, lowest level since data first published in 2015
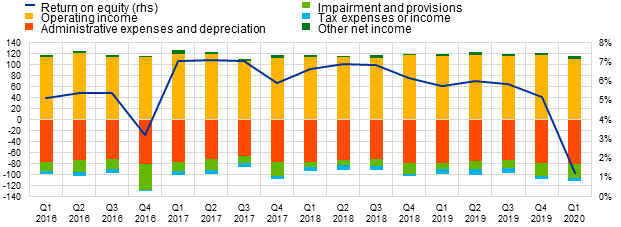
- Annualised return on equity falls to aggregate level of 1.21% at end of first quarter of 2020, down from 5.76% a year earlier
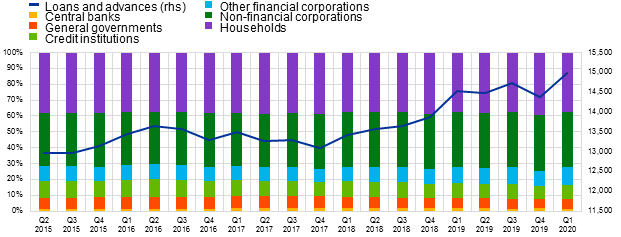
- Loans and advances increase by 4.3% to stand at €15.0 trillion in first quarter of 2020, up from €14.4 trillion in fourth quarter of 2019, driven primarily by loans and advances to non-financial corporations and other financial corporations
Capital adequacy
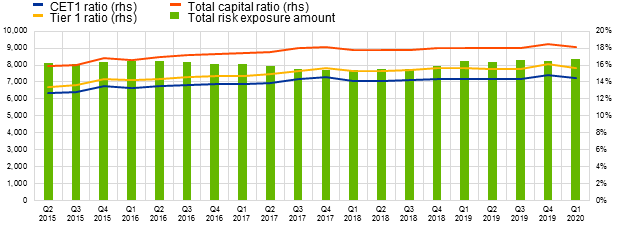
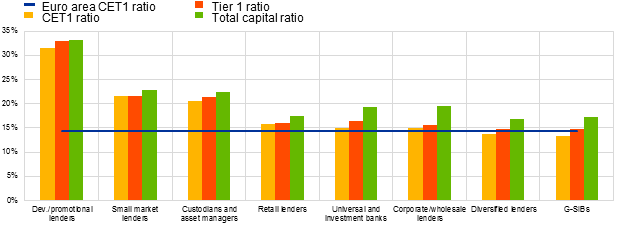
The aggregate capital ratios for the group of SSM significant institutions (i.e. those credit institutions that are supervised directly by the ECB) declined slightly in the first quarter of 2020 by comparison with the previous quarter. The aggregate Common Equity Tier 1 (CET1) ratio stood at 14.43%, the aggregate Tier 1 ratio stood at 15.65%, and the aggregate total capital ratio stood at 18.11%. Aggregate CET1 capital ratios at country level ranged from 11.85% in Spain to 28.19% in Estonia. Across SSM business models, global systemically important banks (G-SIBs) reported the lowest aggregate CET1 capital ratio (13.32%) and development/promotional lenders reported the highest (31.48%).
Chart 1
Total capital ratio and its components by reference period
(EUR billions; percentages)
Source: ECB.
Chart 2
Capital ratios by country for the first quarter of 2020
(Percentages)

Source: ECB.
Note: Some countries participating in European banking supervision are not included in this chart, either for confidentiality reasons or because there are no significant institutions at the highest level of consolidation in that country.
Chart 3
Capital ratios by business model for the first quarter of 2020
(Percentages)
Source: ECB.
Note: “Dev./promotional lenders” refers to development and promotional lenders; “retail lenders” refer to retail and consumer credit lenders.
Asset quality
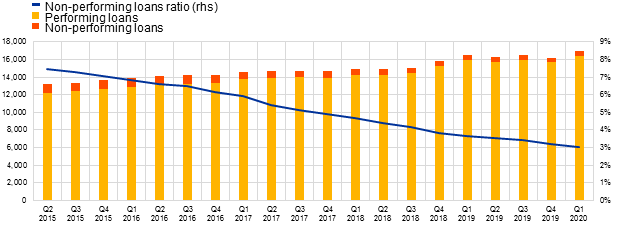
The aggregate non-performing loans ratio (NPL ratio) improved further, standing at 3.05% in the first quarter of 2020. The stock of NPLs declined by 0.99%, while the gross carrying amount of loans and advances increased by 4.63%. Across SSM business models, custodians and asset managers reported the lowest aggregate NPL ratio (0.20%), and diversified lenders reported the highest (7.50%).
Chart 4
Non-performing loans by reference period
(EUR billions; percentages)
Source: ECB.
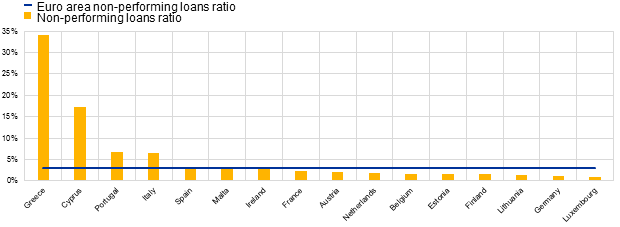
Chart 5
Non-performing loans ratio by country for the first quarter of 2020
(Percentages)
Source: ECB.
Note: Some countries participating in European banking supervision are not included in this chart, either for confidentiality reasons or because there are no significant institutions at the highest level of consolidation in that country.
Chart 6
Non-performing loans ratio by business model for the first quarter of 2020
(Percentages)
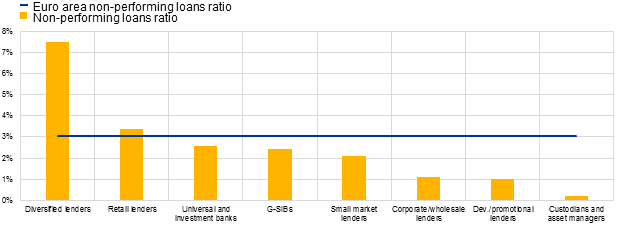
Source: ECB.
Note: “Dev./promotional lenders” refers to development and promotional lenders; “retail lenders” refer to retail and consumer credit lenders.
Liquidity
The aggregate liquidity coverage ratio rose to 146.57% in the first quarter of 2020, up from 145.93% in the previous quarter. At country level, aggregate ratios ranged from 125.65% in Greece to 402.18% in Malta. Across SSM business models, G-SIBs reported the lowest aggregate ratio (135.77%), while small market lenders reported the highest (236.66%).
Chart 7
Liquidity coverage ratio by reference period
(EUR billions; percentages)
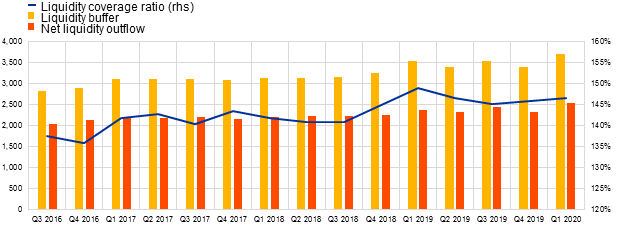
Source: ECB.
Chart 8
Liquidity coverage ratio by country for the first quarter of 2020
(Percentages)
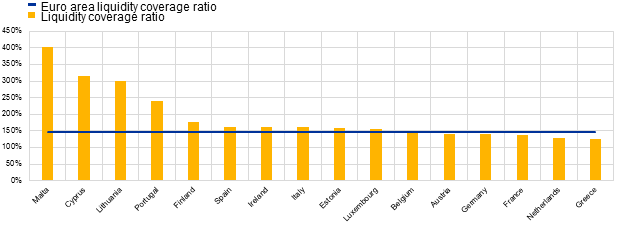
Source: ECB.
Note: Some countries participating in European banking supervision are not included in this chart, either for confidentiality reasons or because there are no significant institutions at the highest level of consolidation in that country.
Chart 9
Liquidity coverage ratio by business model for the first quarter of 2020
(Percentages)
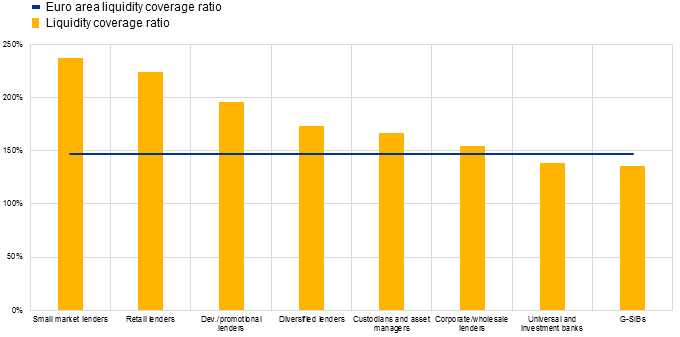
Source: ECB.
Note: “Dev./promotional lenders” refers to development and promotional lenders, “retail lenders refers” to retail and consumer credit lenders.
Return on equity
The annualised Return on Equity (RoE) fell significantly to stand at an aggregate level of 1.21% in the first quarter of 2020, down from 5.76% in the first quarter of 2019. The decline in aggregate net profits was driven by an increase in impairments and provisions (which totalled €26.73 billion in the first quarter of 2020, compared with €10.55 billion in the first quarter of 2019).
Chart 10
Return on equity and composition of net profit and loss by reference period
(EUR billions; percentages)
Source: ECB.
Lending by counterparty sector
The aggregate loans and advances of SSM significant institutions rose to €15.0 trillion in the first quarter of 2020, up from €14.4 trillion in the fourth quarter of 2019. This was driven mainly by increases in aggregate loans and advances to non-financial corporations (which rose from €5.1 trillion in the fourth quarter of 2019 to €5.3 trillion in the first quarter of 2020) and aggregate loans and advances to other financial corporations (which rose from €1.3 trillion in the fourth quarter of 2019 to €1.6 trillion in the first quarter of 2020).
Chart 11
Share of loans and advances by counterparty sector
(EUR billions; percentages)
Source: ECB.
Factors affecting changes
Supervisory banking statistics are calculated by aggregating the data that are reported by banks which report COREP (capital adequacy information) and FINREP (financial information) at the relevant point in time. Consequently, changes in the amounts shown from one quarter to another can be influenced by the following factors:
- changes in the sample of reporting institutions;
- mergers and acquisitions;
- reclassifications (e.g. portfolio shifts as a result of certain assets being reclassified from one accounting portfolio to another).
For media queries, please contact Philippe Rispal, tel.: +49 69 1344 5482.
Notes
- The complete set of Supervisory banking statistics with additional quantitative risk indicators is available on the ECB’s banking supervision website.
European Central Bank
Directorate General Communications
- Sonnemannstrasse 20
- 60314 Frankfurt am Main, Germany
- +49 69 1344 7455
- media@ecb.europa.eu
Reproduction is permitted provided that the source is acknowledged.
Media contacts